
Ringkasan
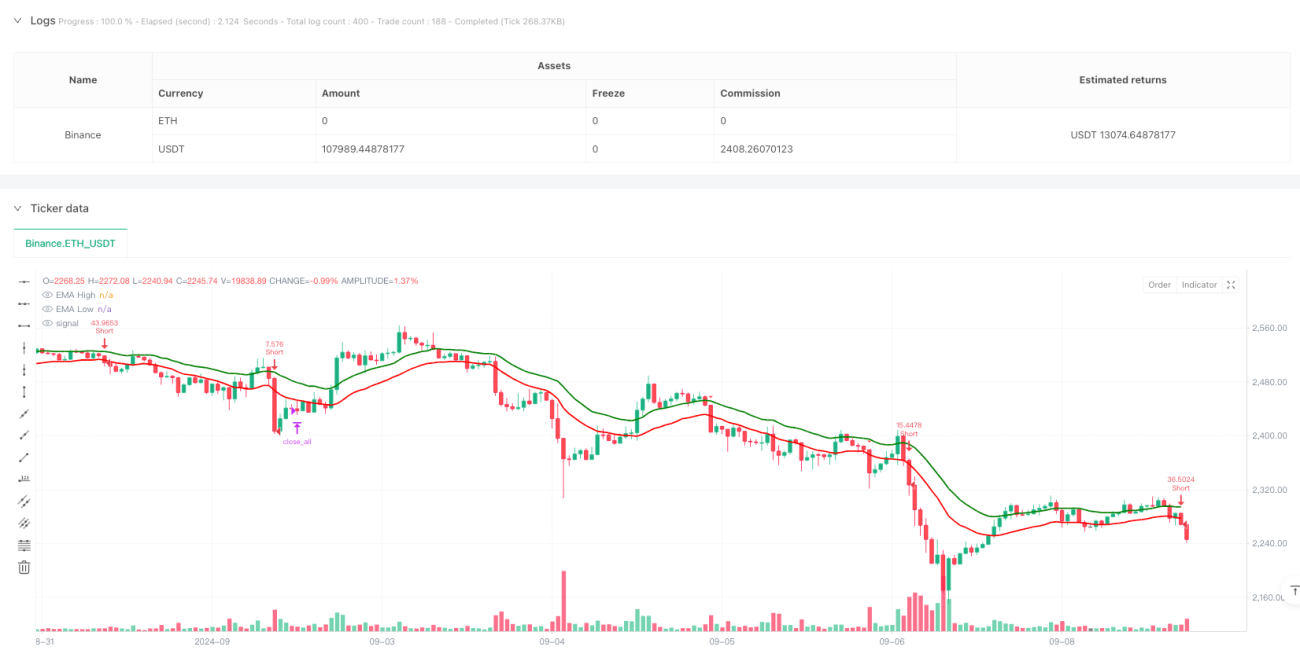
Ini adalah strategi perdagangan intraday yang didasarkan pada beberapa indikator teknis, yang digunakan untuk melakukan perdagangan dengan beberapa sinyal, seperti saluran EMA, RSI overbought dan oversold, dan konfirmasi tren MACD. Strategi ini berjalan pada siklus 3 menit, menangkap tren pasar melalui orbit EMA yang tinggi dan rendah yang digabungkan dengan konfirmasi silang RSI dan MACD, dan mengatur stop loss dinamis berbasis ATR, serta waktu penyelesaian yang tetap.
Prinsip Strategi
Strategi menggunakan 20 siklus EMA untuk menghitung harga tertinggi dan terendah masing-masing untuk membentuk saluran, yang masuk ketika harga menembus saluran dan memenuhi kondisi berikut:
- Multiple entry: EMA tinggi pada harga close out, RSI antara 50-70 dan MACD pada garis sinyal
- Masuk kosong: EMA rendah di bawah harga close, RSI antara 30-50, MACD di bawah garis
- Menggunakan ATR untuk menghitung posisi stop loss secara dinamis, dan mengatur stop loss sesuai dengan 2,5 x risiko / keuntungan
- Setiap transaksi berisiko 1% untuk akun, ukuran posisi berdasarkan stop loss distance
- Semua Posisi Peninggalan Mandat di 15:00 WIB
Keunggulan Strategis
- Verifikasi silang multi-indikator teknis untuk meningkatkan keandalan sinyal perdagangan
- Stop loss dinamis didasarkan pada indikator ATR untuk lebih beradaptasi dengan pergerakan pasar
- Rasio risiko tetap dan rasio manfaat risiko, mengendalikan risiko secara efektif
- Mempertimbangkan biaya transaksi, termasuk biaya proses
- Larangan pembiayaan simetris untuk menghindari risiko kepemilikan saham yang berlebihan
- Menetapkan waktu penutupan untuk menghindari risiko malam hari
Risiko Strategis
- Beberapa indikator dapat menyebabkan sinyal yang terlambat, yang mempengaruhi waktu masuk.
- Saluran EMA dapat menyebabkan terjadinya penembusan palsu yang sering terjadi di pasar horizontal
- Rasio risiko-manfaat tetap mungkin tidak cukup fleksibel dalam berbagai kondisi pasar
- Pembatasan RSI mungkin melewatkan beberapa tren besar
- Penutupan posisi obligasi bisa memaksa penarikan diri di posisi penting
Arah optimasi strategi
- Pertimbangkan untuk menambah indikator volume transaksi sebagai konfirmasi tambahan
- Rasio risiko / keuntungan dapat disesuaikan dengan dinamika karakteristik fluktuasi pada periode waktu yang berbeda
- Memperkenalkan indikator volatilitas pasar yang menyesuaikan RSI secara dinamis
- Pertimbangkan untuk meningkatkan intensitas filter tren untuk mengurangi false breaks
- Parameter dapat dipertimbangkan untuk disesuaikan dengan karakteristik waktu yang berbeda dalam sehari
- Menambahkan analisis volatilitas historis untuk mengoptimalkan manajemen posisi
Meringkaskan
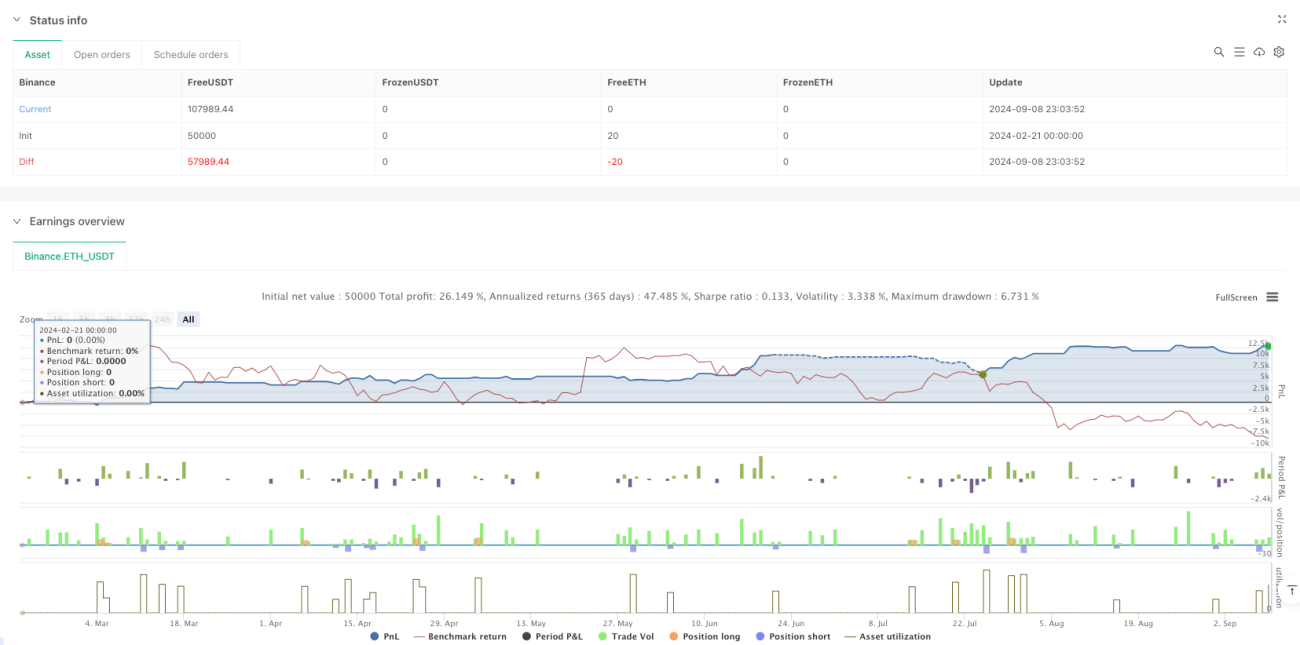
Strategi ini menggunakan kombinasi dari beberapa indikator teknis untuk membangun sistem perdagangan yang relatif lengkap. Keuntungan dari strategi ini adalah kontrol risiko yang lebih baik, termasuk mekanisme seperti stop loss dinamis, risiko tetap, dan close out. Meskipun ada beberapa risiko keterlambatan, kinerja strategi dapat ditingkatkan lebih lanjut dengan mengoptimalkan parameter dan menambahkan indikator tambahan.
- 1