Strategi pembalikan lanjutan berdasarkan RSI dan volume dalam perdagangan kuantitatif

Ringkasan
Ini adalah strategi perdagangan berbalik berdasarkan indikator RSI dan volume transaksi. Strategi ini mengidentifikasi kondisi overbought dan oversold di pasar, mengkombinasikan konfirmasi volume transaksi, dan melakukan perdagangan berbalik ketika harga berada dalam kondisi ekstrem. Gagasan inti dari strategi ini adalah melakukan perdagangan ketika indikator RSI menunjukkan sinyal overbought atau oversold, dan volume transaksi lebih tinggi dari rata-rata, melalui garis tengah RSI ((50) sebagai sinyal keluar.
Prinsip Strategi
Strategi ini didasarkan pada komponen-komponen inti berikut:
- Perhitungan indikator RSI: Menggunakan indikator RSI selama 14 siklus untuk memantau pergerakan harga
- Konfirmasi volume transaksi: menggunakan volume transaksi rata-rata bergerak (SMA) selama 20 periode
- Logika input:
- Multiple entry: ketika RSI di bawah 30 (atau oversold) dan volume transaksi lebih besar dari rata-rata bergerak
- Masuk kosong: ketika RSI lebih tinggi dari 70 (overbought) dan volume transaksi lebih besar dari rata-rata bergerak
- Logika Keluar:
- Berbagai penampilan: memakai RSI 50
- Berjalan dengan kepala kosong: RSI di bawah 50
Keunggulan Strategis
- Keputusan perdagangan yang sistematis: membangun sistem perdagangan yang obyektif melalui kombinasi indikator teknis yang jelas
- Multiple confirmation mechanism: Menggabungkan dua dimensi RSI dan volume transaksi untuk meningkatkan keandalan sinyal
- Pengendalian risiko yang baik: menggunakan manajemen dana persentase dan melarang re-perposisi
- Dukungan visualisasi: mencakup fitur tampilan grafik lengkap untuk analisis dan pemantauan yang mudah
- Adaptif: parameter utama dapat disesuaikan untuk menyesuaikan dengan lingkungan pasar yang berbeda
Risiko Strategis
- Risiko kelanjutan tren: Strategi pembalikan mungkin sering mengalami kerugian di pasar yang sedang tren
- Risiko terobosan palsu: volume transaksi yang tinggi tidak selalu berarti perubahan pasar yang nyata
- Sensitivitas parameter: siklus RSI dan pilihan overbought dan oversold memiliki pengaruh signifikan terhadap kinerja strategi
- Efek slippage: harga transaksi dapat menyimpang secara signifikan dari ekspektasi selama periode fluktuasi yang kuat
- Risiko manajemen uang: posisi rasio tetap mungkin terlalu radikal dalam kondisi pasar tertentu
Arah optimasi strategi
- Filter tren: memperkenalkan indikator untuk menilai tren, menghindari perdagangan terbalik selama tren kuat
- Parameter dinamika: overbought overbought RSI yang disesuaikan secara dinamis berdasarkan volatilitas pasar
- Optimasi Keluar: Meningkatkan Stop Loss dan Pelacakan Stop Loss, Meningkatkan Kemampuan Kontrol Risiko
- Peningkatan analisa volume transaksi: penambahan analisa bentuk volume transaksi untuk meningkatkan kualitas sinyal
- Filter waktu: Tambahkan jendela waktu transaksi untuk menghindari periode transaksi yang tidak efisien
Meringkaskan
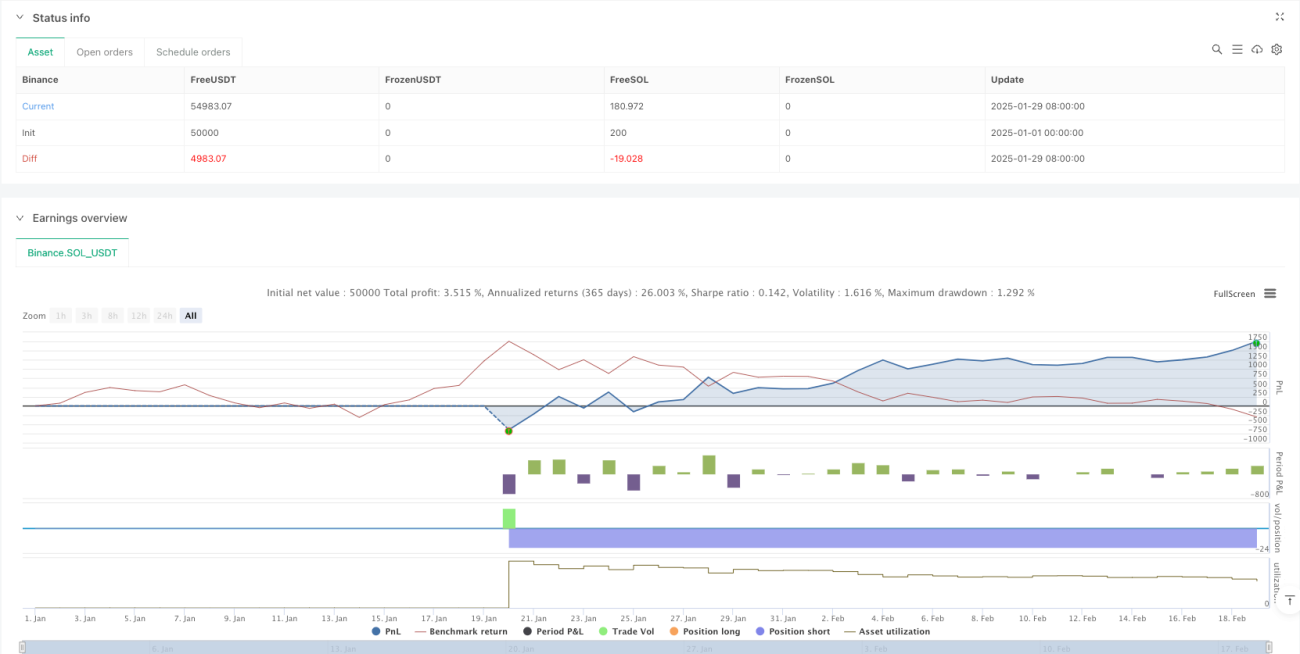
Strategi ini dengan menggabungkan indikator RSI dan analisis volume transaksi, membangun sebuah sistem perdagangan terbalik yang lengkap. Strategi ini dirancang dengan baik, memiliki operasi yang baik dan fleksibilitas. Dengan arah optimasi yang disarankan, strategi ini masih memiliki ruang untuk peningkatan lebih lanjut.
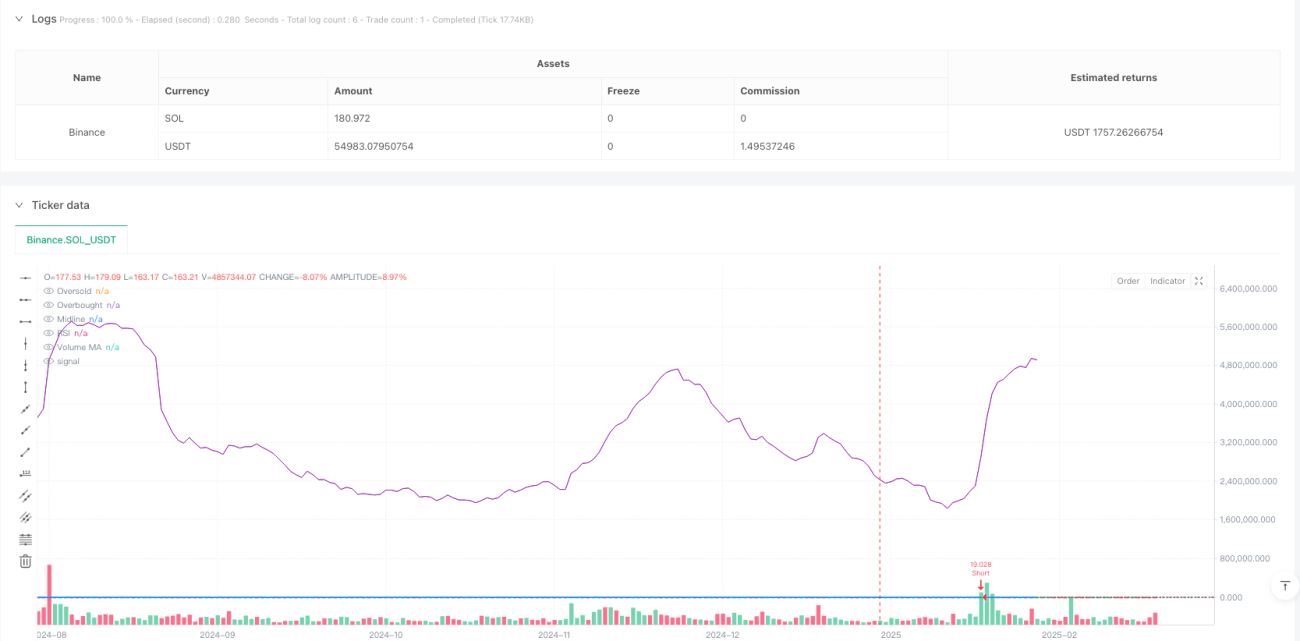
/*backtest
start: 2025-01-01 00:00:00
end: 2025-02-19 08:00:00
period: 1d
basePeriod: 1d
exchanges: [{"eid":"Binance","currency":"SOL_USDT"}]
*/

//@version=5
strategy("RSI & Volume Contrarian Strategy", overlay=true, initial_capital=100000, default_qty_type=strategy.percent_of_equity, default_qty_value=10, pyramiding=0)

//---------------------------- 1