Strategi Crossover Momentum Tren Dinamis - Sistem Perdagangan Kuantitatif Berdasarkan Indikator EMA dan MACD Ganda

Ringkasan
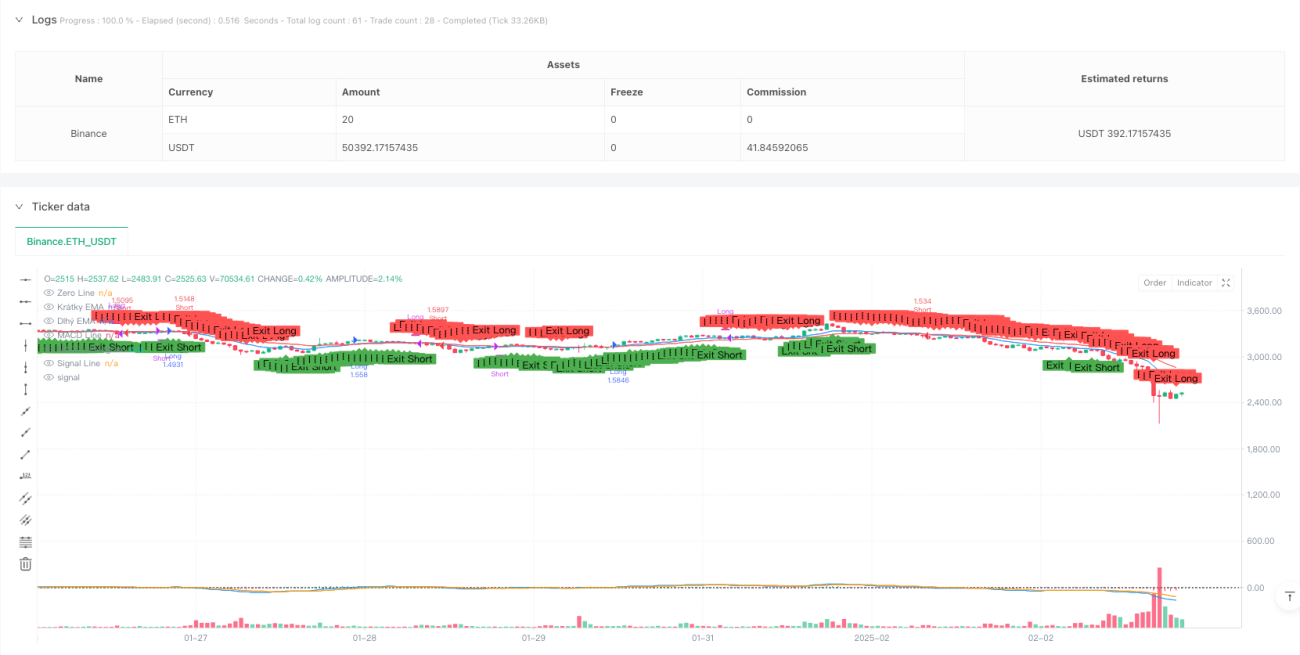
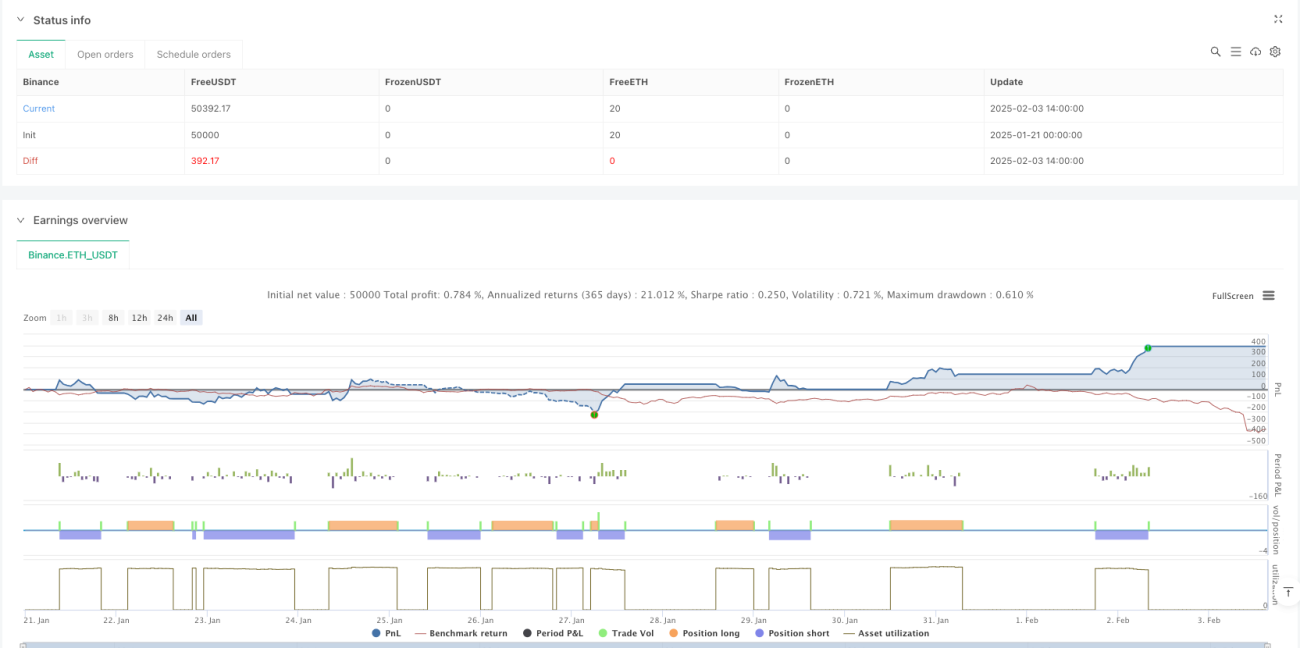
Strategi ini adalah sistem perdagangan kuantitatif yang menggabungkan indikator Moving Average (EMA) dan Moving Average Trend / Deviation (MACD). Dengan mengintegrasikan sinyal silang dari EMA jangka pendek dan jangka panjang, serta konfirmasi dinamika MACD, strategi ini memberikan pedagang solusi pelacakan tren yang komprehensif. Strategi ini juga mencakup mekanisme stop loss dan stop loss dinamis, yang secara efektif mengendalikan risiko sambil mengejar keuntungan maksimal.
Prinsip Strategi
Logika inti dari strategi ini didasarkan pada sinergi antara dua indikator teknis. Pertama, menggunakan 12 siklus dan 26 siklus EMA untuk mengidentifikasi tren pasar, ketika EMA jangka pendek melewati EMA jangka panjang menghasilkan sinyal do, dan ketika EMA jangka pendek melewati EMA jangka panjang menghasilkan sinyal do. Kedua, menggunakan indikator MACD (setelan 12, 26, 9) untuk mengkonfirmasi dinamika tren, yang mengharuskan hubungan posisi garis MACD dengan garis sinyal untuk mendukung sinyal perdagangan yang dihasilkan oleh EMA.
Keunggulan Strategis
- Mekanisme pengesahan sinyal yang disempurnakan: Pengesahan ganda melalui EMA silang dan MACD momentum, mengurangi risiko penembusan palsu secara signifikan
- Fleksibilitas manajemen risiko: menggunakan stop loss per persen untuk menyesuaikan dengan kondisi pasar yang berbeda dan varietas perdagangan
- Efek visualisasi yang sangat baik: Garis EMA, indikator MACD dan tanda sinyal perdagangan ditampilkan dengan jelas pada grafik
- Parameter yang dapat disesuaikan: memungkinkan penyesuaian siklus EMA, parameter MACD, dan rasio kontrol risiko untuk strategi perdagangan yang berbeda
Risiko Strategis
- Risiko reversal tren: mungkin terjadi crossover yang sering terjadi di pasar yang bergoyang, yang menyebabkan sinyal palsu
- Masalah keterbelakangan: EMA dan MACD adalah indikator keterbelakangan yang mungkin kehilangan titik masuk terbaik dalam situasi yang cepat
- Risiko manajemen dana: Stop loss persentase tetap mungkin tidak cukup fleksibel dalam lingkungan volatilitas tinggi
- Risiko pengoptimalan parameter: pengoptimalan berlebihan dapat menyebabkan strategi tidak berkinerja dengan hasil pengujian di lapangan
Arah optimasi strategi
- Memperkenalkan indikator volatilitas: disarankan untuk menambahkan indikator ATR untuk secara dinamis menyesuaikan level stop loss dan stop loss
- Menambahkan filter kondisi pasar: Anda dapat menilai kekuatan tren melalui indikator seperti ADX, menghindari perdagangan di pasar yang bergoyang
- Optimalkan mekanisme konfirmasi sinyal: pertimbangkan untuk menambahkan konfirmasi volume pengiriman atau indikator momentum lainnya sebagai tambahan
- Pengelolaan dana yang lebih baik: implementasi sistem manajemen posisi dinamis berdasarkan hak dan kepentingan akun
Meringkaskan
Ini adalah strategi pelacakan tren yang dirancang secara rasional dan logis. Dengan menggabungkan keunggulan EMA dan MACD, menghasilkan sinyal perdagangan yang lebih andal sambil menjaga strategi tetap sederhana dan mudah dimengerti.
- 1