Strategi Pembalikan Tren Momentum Ganda Berdasarkan RSI dan Stochastic RSI

Ringkasan
Ini adalah strategi perdagangan reversal tren yang menggabungkan indikator relatif kuat (RSI) dan indikator relatif kuat (RSI) secara acak. Strategi ini menangkap potensi reversal dengan mengidentifikasi keadaan overbought dan oversold di pasar dan perubahan momentum. Inti dari strategi ini adalah menggunakan RSI sebagai indikator dasar dinamika dan kemudian menghitung RSI stokastik berdasarkan ini untuk lebih mengkonfirmasi arah perubahan pergerakan harga.
Prinsip Strategi
Logika utama dari strategi ini terdiri dari beberapa langkah penting berikut:
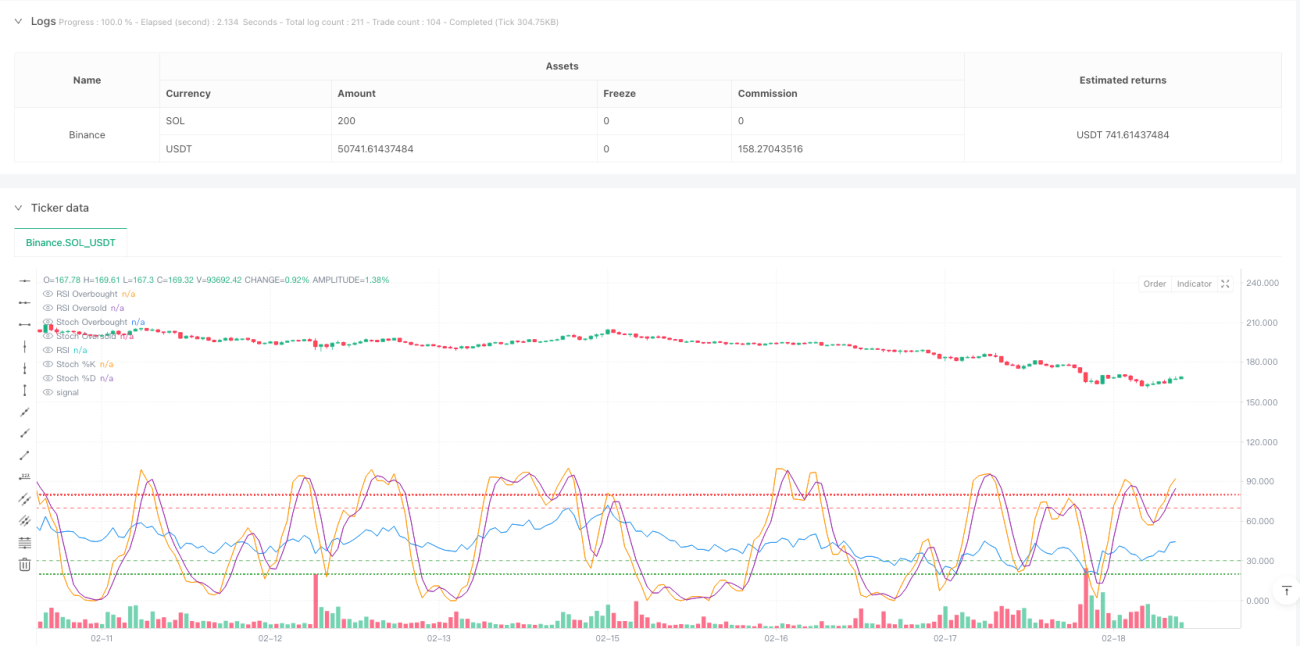
- Pertama menghitung nilai RSI dari harga close out untuk menilai kondisi overbought dan oversold secara keseluruhan
- Perhitungan% K dan% D dari RSI Stokastik berdasarkan nilai RSI
- Trigger multi-sinyal ketika RSI berada di zona oversold (default di bawah 30) dan% K garis Stochastic RSI dari bawah ke atas melewati% D garis
- Sinyal shorting dipicu ketika RSI berada di zona overbought (default lebih tinggi dari 70) dan %K dari Stochastic RSI melintasi %D dari atas ke bawah
- Ketika terjadi kondisi RSI yang berlawanan atau ketika terjadi reverse crossover Stochastic RSI, posisi kosong akan keluar.
Keunggulan Strategis
- Mekanisme double confirmation - penggunaan RSI dan Stochastic RSI dalam kombinasi dapat secara efektif mengurangi risiko false breakout
- Parameter yang dapat disesuaikan - Parameter penting dari strategi seperti siklus RSI, overbought dan oversold threshold dapat disesuaikan dengan kondisi pasar yang berbeda
- Visualisasi Dinamis - Strategi menyediakan tampilan grafik real-time dari RSI dan Stochastic RSI untuk memudahkan trader untuk memantau
- Integrasi Manajemen Risiko - Mengandung mekanisme Stop Loss dan Capture Profit yang lengkap
- Adaptif - dapat diterapkan untuk berbagai periode waktu dan lingkungan pasar
Risiko Strategis
- Risiko pasar bergoyang - sinyal palsu yang mungkin sering terjadi dalam pasar bergoyang horizontal
- Risiko keterlambatan - sinyal mungkin mengalami keterlambatan karena penggunaan multiple smoothing
- Sensitivitas parameter - pengaturan parameter yang berbeda dapat menyebabkan hasil transaksi yang berbeda secara signifikan
- Ketergantungan pada kondisi pasar - mungkin akan kehilangan bagian dari pasar dalam tren yang kuat
- Manajemen risiko - perlu mengatur rasio kepemilikan yang masuk akal untuk mengendalikan risiko
Arah optimasi strategi
- Tambahkan filter tren - Anda dapat menambahkan rata-rata bergerak jangka panjang sebagai filter tren, hanya mengambil posisi di arah tren
- Optimasi mekanisme stop loss - dapat memperkenalkan stop loss dinamis, seperti stop loss tracking atau stop loss ATR
- Pengenalan indikator lalu lintas - kombinasi analisis lalu lintas dapat meningkatkan keandalan sinyal
- Tambahkan filter waktu - untuk menghindari waktu siaran berita penting atau waktu-waktu dengan mobilitas rendah
- Mengembangkan parameter adaptasi - menyesuaikan parameter strategi secara otomatis sesuai dengan fluktuasi pasar
Meringkaskan
Ini adalah strategi komprehensif yang menggabungkan momentum dan trend reversal untuk mengidentifikasi peluang perdagangan potensial melalui sinergi RSI dan Stochastic RSI. Strategi ini dirancang secara rasional, memiliki kemampuan penyesuaian dan adaptasi yang baik. Namun, dalam aplikasi praktis, perlu memperhatikan pilihan dan pengendalian risiko lingkungan pasar, dan disarankan untuk melakukan pengembalian yang memadai dan pengoptimalan parameter sebelum perdagangan langsung.
/*backtest
start: 2024-06-15 00:00:00
end: 2025-02-19 08:00:00
period: 1h
basePeriod: 1h
exchanges: [{"eid":"Binance","currency":"SOL_USDT"}]
*/

//@version=5
strategy("RSI + Stochastic RSI Strategy", overlay=true, initial_capital=100000, default_qty_type=strategy.percent_of_equity, default_qty_value=10)

// INPUTS- 1