Indikator teknis multidimensi mengintegrasikan strategi terobosan tren

Ringkasan
Strategi ini adalah sistem perdagangan yang menggabungkan beberapa indikator teknis dan pola grafik untuk memecahkan tren. Ini menangkap titik-titik perubahan tren pasar dengan mengidentifikasi bentuk grafik penting (seperti double top / double bottom, head / shoulder top / bottom) dan harga yang terobosan, sambil menggabungkan indikator teknis seperti EMA, ATR dan volume transaksi untuk pemfilteran sinyal dan manajemen risiko, untuk pelacakan tren yang efisien dan kontrol risiko.
Prinsip Strategi
Logika inti dari strategi ini terdiri dari tiga bagian utama:
- Identifikasi pola grafik: Menggunakan metode jendela geser untuk mengidentifikasi bentuk teknik klasik seperti dua puncak / dua dasar, kepala dan bahu, dan sinyal pembalikan tren melalui perbandingan antara titik tinggi dan rendah dan konfirmasi silang EMA.
- Sistem Konfirmasi Tren: Menggunakan 50 siklus EMA sebagai filter tren, digabungkan dengan harga yang menerobos untuk mengkonfirmasi arah tren, dengan filter volume transaksi ((membutuhkan volume transaksi lebih tinggi dari rata-rata 20 hari 120%) untuk memverifikasi efektivitas sinyal.
- Sistem manajemen risiko: Berdasarkan 14 siklus ATR pengaturan dinamis stop loss, dengan 1,5 kali lipat ATR penggandaan untuk mencapai kontrol yang tepat dari risiko-to-keuntungan rasio.
Keunggulan Strategis
- Integrasi sinyal multi-dimensi: informasi pasar yang menggabungkan pola grafik, rata-rata bergerak, volatilitas dan volume transaksi dalam beberapa dimensi, meningkatkan keandalan sinyal.
- Manajemen Risiko Dinamis: Menggunakan ATR untuk secara dinamis menyesuaikan posisi stop loss dan stop loss untuk menyesuaikan dengan kondisi pasar yang berbeda.
- Tingkat otomatisasi yang tinggi: sistem secara otomatis mengenali bentuk, mengirimkan sinyal perdagangan dan melaksanakan pesanan, mengurangi intervensi manusia.
- Penjelasan visual yang jelas: Intuisi menunjukkan sinyal perdagangan melalui penanda grafis dan sistem peringatan.
Risiko Strategis
- Risiko terobosan palsu: sinyal terobosan palsu dapat muncul di pasar yang bergejolak, yang perlu dikonfirmasi melalui volume transaksi yang ketat.
- Risiko keterlambatan: Indikator seperti Moving Average dan ATR memiliki keterlambatan tertentu, dan mungkin melewatkan waktu terbaik untuk masuk.
- Sensitivitas parameter: Efek strategi dipengaruhi oleh pengaturan parameter yang lebih besar, yang diperlukan untuk menentukan parameter optimal melalui pengoptimalan umpan balik.
- Ketergantungan pada kondisi pasar: Performa strategi mungkin tidak optimal dalam pasar horizontal yang tidak menunjukkan tren.
Arah optimasi strategi
- Memperkenalkan identifikasi lingkungan pasar: menambahkan indikator kekuatan tren (seperti ADX) untuk membedakan pasar tren dari pasar goyah, parameter strategi penyesuaian dinamis.
- Optimalkan sinyal penyaringan: Anda dapat mempertimbangkan untuk menambahkan indikator getaran seperti RSI untuk lebih memfilter sinyal false breakout.
- Pengendalian risiko yang lebih baik: memperkenalkan sistem manajemen posisi, menyesuaikan ukuran kepemilikan posisi sesuai dengan dinamika pasar yang berfluktuasi.
- Meningkatkan Adaptabilitas: Mengembangkan sistem parameter adaptasi untuk mengoptimalkan parameter strategi secara otomatis berdasarkan kondisi pasar.
Meringkaskan
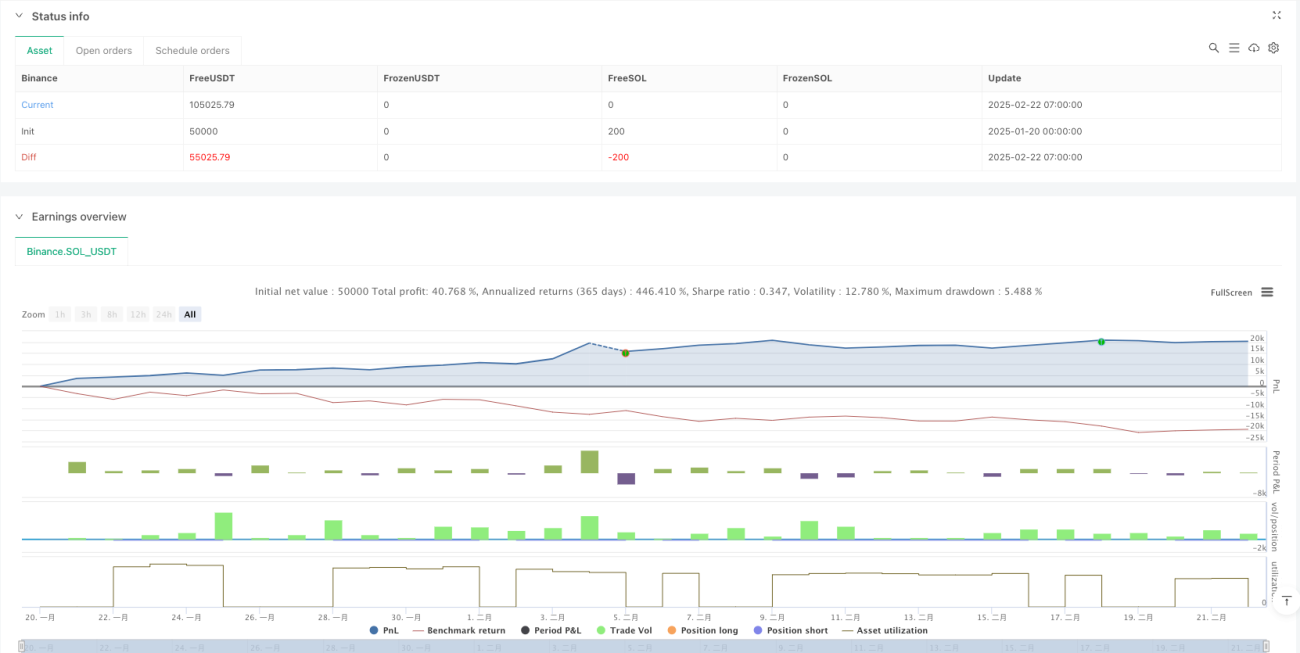
Strategi ini memungkinkan penangkapan yang efektif dari titik balik tren pasar melalui aplikasi terpadu dari indikator teknis multi-dimensi. Desain sistem mempertimbangkan secara menyeluruh elemen kunci seperti generasi sinyal, pengakuan tren, dan kontrol risiko, dan memiliki kepraktisan yang kuat. Dengan arah optimasi yang direkomendasikan, stabilitas dan adaptasi strategi diharapkan dapat ditingkatkan lebih lanjut.
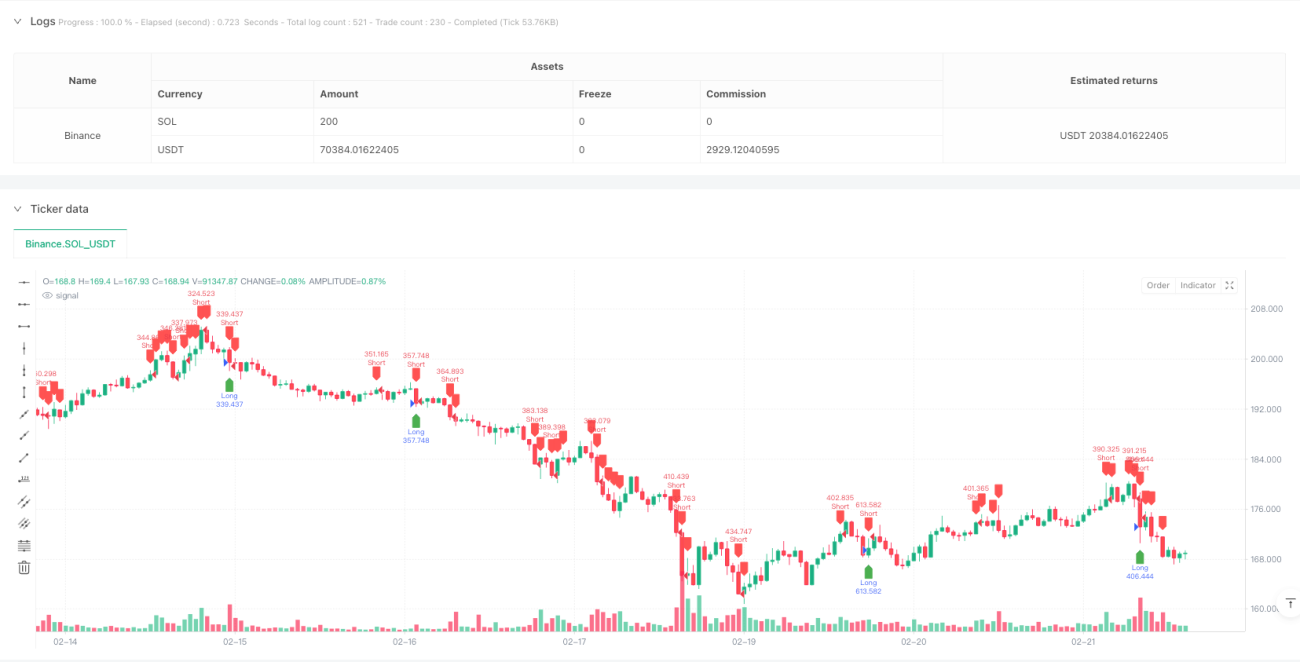
/*backtest
start: 2025-01-20 00:00:00
end: 2025-02-22 08:00:00
period: 1h
basePeriod: 1h
exchanges: [{"eid":"Binance","currency":"SOL_USDT"}]
*/

//@version=5
strategy("Ultimate Pattern Finder", overlay=true, default_qty_type=strategy.percent_of_equity, default_qty_value=100)

// 🎯 CONFIGURABLE PARAMETERS- 1