
Gambaran Umum
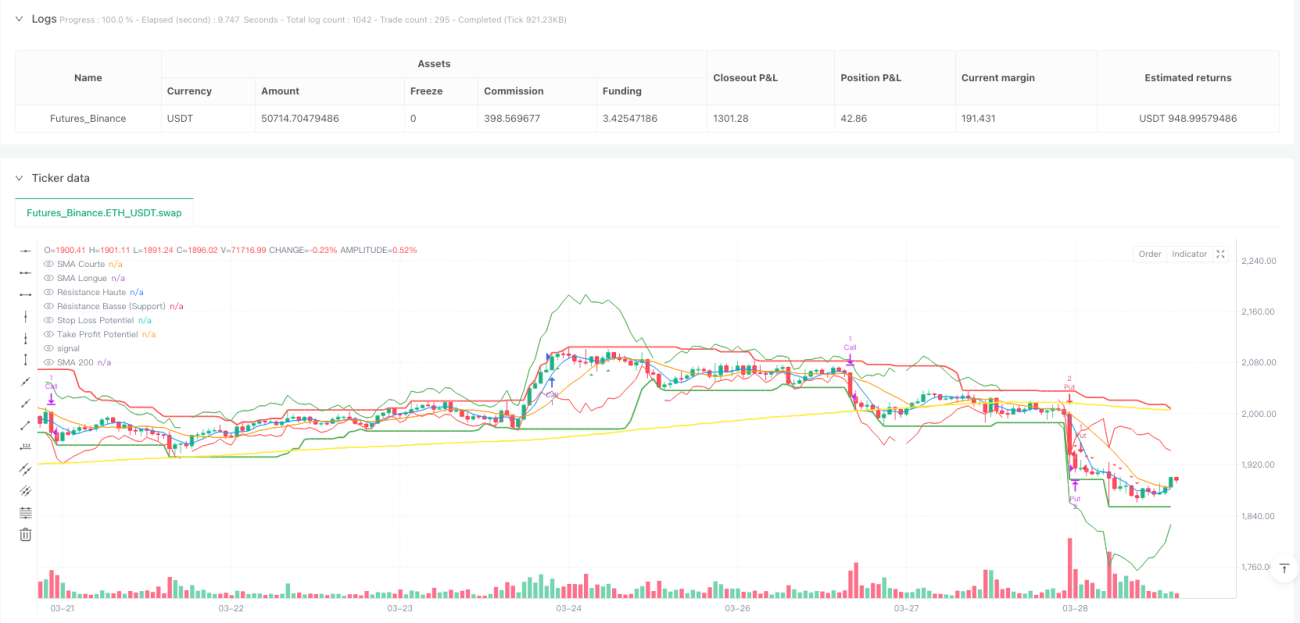
Strategi ini adalah strategi prediksi tren jangka pendek multi-dimensi yang berfokus pada penggunaan efek sinergi dari beberapa indikator teknis untuk mengidentifikasi dan memprediksi perubahan tren jangka pendek di pasar keuangan. Strategi ini mengintegrasikan alat analisis teknis kunci seperti Simple Moving Average (SMA), Relative Strength Index (RSI), Average Directional Index (ADX), Average True Range (ATR), Moving Average Convergence Divergence (MACD), dan Stochastic Oscillator, yang bertujuan untuk meningkatkan akurasi dan keandalan sinyal trading.
Prinsip Strategi
Prinsip inti strategi ini didasarkan pada analisis sinergi multi-indikator dan mekanisme konfirmasi tren. Sinyal trading dihasilkan dengan mempertimbangkan faktor-faktor kunci berikut:
- Persilangan moving average jangka pendek dan jangka panjang
- Status overbought/oversold RSI
- Perubahan garis MACD dan garis sinyal
- Indikator momentum Stochastic Oscillator
- Kekuatan tren ADX
- Tren pasar keseluruhan moving average 200 periode
- Volatilitas pasar terkini
Strategi ini secara dinamis menghitung titik masuk potensial, stop loss, dan take profit, serta menyesuaikan parameter-parameter kunci ini berdasarkan volatilitas pasar terkini, sehingga mewujudkan manajemen risiko dan eksekusi trading.
Keunggulan Strategi
- Analisis multi-indikator komprehensif: Dengan mengintegrasikan beberapa indikator teknis, mengurangi risiko kesalahan penilaian yang mungkin ditimbulkan oleh satu indikator.
- Manajemen risiko dinamis: Mekanisme stop loss dan take profit berbasis ATR yang dapat menyesuaikan posisi sesuai volatilitas pasar.
- Kerangka waktu yang fleksibel: Mendukung berbagai periode trading dari 5 menit hingga 4 jam.
- Ukuran posisi adaptif: Menyesuaikan ukuran posisi secara dinamis berdasarkan modal yang tersedia dan persentase risiko per transaksi.
- Konfirmasi kekuatan tren: Memvalidasi efektivitas tren melalui indikator ADX, menghindari trading yang terlalu sering di pasar yang bergerak sideways.
Risiko Strategi
- Kompleksitas multi-indikator dapat menyebabkan keterlambatan dalam pembangkitan sinyal.
- Di lingkungan pasar yang sangat tidak stabil, indikator dapat memberikan sinyal yang saling bertentangan.
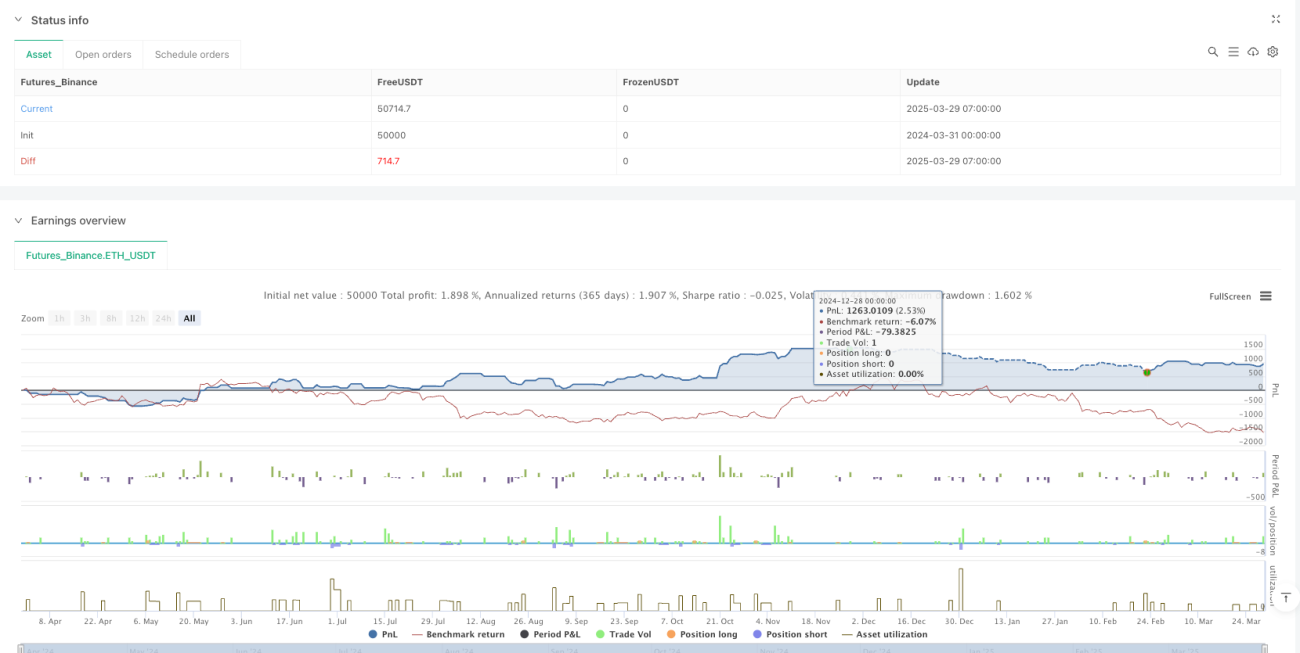
- Hasil backtest mungkin tidak sepenuhnya mewakili kinerja trading aktual di masa depan.
- Leverage trading dapat memperbesar kerugian secara signifikan.
- Tidak mempertimbangkan faktor fundamental dan kejadian pasar yang tiba-tiba.
Arah Optimasi Strategi
- Memperkenalkan algoritma machine learning untuk menyesuaikan bobot indikator secara dinamis.
- Menambahkan lebih banyak indikator fundamental dan sentimen.
- Mengembangkan algoritma manajemen posisi yang lebih cerdas.
- Menyesuaikan parameter khusus untuk berbagai pasar dan jenis aset.
- Mengintegrasikan analisis berita real-time dan sentimen media sosial.
Kesimpulan
Ini adalah strategi prediksi tren jangka pendek multi-dimensi yang digerakkan oleh data. Melalui kombinasi indikator teknis yang kompleks dan mekanisme manajemen risiko dinamis, strategi ini bertujuan untuk meningkatkan akurasi dan keandalan pengambilan keputusan trading. Meskipun strategi ini memiliki keunggulan teoretis yang signifikan, penerapannya di dunia nyata tetap memerlukan kehati-hatian serta backtest dan optimasi yang berkelanjutan.
- 1