
2
Follow
502
Followers
Ikhtisar
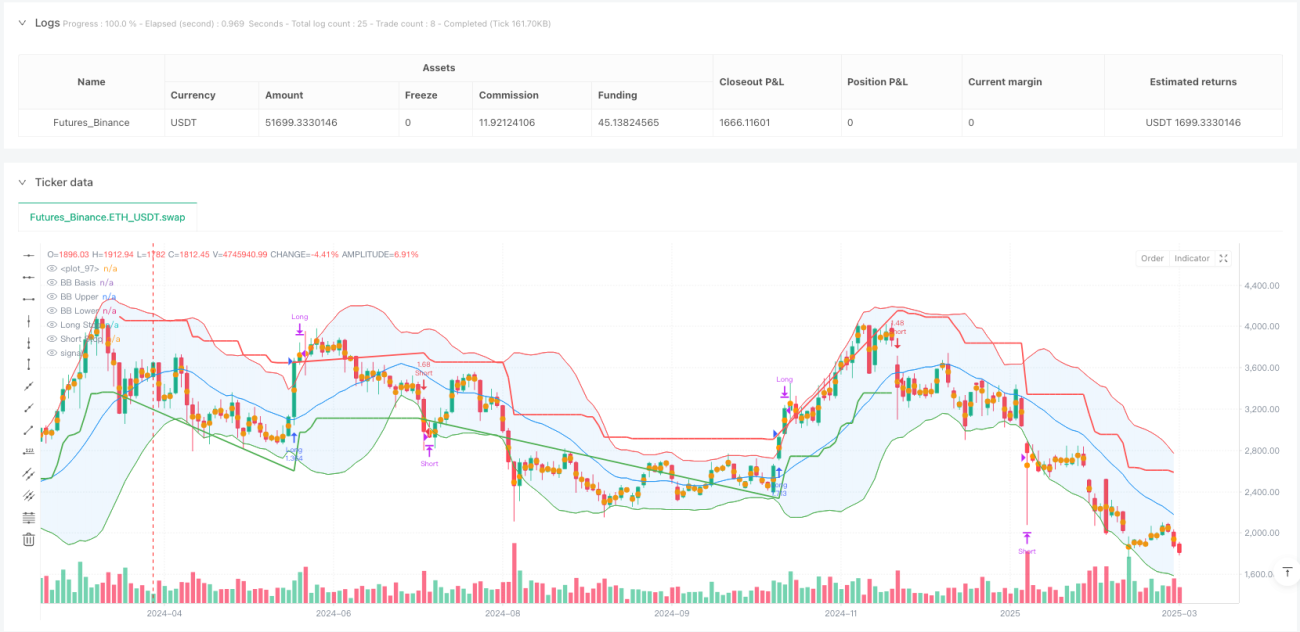
Artikel ini menjelaskan strategi trading komposit yang menggabungkan Bollinger Bands dan SuperTrend. Dengan mengintegrasikan beberapa alat analisis teknis, strategi ini bertujuan untuk memberikan sinyal masuk dan keluar pasar yang lebih akurat sambil mengurangi risiko trading.
Prinsip Strategi
Inti strategi ini terdiri dari dua bagian utama: Bollinger Bands dan SuperTrend.
- Bagian Perhitungan Bollinger Bands:
- Menggunakan moving average (MA) yang dapat dikonfigurasi untuk menghitung garis dasar
- Menghasilkan pita atas dan bawah berdasarkan kelipatan standar deviasi
- Mendukung berbagai jenis moving average: Simple Moving Average (SMA), Exponential Moving Average (EMA), Smoothed Moving Average (SMMA), Weighted Moving Average (WMA), dan Volume Weighted Moving Average (VWMA)
- Bagian SuperTrend:
- Menggunakan Average True Range (ATR) untuk menghitung level stop-loss
- Secara dinamis menentukan arah tren pasar
- Menghasilkan sinyal beli/jual berdasarkan perubahan tren
Keunggulan Strategi
- Kombinasi Multi-Indikator: Meningkatkan akurasi sinyal dengan menggabungkan Bollinger Bands dan SuperTrend
- Konfigurasi Fleksibel: Dapat menyesuaikan jenis moving average, parameter, dan metode perhitungan
- Stop-Loss Dinamis: Mekanisme stop-loss berbasis ATR secara efektif mengelola risiko
- Visualisasi Ditingkatkan: Menyediakan pengisian status tren dan label sinyal
- Manajemen Risiko: Mengatur manajemen posisi berdasarkan persentase dan batasan pyramiding
Risiko Strategi
- Sensitivitas Parameter: Dalam kondisi pasar yang berbeda, parameter mungkin perlu sering disesuaikan
- Keterbatasan Backtesting: Kinerja data historis tidak menjamin kinerja di masa depan
- Risiko Peralihan Long/Short: Perubahan posisi yang sering dapat meningkatkan biaya trading
- Keterlambatan Indikator: Indikator teknis memiliki keterlambatan sinyal tertentu
Arah Optimasi Strategi
- Memperkenalkan algoritma machine learning untuk mengoptimalkan parameter secara dinamis
- Menambahkan filter tambahan, seperti konfirmasi volume
- Mengembangkan mekanisme verifikasi multi-timeframe
- Mengoptimalkan modul manajemen risiko dengan memperkenalkan strategi kontrol posisi yang lebih presisi
Kesimpulan
Ini adalah strategi trading yang menggabungkan beberapa indikator dinamis. Melalui kombinasi Bollinger Bands dan SuperTrend, strategi ini menyediakan sistem sinyal trading yang relatif komprehensif. Inti dari strategi ini adalah menyeimbangkan akurasi sinyal dan manajemen risiko, namun tetap perlu terus dioptimalkan dan disesuaikan dengan kondisi pasar yang berbeda.
Source
Pine
/*backtest
start: 2024-04-01 00:00:00
end: 2025-03-31 00:00:00
period: 2d
basePeriod: 2d
exchanges: [{"eid":"Futures_Binance","currency":"ETH_USDT"}]
*/

//@version=6
strategy("Combined BB & New SuperTrend Strategy", overlay=true, initial_capital=100000, default_qty_type=strategy.percent_of_equity, default_qty_value=10, pyramiding=0)

//============================Strategy parameters
Related strategies
Comment
All comments (0)
No data
- 1