
[trans]
Ikhtisar
Strategi trading multidimensi pivot point dengan sistem indikator Fibonacci dinamis adalah strategi trading berbasis analisis teknikal yang terutama memanfaatkan pivot point intraday, central pivot range (CPR), level retracement Fibonacci, Volume Weighted Average Price (VWAP), dan moving average serta berbagai indikator lainnya untuk mengidentifikasi potensi peluang beli dan jual. Strategi ini cocok untuk trader intraday, khususnya untuk perdagangan jangka pendek pada grafik 3 menit. Inti dari strategi ini adalah menentukan apakah candle dengan kondisi tertentu menyentuh level support dan resistance kunci, sehingga memicu sinyal trading.
Strategi ini menggunakan sistem pivot point yang dihitung dari high, low, dan close harian, dikombinasikan dengan VWAP dan Moving VWAP (MVWAP) sebagai referensi support dan resistensi dinamis. Selain itu, melalui indikator teknikal seperti Relative Strength Index (RSI), Simple Moving Average (SMA), dan Exponential Moving Average (EMA), dibangunlah sistem pengambilan keputusan trading yang komprehensif.
Strategi pertama-tama mengidentifikasi candle hijau (naik) dan merah (turun) yang memenuhi syarat, kemudian menentukan apakah candle-candle ini menyentuh level harga kunci seperti pivot point, support, resistensi, atau VWAP. Ketika candle merah menyentuh level harga kunci, sinyal beli (CE) dipicu; ketika candle hijau menyentuh level harga kunci, sinyal jual (PE) dipicu. Logika pembalikan ini mencerminkan konsep inti dalam mencari potensi titik balik di level harga kunci.
Prinsip Strategi
Prinsip strategi ini didasarkan pada perilaku pasar di mana harga berfluktuasi di sekitar level support dan resistensi kunci, dikombinasikan dengan pola candle, volume, dan indikator momentum untuk pengambilan keputusan trading. Penjelasan prinsip secara rinci adalah sebagai berikut:
-
Mekanisme Identifikasi Candle:
- Candle Hijau (Naik): Harga penutupan lebih tinggi dari harga pembukaan, tinggi badan candle setidaknya 17 poin, harga pembukaan lebih rendah dari low ditambah 0,382 kali rentang candle, harga penutupan lebih tinggi dari low ditambah 0,682 kali rentang candle.
- Candle Merah (Turun): Harga penutupan lebih rendah dari harga pembukaan, tinggi badan candle setidaknya 17 poin.
-
Sistem Perhitungan Pivot Point:
- Pivot Point Harian (PP): (High harian + Low harian + Close harian) / 3
- Level Resistensi: R1, R2, R3, R4
- Level Support: S1, S2, S3, S4
- Central Pivot Range (CPR): Terdiri dari CPR bawah dan CPR atas, menyediakan area harga potensial di mana pasar mungkin mengalami konsolidasi.
-
Referensi Harga Dinamis:
- VWAP (Volume Weighted Average Price): Mencerminkan tingkat harga rata-rata setelah mempertimbangkan faktor volume.
- MVWAP (Moving Volume Weighted Average Price): Rata-rata pergerakan dari VWAP, memberikan referensi harga yang lebih halus.
-
Sistem Indikator Pendukung:
- RSI: Digunakan untuk mengukur kondisi overbought dan oversold pasar.
- SMA (50 periode) dan EMA (20 periode): Memberikan referensi arah tren harga.
- Analisis Volume: Mengevaluasi tren volume melalui rata-rata volume 20 periode.
-
Pembentukan Sinyal Trading:
- Ketika candle merah yang memenuhi syarat menyentuh pivot point, level support, level resistensi, atau VWAP/MVWAP, sinyal beli (CE) dihasilkan.
- Ketika candle hijau yang memenuhi syarat menyentuh pivot point, level support, level resistensi, atau VWAP/MVWAP, sinyal jual (PE) dihasilkan.
Ide inti strategi adalah menangkap potensi pembalikan harga di dekat level support dan resistensi kunci, dengan menyaring melalui pola candle spesifik dan berbagai indikator teknikal untuk meningkatkan efektivitas sinyal. Candle yang menyentuh pivot point sering kali menunjukkan peningkatan kemungkinan keraguan atau pembalikan pasar pada level harga kunci ini.
Keunggulan Strategi
Dengan menganalisis kode strategi secara mendalam, kami dapat menyimpulkan keunggulan signifikan berikut:
-
Mekanisme Verifikasi Multidimensi: Menggabungkan berbagai indikator teknikal (pivot point, VWAP, moving average, RSI) untuk memverifikasi sinyal trading, mengurangi risiko sinyal palsu.
-
Adaptasi Dinamis terhadap Pasar: Sistem pivot point intraday diperbarui setiap hari, memungkinkan strategi beradaptasi dengan lingkungan pasar dan volatilitas yang berbeda.
-
Identifikasi Candle yang Presisi: Menyaring peluang trading potensial melalui kondisi pola candle yang ketat dan level Fibonacci, meningkatkan kualitas sinyal.
-
Pengaturan Tampilan yang Fleksibel: Strategi memiliki fungsi adaptif tampilan, hanya menampilkan pivot point pada kerangka waktu yang sesuai (grafik intraday di bawah 15 menit), mengurangi kekacauan grafik.
-
Keunggulan Pemikiran Terbalik: Strategi mencari peluang beli ketika candle merah menyentuh posisi kunci, dan mencari peluang jual ketika candle hijau menyentuh posisi kunci, memanfaatkan potensi kondisi overbought atau oversold jangka pendek pasar.
-
Sistem Hierarki Harga yang Lengkap: Mencakup banyak lapisan support dan resistensi (S1-S4 dan R1-R4), menyediakan referensi harga yang kaya, cocok untuk lingkungan pasar dengan amplitudo fluktuasi yang berbeda.
-
Integrasi Central Pivot Range (CPR): CPR menyediakan identifikasi zona konsolidasi potensial harian, yang memiliki nilai referensi penting dalam perdagangan intraday.
-
Bantuan Visual: Melalui tampilan marka dan bentuk yang kaya, secara intuitif mengidentifikasi pada grafik candle yang memenuhi syarat dan situasi menyentuh harga kunci, memudahkan trader untuk mengidentifikasi dengan cepat.
-
Konfirmasi Volume: Menggabungkan analisis volume, mengevaluasi partisipasi pasar melalui rata-rata volume, meningkatkan keandalan sinyal.
-
Cocok untuk Perdagangan Intraday: Strategi dirancang khusus untuk kerangka waktu pendek (terutama grafik 3 menit), cocok untuk trader intraday yang memanfaatkan volatilitas pasar untuk melakukan trading frekuensi tinggi.
Keunggulan di atas menjadikan strategi ini sebagai sistem trading intraday yang komprehensif dan adaptif, sangat cocok untuk investor yang memiliki pemahaman dasar tentang analisis teknikal dan ingin bertrading berdasarkan perilaku harga dan level harga kunci.
Risiko Strategi
Meskipun strategi ini memiliki beberapa keunggulan, terdapat juga beberapa potensi risiko yang perlu diwaspadai oleh trader:
-
Risiko Sinyal Berlebihan: Karena strategi melibatkan banyak pivot point (PP, R1-R4, S1-S4) dan indikator lainnya, dapat menghasilkan terlalu banyak sinyal di pasar yang volatil, menyebabkan frekuensi trading tinggi dan peningkatan biaya komisi.
- Solusi: Dapat mempertimbangkan untuk menambahkan filter tambahan, seperti batasan sesi trading atau kondisi konfirmasi tren.
-
Jebakan Trading Terbalik: Strategi didasarkan pada logika terbalik (candle merah menyentuh posisi kunci untuk beli, candle hijau menyentuh posisi kunci untuk jual), yang dapat menyebabkan kerugian beruntun di pasar dengan tren kuat.
- Solusi: Evaluasi tren pasar secara keseluruhan sebelum menggunakan strategi, dapat menambahkan filter tren untuk menghindari trading melawan tren di pasar yang kuat.
-
Sensitivitas Parameter: Efektivitas strategi sangat bergantung pada parameter identifikasi candle (misalnya tinggi candle harus lebih dari 17 poin) dan pengaturan periode moving average, yang mungkin memerlukan parameter berbeda di lingkungan pasar yang berbeda.
- Solusi: Lakukan backtest untuk berbagai instrumen dan kondisi pasar, optimalkan pengaturan parameter.
-
Kurangnya Mekanisme Stop Loss: Kode tidak secara eksplisit menetapkan strategi stop loss, yang dapat menyebabkan kerugian besar pada satu perdagangan.
- Solusi: Terapkan strategi stop loss yang jelas, seperti stop loss dinamis berdasarkan ATR atau stop loss dengan jumlah poin tetap.
-
Keterbatasan Strategi Intraday: Sebagai strategi intraday yang berfokus pada grafik 3 menit, tidak cocok untuk kepemilikan jangka menengah atau panjang, sehingga melewatkan potensi peluang tren jangka panjang.
- Solusi: Anggap strategi ini sebagai bagian dari sistem trading, gunakan bersama strategi jangka menengah/panjang.
-
Keterbatasan Pivot Point: Di pasar yang bergerak sideways, harga dapat sering menyentuh beberapa pivot point, menghasilkan sinyal yang membingungkan.
- Solusi: Di pasar konsolidasi, pertimbangkan untuk menonaktifkan sementara strategi atau menambah kondisi konfirmasi sinyal.
-
Kurangnya Penyesuaian Bobot Volume: Meskipun menggunakan VWAP, strategi tidak menyesuaikan bobot sinyal secara dinamis berdasarkan besarnya volume.
- Solusi: Dapat menambahkan kondisi ambang volume, memastikan trading hanya terjadi dengan partisipasi pasar yang memadai.
-
Ketergantungan Waktu: Pivot point harian didasarkan pada data hari sebelumnya, dan pada awal sesi perdagangan baru mungkin menunjukkan kinerja yang tidak stabil karena kekurangan data yang cukup pada hari tersebut.
- Solusi: Pertimbangkan untuk mengaktifkan strategi 30-60 menit setelah pembukaan pasar untuk mendapatkan informasi pasar yang cukup.
-
Tantangan Implementasi Otomatis: Strategi melibatkan penilaian berbagai kondisi, yang dalam eksekusi otomatis aktual mungkin menghadapi penundaan atau masalah eksekusi yang tidak tepat waktu.
- Solusi: Optimalkan sistem eksekusi untuk memastikan latensi rendah, atau pertimbangkan cara semi-otomatis yang dikombinasikan dengan konfirmasi manual.
-
Risiko Bias Backtest: Logika identifikasi candle hijau/merah dalam kode mungkin menunjukkan kinerja yang tidak konsisten antara lingkungan backtest dan real-time.
- Solusi: Lakukan pengujian simulasi real-time yang ketat untuk memastikan strategi tetap efektif di lingkungan trading aktual.
Mengenali dan mengelola risiko-risiko ini sangat penting untuk keberhasilan penerapan strategi. Trader harus melakukan penyesuaian yang sesuai berdasarkan toleransi risiko dan kebiasaan trading mereka sendiri.
Arah Optimasi Strategi
Berdasarkan analisis mendalam terhadap kode, berikut adalah arah optimasi utama untuk strategi ini:
-
Parameter Identifikasi Candle Dinamis:
- Strategi saat ini menggunakan nilai tetap (misalnya tinggi candle setidaknya 17 poin) untuk mengidentifikasi candle yang valid. Dapat diubah menjadi parameter dinamis berdasarkan ATR (Average True Range) agar strategi lebih baik beradaptasi dengan lingkungan volatilitas yang berbeda.
- Alasan Optimasi: Parameter tetap memberikan hasil yang sangat bervariasi di lingkungan volatilitas yang berbeda; parameter dinamis dapat meningkatkan adaptasi strategi.
-
Sistem Filter Tren:
- Tambahkan penilaian tren dari kerangka waktu yang lebih tinggi (misalnya 15 menit atau 30 menit), hanya melakukan trading searah dengan tren utama atau menyesuaikan bobot sinyal.
- Alasan Optimasi: Menghindari trading melawan tren secara sering di pasar yang kuat, meningkatkan rasio kemenangan dan risk-reward.
-
Mekanisme Penilaian Kualitas Sinyal:
- Bangun sistem penilaian komprehensif untuk setiap sinyal trading, mempertimbangkan berbagai faktor seperti: kekuatan candle, pentingnya pivot point yang disentuh, nilai RSI, anomali volume, dll.
- Alasan Optimasi: Tidak semua sinyal memiliki kualitas yang sama; sistem penilaian dapat menyaring sinyal berkualitas rendah, meningkatkan efisiensi trading.
-
Integrasi Manajemen Modal:
- Sesuaikan ukuran posisi secara dinamis berdasarkan kekuatan sinyal dan kondisi pasar. Tingkatkan posisi pada peluang probabilitas tinggi, kurangi eksposur risiko pada situasi probabilitas rendah.
- Alasan Optimasi: Manajemen modal yang efektif sangat penting untuk profitabilitas jangka panjang dan dapat secara signifikan meningkatkan kinerja strategi.
-
Konfirmasi Multi-Kerangka Waktu:
- Periksa konsistensi kondisi di beberapa kerangka waktu sebelum menghasilkan sinyal, misalnya trading hanya ketika sinyal pada grafik 3 menit dan 15 menit konsisten.
- Alasan Optimasi: Konfirmasi multi-kerangka waktu dapat mengurangi probabilitas sinyal salah, meningkatkan presisi trading.
-
Mekanisme Stop Loss dan Take Profit:
- Terapkan sistem stop loss cerdas, seperti stop loss dinamis berdasarkan volatilitas atau stop loss pada level struktur kunci, serta tetapkan target take profit otomatis.
- Alasan Optimasi: Manajemen risiko yang baik sangat penting untuk menghindari drawdown besar dan melindungi keuntungan.
-
Filter Waktu Trading:
- Identifikasi sesi trading efisien dan tidak efisien, hindari periode dengan volatilitas rendah atau kebingungan pasar (seperti waktu makan siang atau sekitar pembukaan dan penutupan pasar).
- Alasan Optimasi: Karakteristik perilaku pasar berbeda pada sesi yang berbeda; trading selektif dapat meningkatkan efisiensi keseluruhan.
-
Parameter Indikator Adaptif:
- Ubah parameter indikator teknikal tetap (seperti RSI 14 periode, EMA 20 periode) menjadi parameter yang menyesuaikan diri secara otomatis berdasarkan kondisi pasar.
- Alasan Optimasi: Ketika kondisi pasar berubah, parameter indikator optimal juga harus disesuaikan untuk meningkatkan sensitivitas indikator.
-
Klasifikasi Lingkungan Pasar:
- Tambahkan algoritma untuk secara otomatis mengidentifikasi lingkungan pasar saat ini (tren, sideways, volatilitas tinggi, dll.), dan terapkan pengaturan parameter yang berbeda untuk lingkungan yang berbeda.
- Alasan Optimasi: Satu set parameter tunggal sulit untuk berkinerja terbaik di semua lingkungan pasar; penyesuaian adaptif terhadap lingkungan dapat secara signifikan meningkatkan stabilitas strategi.
-
Peningkatan Pembelajaran Mesin:
- Pertimbangkan untuk mengintegrasikan model pembelajaran mesin untuk memprediksi probabilitas keberhasilan sinyal, menyaring dan memprioritaskan sinyal trading berdasarkan pengenalan pola historis.
- Alasan optimalisasi: Pembelajaran mesin dapat menemukan pola kompleks yang sulit dikenali secara manual, meningkatkan tingkat kecerdasan strategi.
Dengan menerapkan arah optimalisasi di atas, strategi ini dapat secara signifikan meningkatkan adaptabilitas, akurasi, dan profitabilitas jangka panjang sambil mempertahankan keunggulan aslinya, serta lebih baik dalam menghadapi tantangan berbagai kondisi pasar.
Ringkasan
Sistem Trading Multi-Dimensional Pivot Point dengan Indikator Fibonacci Dinamis adalah sistem strategi trading intraday yang komprehensif dan terstruktur dengan baik. Sistem ini secara cerdik menggabungkan alat analisis teknikal tradisional (pivot point, Fibonacci retracement, moving average) dengan indikator dinamis modern (VWAP, CPR), melalui penyaringan kondisi lilin yang ketat dan konfirmasi multi-indikator, memberikan kerangka kerja trading intraday yang potensial bagi para trader.
Keunggulan inti dari strategi ini terletak pada cakupan menyeluruh terhadap level harga kunci dan penangkapan sensitif terhadap titik pembalikan potensial. Dengan menetapkan kondisi identifikasi lilin yang ketat, strategi dapat menyaring banyak noise pasar yang tidak berarti, fokus pada peluang trading dengan probabilitas tinggi. Pada saat yang sama, penggunaan indikator volume dan momentum semakin meningkatkan keandalan sinyal.
Namun, strategi ini juga memiliki beberapa keterbatasan, seperti kemungkinan sinyal yang terlalu banyak, risiko trading kontra, dan tantangan optimasi parameter. Menanggapi masalah ini, kami mengusulkan beberapa arah optimalisasi, termasuk penyesuaian parameter dinamis, konfirmasi multi-timeframe, manajemen modal cerdas, dan adaptasi lingkungan pasar. Optimalisasi ini dapat membantu trader menyesuaikan strategi sesuai kebutuhan dan karakteristik pasar mereka, meningkatkan hasil trading secara keseluruhan.
Perlu dicatat bahwa tidak ada strategi trading yang merupakan alat "menyentuh emas menjadi emas". Keberhasilan trading selain bergantung pada strategi itu sendiri, juga membutuhkan kesabaran, disiplin, dan pembelajaran berkelanjutan dari trader. Untuk strategi ini, disarankan agar trader terlebih dahulu menguji secara menyeluruh dalam lingkungan simulasi, memahami karakteristik kinerjanya dalam berbagai kondisi pasar, secara bertahap menyesuaikan parameter agar sesuai dengan instrumen trading dan gaya pribadi tertentu, dan akhirnya membentuk sistem trading yang dipersonalisasi dan menguntungkan secara berkelanjutan.
Melalui praktik, umpan balik, dan optimalisasi yang terus-menerus, Sistem Trading Multi-Dimensional Pivot Point dengan Indikator Fibonacci Dinamis dapat menjadi senjata yang ampuh dalam kotak peralatan trader intraday, menyediakan kerangka kerja analisis teknikal yang andal untuk memanfaatkan volatilitas pasar intraday. ||
Gambaran Umum
Sistem Trading Multi-Dimensional Pivot Point dengan Indikator Fibonacci Dinamis adalah strategi trading berbasis analisis teknikal yang menggunakan pivot point harian, Central Pivot Range (CPR), level Fibonacci retracement, Volume Weighted Average Price (VWAP), dan moving average untuk mengidentifikasi peluang beli dan jual potensial. Strategi ini sangat cocok untuk trader intraday, terutama mereka yang fokus pada timeframe grafik 3 menit. Inti dari strategi ini adalah menentukan apakah lilin yang memenuhi kondisi tertentu menyentuh level support dan resistance kunci, sehingga memicu sinyal trading.
Strategi ini menggunakan sistem pivot point yang dihitung dari harga tertinggi, terendah, dan penutupan harian, dikombinasikan dengan Volume Weighted Average Price (VWAP) dan Moving VWAP (MVWAP) sebagai referensi support dan resistance dinamis. Ini juga menggabungkan indikator teknikal seperti Relative Strength Index (RSI), Simple Moving Average (SMA), dan Exponential Moving Average (EMA) untuk menciptakan sistem pengambilan keputusan trading yang komprehensif.
Strategi ini pertama-tama mengidentifikasi lilin hijau (bullish) dan merah (bearish) yang memenuhi syarat, kemudian menentukan apakah lilin-lilin ini menyentuh level harga kunci seperti pivot point, level support, level resistance, atau VWAP. Ketika lilin merah menyentuh level harga kunci, itu memicu sinyal beli (CE); ketika lilin hijau menyentuh level harga kunci, itu memicu sinyal jual (PE). Pendekatan kontrarian ini mencerminkan konsep inti mencari titik pembalikan potensial pada level harga kunci.
Prinsip Strategi
Prinsip-prinsip strategi ini dibangun di atas perilaku pasar di mana harga berfluktuasi di sekitar level support dan resistance kunci, dikombinasikan dengan pola lilin, volume, dan indikator momentum untuk pengambilan keputusan trading. Prinsip-prinsip spesifik dianalisis sebagai berikut:
-
Mekanisme Identifikasi Lilin:
- Lilin Hijau (Bullish): Penutupan lebih tinggi dari pembukaan, tinggi badan lilin setidaknya 17 poin, pembukaan lebih rendah dari terendah ditambah 0,382 kali rentang lilin, penutupan lebih tinggi dari terendah ditambah 0,682 kali rentang lilin.
- Lilin Merah (Bearish): Penutupan lebih rendah dari pembukaan, tinggi badan lilin setidaknya 17 poin.
-
Sistem Perhitungan Pivot Point:
- Pivot Point Harian (PP): (Tertinggi Harian + Terendah Harian + Penutupan Harian) / 3
- Level Resistance: R1, R2, R3, R4
- Level Support: S1, S2, S3, S4
- Central Pivot Range (CPR): Terdiri dari CPR bawah dan CPR atas, menyediakan wilayah harga di mana pasar mungkin berkonsolidasi
-
Referensi Harga Dinamis:
- VWAP (Volume Weighted Average Price): Mencerminkan tingkat harga rata-rata dengan mempertimbangkan faktor volume
- MVWAP (Moving Volume Weighted Average Price): Rata-rata bergerak dari VWAP, menyediakan referensi harga yang lebih halus
-
Sistem Indikator Pembantu:
- RSI: Digunakan untuk mengukur kondisi overbought/oversold pasar
- SMA (50 periode) dan EMA (20 periode): Menyediakan referensi arah tren harga
- Analisis Volume: Menilai tren volume melalui rata-rata bergerak volume 20 periode
-
Pembuatan Sinyal Trading:
- Ketika lilin merah yang memenuhi syarat menyentuh titik pivot, level support, level resistensi, atau VWAP/MVWAP, sinyal beli (CE) dihasilkan
- Ketika lilin hijau yang memenuhi syarat menyentuh titik pivot, level support, level resistensi, atau VWAP/MVWAP, sinyal jual (PE) dihasilkan
Ide inti dari strategi ini adalah menangkap potensi pembalikan di dekat level support dan resistensi kunci, yang difilter melalui pola lilin spesifik dan beberapa indikator teknis untuk meningkatkan validitas sinyal. Lilin yang menyentuh titik pivot sering kali mewakili peningkatan kemungkinan keraguan atau pembalikan pasar di level harga kunci ini.
Keunggulan Strategi
Analisis mendalam terhadap kode strategi mengungkapkan keunggulan signifikan berikut:
-
Mekanisme Verifikasi Multidimensi: Menggabungkan beberapa indikator teknis (titik pivot, VWAP, moving average, RSI) untuk memvalidasi sinyal trading, mengurangi risiko sinyal palsu.
-
Adaptasi Pasar Dinamis: Sistem titik pivot harian diperbarui setiap hari, memungkinkan strategi beradaptasi dengan lingkungan pasar dan volatilitas yang berbeda.
-
Identifikasi Lilin yang Tepat: Menyaring potensi peluang trading melalui kondisi pola lilin yang ketat dan level Fibonacci, meningkatkan kualitas sinyal.
-
Pengaturan Tampilan Fleksibel: Strategi ini memiliki fungsi adaptasi tampilan, hanya menampilkan titik pivot pada timeframe yang sesuai (grafik intraday di bawah 15 menit), mengurangi kekacauan grafik.
-
Keunggulan Pemikiran Kontrarian: Strategi ini mencari peluang beli ketika lilin merah menyentuh level kunci dan peluang jual ketika lilin hijau menyentuh level kunci, memanfaatkan potensi kondisi pasar yang jenuh beli/jenuh jual jangka pendek.
-
Hierarki Level Harga Lengkap: Mencakup beberapa lapisan support dan resistensi (S1-S4 dan R1-R4), memberikan harga referensi yang kaya, cocok untuk lingkungan pasar dengan rentang volatilitas yang berbeda.
-
Rentang Pivot Sentral Terintegrasi (CPR): CPR menyediakan identifikasi area konsolidasi potensial untuk hari tersebut, yang memiliki nilai referensi penting dalam trading intraday.
-
Bantuan Visual: Melalui penanda dan bentuk yang kaya, lilin yang memenuhi syarat dan contoh menyentuh level harga kunci ditandai secara intuitif pada grafik, memungkinkan trader mengidentifikasinya dengan cepat.
-
Konfirmasi Volume: Menggabungkan analisis volume, menilai partisipasi pasar melalui moving average volume, meningkatkan keandalan sinyal.
-
Cocok untuk Trading Intraday: Strategi ini dirancang khusus untuk timeframe pendek (terutama grafik 3 menit), cocok untuk trader intraday yang ingin memanfaatkan fluktuasi pasar melalui trading yang sering.
Keunggulan-keunggulan ini menjadikan strategi ini sistem trading intraday yang kuat dan adaptif, sangat cocok untuk investor yang memiliki pemahaman baik tentang analisis teknis dan ingin trading berdasarkan aksi harga dan level harga kunci.
Risiko Strategi
Meskipun memiliki banyak keunggulan, strategi ini juga memiliki beberapa potensi risiko yang harus diperhatikan dengan hati-hati oleh trader:
-
Risiko Sinyal Berlebihan: Karena strategi melibatkan beberapa titik pivot (PP, R1-R4, S1-S4) dan indikator lainnya, strategi ini dapat menghasilkan terlalu banyak sinyal di pasar yang volatil, menyebabkan trading yang sering dan peningkatan biaya.
- Solusi: Pertimbangkan untuk menambahkan kondisi penyaringan tambahan, seperti batasan sesi trading atau kondisi konfirmasi tren.
-
Jebakan Trading Kontrarian: Strategi ini didasarkan pada logika kontrarian (beli ketika lilin merah menyentuh level kunci, jual ketika lilin hijau menyentuh level kunci), yang dapat menyebabkan kerugian berturut-turut di pasar yang sedang dalam tren kuat.
- Solusi: Nilai tren pasar secara keseluruhan sebelum menggunakan strategi, dan tambahkan filter tren untuk menghindari trading melawan tren di pasar yang sedang tren kuat.
-
Sensitivitas Parameter: Efektivitas strategi sangat bergantung pada parameter identifikasi lilin (misalnya, tinggi lilin harus melebihi 17 poin) dan pengaturan periode rata-rata bergerak, yang mungkin memerlukan parameter berbeda di lingkungan pasar yang berbeda.
- Solusi: Uji kembangkan instrumen dan kondisi pasar yang berbeda untuk mengoptimalkan pengaturan parameter.
-
Kurangnya Mekanisme Stop-Loss: Tidak ada strategi stop-loss yang eksplisit ditetapkan dalam kode, yang dapat menyebabkan kerugian perdagangan tunggal yang berlebihan.
- Solusi: Terapkan strategi stop-loss yang jelas, seperti stop-loss dinamis berbasis ATR atau stop-loss titik tetap.
-
Keterbatasan Strategi Intraday: Sebagai strategi yang berfokus pada grafik 3 menit, tidak cocok untuk kepemilikan jangka menengah hingga panjang, yang berpotensi melewatkan peluang dalam tren jangka panjang.
- Solusi: Lihat strategi ini sebagai bagian dari sistem perdagangan, digunakan bersama dengan strategi jangka menengah dan panjang.
-
Keterbatasan Titik Pivot: Di pasar yang bergerak dalam kisaran, harga mungkin sering menyentuh beberapa titik pivot, menghasilkan sinyal yang membingungkan.
- Solusi: Pertimbangkan untuk menonaktifkan strategi sementara atau menambahkan kondisi konfirmasi sinyal di pasar yang mengalami konsolidasi.
-
Kurangnya Penyesuaian Bobot Volume: Meskipun VWAP digunakan, strategi tidak menyesuaikan bobot sinyal secara dinamis berdasarkan besarnya volume.
- Solusi: Tambahkan kondisi ambang batas volume untuk memastikan perdagangan terjadi dengan partisipasi pasar yang memadai.
-
Ketergantungan Waktu: Titik pivot harian didasarkan pada data hari sebelumnya, dan mungkin berkinerja tidak stabil di awal hari perdagangan baru karena data hari ini yang tidak mencukupi.
- Solusi: Pertimbangkan untuk mengaktifkan strategi 30-60 menit setelah hari perdagangan dimulai untuk mengumpulkan informasi pasar yang cukup.
-
Tantangan Implementasi Otomatisasi: Strategi melibatkan banyak kondisi penilaian, dan mungkin menghadapi keterlambatan atau eksekusi yang tidak tepat waktu selama eksekusi otomatis yang sebenarnya.
- Solusi: Optimalkan sistem eksekusi untuk memastikan latensi rendah, atau pertimbangkan metode semi-otomatis yang dikombinasikan dengan konfirmasi manual.
-
Risiko Bias Backtest: Logika identifikasi lilin hijau/merah dalam kode mungkin berkinerja tidak konsisten antara lingkungan backtest dan perdagangan langsung.
- Solusi: Lakukan pengujian simulasi langsung yang ketat untuk memastikan strategi tetap efektif di lingkungan perdagangan nyata.
Mengenali dan mengelola risiko-risiko ini sangat penting untuk berhasil menerapkan strategi ini. Trader harus melakukan penyesuaian yang tepat berdasarkan toleransi risiko dan kebiasaan perdagangan mereka.
Arahan Optimasi Strategi
Berdasarkan analisis mendalam terhadap kode, berikut adalah arahan kunci untuk mengoptimalkan strategi ini:
-
Parameter Identifikasi Lilin Dinamis:
- Strategi saat ini menggunakan nilai tetap (seperti tinggi lilin setidaknya 17 poin) untuk mengidentifikasi lilin yang efektif. Ini dapat diubah menjadi parameter dinamis berdasarkan ATR (Average True Range) untuk lebih beradaptasi dengan lingkungan volatilitas yang berbeda.
- Alasan optimasi: Parameter tetap berkinerja berbeda di berbagai lingkungan volatilitas; parameter dinamis dapat meningkatkan adaptabilitas strategi.
-
Sistem Penyaringan Tren:
- Tambahkan penentuan tren dari jangka waktu yang lebih tinggi (seperti 15 menit atau 30 menit) untuk hanya mengeksekusi perdagangan searah dengan tren utama atau menyesuaikan bobot sinyal.
- Alasan optimasi: Hindari perdagangan melawan tren yang sering terjadi di tren kuat, meningkatkan rasio kemenangan dan rasio risiko-imbalan.
-
Mekanisme Skor Kualitas Sinyal:
- Bangun sistem penilaian komprehensif untuk setiap sinyal perdagangan, dengan mempertimbangkan berbagai faktor seperti kekuatan lilin, pentingnya titik pivot yang disentuh, nilai RSI, anomali volume, dll.
- Alasan optimasi: Tidak semua sinyal memiliki kualitas yang sama; sistem penilaian dapat menyaring sinyal berkualitas rendah dan meningkatkan efisiensi perdagangan.
-
Integrasi Manajemen Modal:
- Menyesuaikan ukuran posisi secara dinamis berdasarkan kekuatan sinyal dan kondisi pasar, menambah posisi pada peluang probabilitas tinggi dan mengurangi eksposur risiko pada situasi probabilitas rendah.
- Alasan optimasi: Manajemen modal yang efektif sangat penting untuk profitabilitas jangka panjang dan dapat meningkatkan kinerja strategi secara signifikan.
-
Konfirmasi Multi-Timeframe:
- Memeriksa konsistensi kondisi di beberapa timeframe sebelum menghasilkan sinyal, misalnya, hanya bertransaksi ketika sinyal pada grafik 3 menit dan 15 menit selaras.
- Alasan optimasi: Konfirmasi multi-timeframe dapat mengurangi probabilitas sinyal palsu dan meningkatkan presisi perdagangan.
-
Mekanisme Stop-Loss dan Take-Profit:
- Menerapkan sistem stop-loss cerdas, seperti stop-loss dinamis berbasis volatilitas atau stop-loss pada posisi struktural kunci, sambil menetapkan target take-profit otomatis.
- Alasan optimasi: Manajemen risiko yang baik sangat penting untuk menghindari penarikan besar dan melindungi keuntungan.
-
Filter Waktu Perdagangan:
- Mengidentifikasi sesi perdagangan yang efisien dan tidak efisien, menghindari periode volatilitas pasar rendah atau periode kacau (seperti jam makan siang atau sebelum dan sesudah pembukaan dan penutupan pasar).
- Alasan optimasi: Karakteristik perilaku pasar berbeda di berbagai sesi; perdagangan selektif dapat meningkatkan efisiensi keseluruhan.
-
Parameter Indikator Adaptif:
- Mengubah parameter indikator teknis tetap (seperti RSI 14 periode, EMA 20 periode) menjadi parameter yang menyesuaikan secara otomatis berdasarkan kondisi pasar.
- Alasan optimasi: Ketika kondisi pasar berubah, parameter indikator optimal juga harus menyesuaikan, meningkatkan sensitivitas indikator.
-
Klasifikasi Lingkungan Pasar:
- Menambahkan algoritma untuk secara otomatis mengidentifikasi lingkungan pasar saat ini (tren, konsolidasi, volatilitas tinggi, dll.) dan menerapkan pengaturan parameter yang berbeda untuk lingkungan yang berbeda.
- Alasan optimasi: Pengaturan parameter tunggal sulit bekerja secara optimal di semua lingkungan pasar; penyesuaian adaptif lingkungan dapat secara signifikan meningkatkan stabilitas strategi.
-
Peningkatan Pembelajaran Mesin:
- Pertimbangkan untuk mengintegrasikan model pembelajaran mesin untuk memprediksi probabilitas keberhasilan sinyal, memfilter dan memprioritaskan sinyal perdagangan berdasarkan pengenalan pola historis.
- Alasan optimasi: Pembelajaran mesin dapat menemukan pola kompleks yang sulit diidentifikasi manusia, meningkatkan tingkat kecerdasan strategi.
Dengan menerapkan arah optimasi ini, strategi dapat secara signifikan meningkatkan adaptabilitas, akurasi, dan profitabilitas jangka panjang sambil mempertahankan keunggulan aslinya, lebih baik mengatasi tantangan di berbagai kondisi pasar.
Ringkasan
Sistem Perdagangan Titik Pivot Multi-Dimensi dengan Indikator Fibonacci Dinamis adalah sistem strategi perdagangan intraday yang komprehensif dan terstruktur dengan baik. Sistem ini secara cerdik menggabungkan alat analisis teknis tradisional (titik pivot, retracement Fibonacci, rata-rata bergerak) dengan indikator dinamis modern (VWAP, CPR). Melalui penyaringan kondisi kandil yang ketat dan konfirmasi beberapa indikator, sistem ini menyediakan kerangka kerja perdagangan intraday yang menjanjikan bagi para pedagang.
Keunggulan inti dari strategi ini terletak pada cakupan komprehensifnya terhadap level harga kunci dan penangkapan sensitif terhadap titik pembalikan potensial. Dengan menetapkan kondisi identifikasi kandil yang ketat, strategi dapat menyaring kebisingan pasar yang tidak berarti dan fokus pada peluang perdagangan dengan probabilitas tinggi. Pada saat yang sama, penggunaan indikator volume dan momentum semakin meningkatkan keandalan sinyal.
Namun, strategi ini juga memiliki beberapa keterbatasan, seperti potensi sinyal yang berlebihan, risiko trading kontrarian, dan tantangan optimasi parameter. Untuk mengatasi masalah tersebut, kami telah mengusulkan beberapa arah optimasi, termasuk penyesuaian parameter dinamis, konfirmasi kerangka waktu ganda, manajemen modal cerdas, dan adaptasi lingkungan pasar. Optimasi-optimasi ini dapat membantu trader menyesuaikan strategi sesuai kebutuhan mereka sendiri dan karakteristik pasar, sehingga meningkatkan efektivitas trading secara keseluruhan.
Perlu dicatat bahwa tidak ada strategi trading yang merupakan "peluru ajaib." Keberhasilan trading tidak hanya bergantung pada strategi itu sendiri, tetapi juga pada kesabaran, disiplin, dan pembelajaran berkelanjutan dari trader. Untuk strategi ini, disarankan agar trader terlebih dahulu mengujinya secara menyeluruh di lingkungan simulasi, memahami karakteristik kinerjanya dalam berbagai kondisi pasar, secara bertahap menyesuaikan parameter agar sesuai dengan instrumen trading tertentu dan gaya pribadi, dan pada akhirnya membentuk sistem trading yang dipersonalisasi dan menguntungkan secara berkelanjutan.
Melalui praktik, umpan balik, dan optimasi yang berkelanjutan, Sistem Trading Titik Pivot Multi-Dimensi dengan Indikator Fibonacci Dinamis dapat menjadi senjata ampuh dalam kotak peralatan trader intraday, menyediakan kerangka analisis teknis yang andal untuk menangkap peluang pasar jangka pendek.
Integrasi strategi antara titik pivot tradisional dengan alat teknis modern menciptakan pendekatan yang seimbang yang menghormati struktur pasar sambil tetap responsif terhadap pergerakan harga intraday. Dengan berfokus pada interaksi harga kunci di level-level kritis, trader dapat mengembangkan pemahaman yang lebih dalam tentang psikologi pasar dan berpotensi meningkatkan kinerja trading mereka.
Pada akhirnya, implementasi yang sukses akan memerlukan kustomisasi yang cermat, pengujian yang ketat, dan eksekusi yang disiplin. Ketika diterapkan dengan tepat sebagai bagian dari rencana trading yang komprehensif yang mencakup prinsip-prinsip manajemen risiko yang baik, strategi ini menawarkan metode sistematis untuk menavigasi kompleksitas pasar intraday dengan kepercayaan diri dan presisi yang lebih besar.
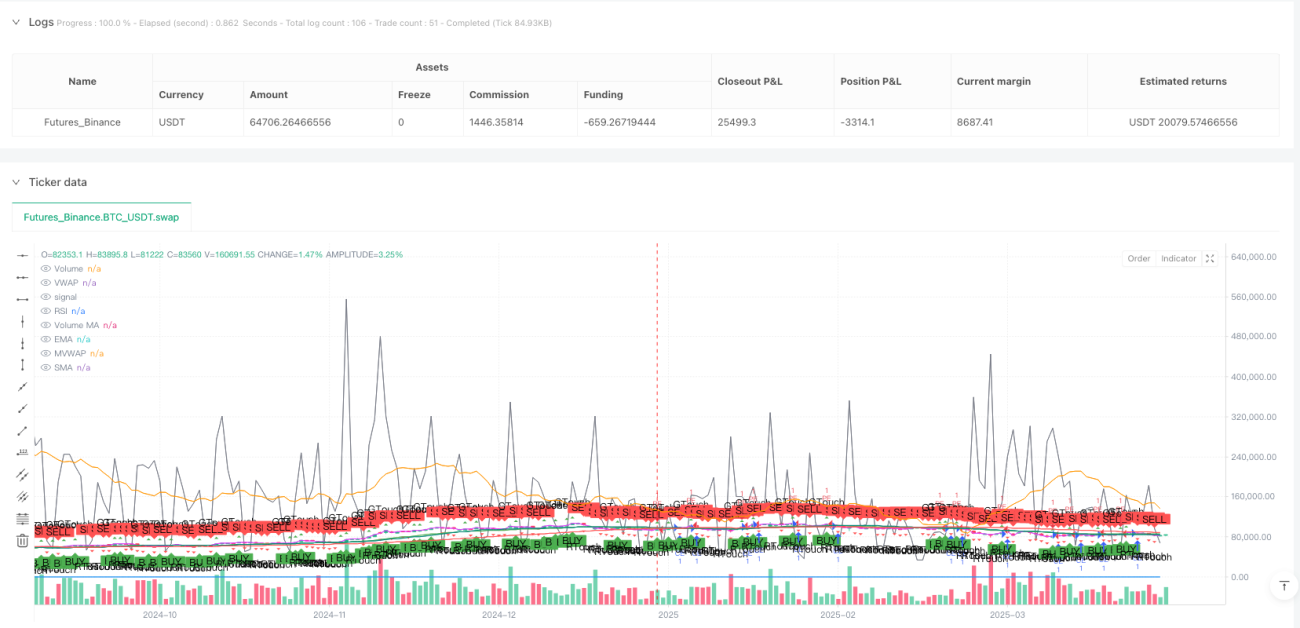
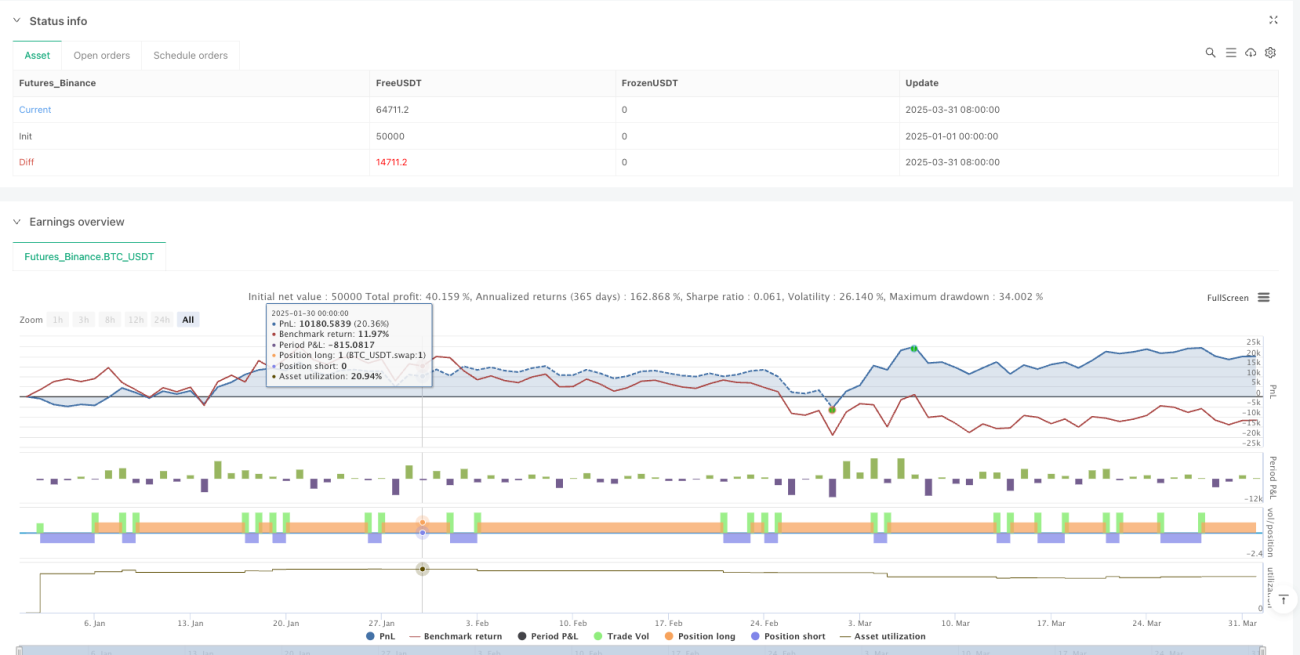
/*backtest
start: 2025-01-01 00:00:00
end: 2025-04-01 00:00:00
period: 1d
basePeriod: 1d
exchanges: [{"eid":"Futures_Binance","currency":"BTC_USDT"}]
*/

//@version=5
strategy("Pivot Point CE/PE Strategy", overlay=true)

// Identify 3-minute candles (Assuming the script is applied to a 3-minute chart)- 1