Strategi Perdagangan Kuantitatif Penelusuran Tren dengan Multi Indikator Momentum

Ikhtisar
Strategi perdagangan kuantitatif pelacakan tren dengan indeks momentum majemuk adalah metode perdagangan kuantitatif gabungan yang menggabungkan Rata-rata Bergerak Eksponensial (EMA), Indeks Kekuatan Relatif (RSI), dan Konvergensi Divergensi Rata-rata Bergerak (MACD). Strategi ini mengintegrasikan beberapa indikator teknis untuk meningkatkan akurasi dan keandalan sinyal perdagangan, terutama cocok untuk perdagangan jangka pendek dan menengah di pasar dengan volatilitas tinggi.
Prinsip Strategi
Prinsip inti strategi ini adalah verifikasi bersama beberapa indikator:
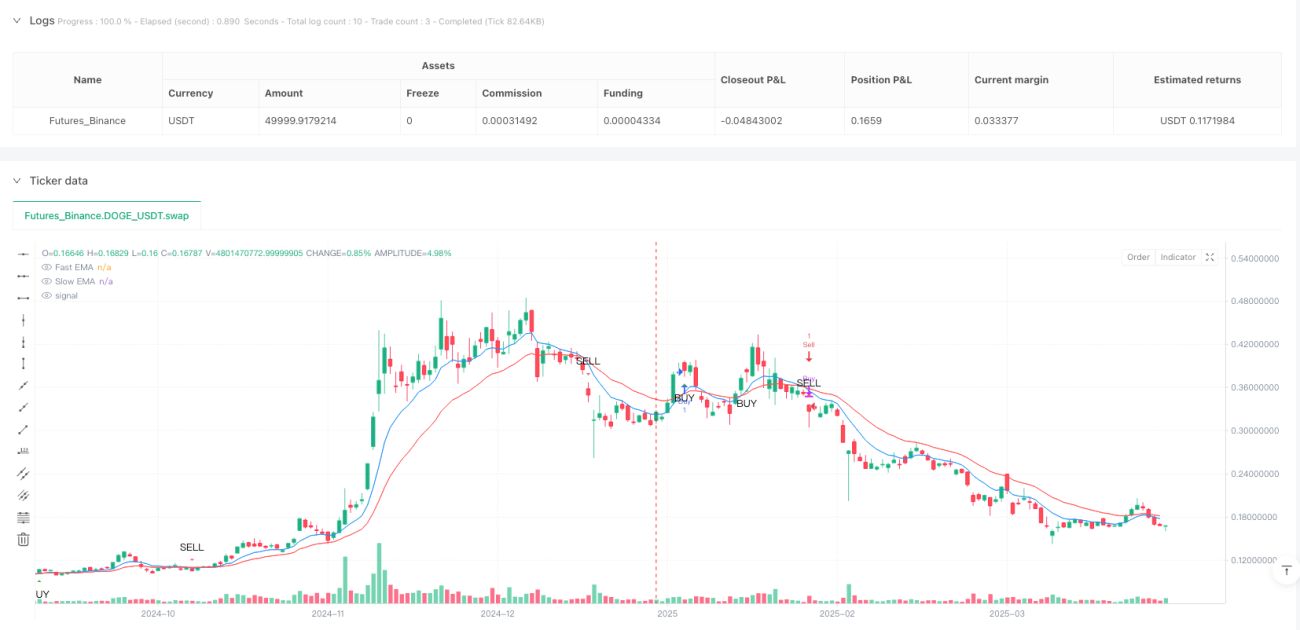
- Menggunakan EMA cepat (periode 9) dan EMA lambat (periode 21) untuk menentukan arah tren dan perubahan momentum.
- Melalui RSI (periode 14) untuk mengonfirmasi momentum pasar dan kondisi overbought/oversold.
- Memanfaatkan indikator MACD untuk memvalidasi momentum dan arah tren.
Aturan pembentukan sinyal perdagangan spesifik:
- Ketika EMA cepat melintasi di atas EMA lambat, dan RSI > 50, garis MACD di atas garis sinyal, menghasilkan sinyal beli.
- Ketika EMA cepat melintasi di bawah EMA lambat, dan RSI < 50, garis MACD di bawah garis sinyal, menghasilkan sinyal jual.
Keunggulan Strategi
- Verifikasi bersama beberapa indikator secara signifikan mengurangi risiko sinyal palsu.
- Menangkap perubahan tren pasar secara dinamis, adaptif.
- Parameter dapat disesuaikan, fleksibel dalam menghadapi kondisi pasar yang berbeda.
- Logika pembentukan sinyal jelas, mudah dipahami dan diterapkan.
- Cocok untuk perdagangan jangka pendek dan menengah di pasar dengan volatilitas tinggi.
Risiko Strategi
- Di pasar sideways, dapat menghasilkan perdagangan tidak efektif yang sering.
- Pemilihan parameter indikator yang tidak tepat dapat menyebabkan penurunan efisiensi perdagangan.
- Tidak mempertimbangkan dampak biaya transaksi dan slippage.
- Stabilitas strategi terbatas dalam lingkungan pasar tunggal.
Arah Optimasi Strategi
- Memperkenalkan kondisi penyaringan tambahan, seperti konfirmasi volume.
- Menambahkan mekanisme stop-loss dan take-profit.
- Menyesuaikan parameter EMA, RSI, dan MACD secara dinamis.
- Mengembangkan algoritma adaptif parameter berbasis pembelajaran mesin.
- Memperkenalkan lebih banyak indikator penilaian lingkungan pasar.
Kesimpulan
Strategi perdagangan kuantitatif pelacakan tren dengan indeks momentum majemuk membangun sistem pembentukan sinyal perdagangan yang relatif kokoh dengan mengintegrasikan tiga indikator teknis kunci: EMA, RSI, dan MACD. Strategi ini mempertahankan fleksibilitas yang cukup sekaligus memiliki kemampuan kontrol risiko yang kuat, memberikan solusi perdagangan yang layak untuk diteliti lebih lanjut bagi para trader kuantitatif.
- 1