
Ikhtisar Strategi
Strategi Pelacakan Tren Dinamis Bollinger Bands dan ATR adalah sistem trading kuantitatif canggih yang menggabungkan sinyal breakout dari Bollinger Bands dengan penyesuaian dinamis dari Average True Range (ATR). Melalui mekanisme "Garis Pelacak" (Follow Line), strategi ini mengidentifikasi dan melacak tren pasar. Strategi ini secara khusus memperkenalkan mekanisme konfirmasi multi-kerangka waktu (HTF) yang mampu menyaring sinyal trading berdasarkan arah tren dari kerangka waktu yang lebih tinggi, sehingga secara signifikan meningkatkan stabilitas dan profitabilitas strategi. Sistem ini juga mencakup beberapa fitur lanjutan, seperti penyaringan sesi trading opsional, penyesuaian volatilitas ATR secara adaptif, dan mekanisme reaksi real-time terhadap perubahan tren HTF, membentuk solusi trading kuantitatif yang komprehensif dan fleksibel.
Prinsip Strategi
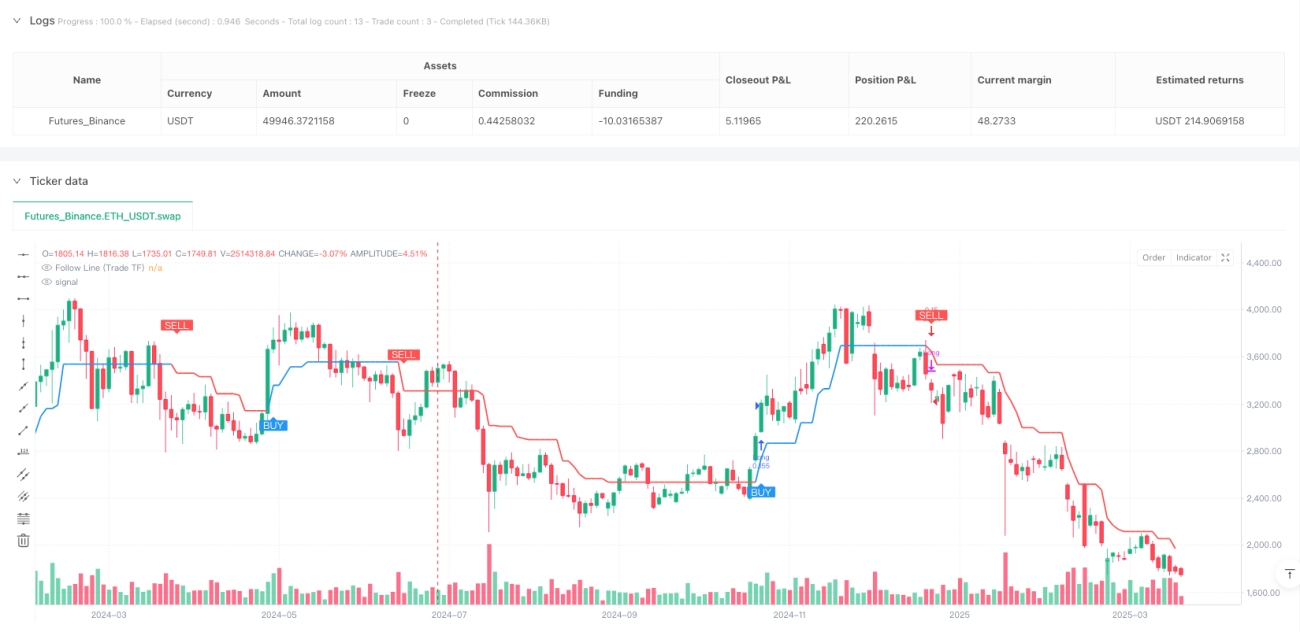
Inti dari strategi ini adalah mekanisme "Garis Pelacak", yang secara dinamis mengidentifikasi dan beradaptasi dengan tren pasar melalui langkah-langkah berikut:
-
Pembuatan Sinyal Bollinger Bands: Sistem pertama-tama menghitung Bollinger Bands standar. Ketika harga menembus pita atas, dihasilkan sinyal bullish (1); ketika menembus pita bawah, dihasilkan sinyal bearish (-1); ketika berada di dalam pita, sinyal netral (0).
-
Kalkulasi Garis Pelacak: Berdasarkan sinyal Bollinger Bands dan posisi harga saat ini, sistem menghitung nilai sementara Garis Pelacak. Dalam kondisi sinyal bullish, Garis Pelacak ditetapkan sebagai titik terendah candle saat ini dikurangi nilai ATR (jika filter ATR diaktifkan) atau langsung menggunakan titik terendah. Dalam kondisi sinyal bearish, Garis Pelacak ditetapkan sebagai titik tertinggi candle saat ini ditambah nilai ATR atau langsung menggunakan titik tertinggi.
-
Mekanisme Penguncian Garis Pelacak: Strategi menggunakan logika "ratchet" untuk mempertahankan Garis Pelacak – dalam tren naik, nilai Garis Pelacak baru diambil sebagai nilai yang lebih besar antara nilai sementara dan nilai sebelumnya; dalam tren turun, diambil sebagai nilai yang lebih kecil antara nilai sementara dan nilai sebelumnya. Ini memastikan bahwa Garis Pelacak hanya dapat bergerak searah dengan tren, membentuk level support/resistance dinamis.
-
Penentuan Tren: Dengan membandingkan nilai Garis Pelacak saat ini dengan nilai sebelumnya, sistem menentukan arah tren – naik menunjukkan tren bullish (1), turun menunjukkan tren bearish (-1), dan datar mempertahankan tren sebelumnya.
-
Analisis Multi-Kerangka Waktu: Strategi menggunakan logika serupa pada kerangka waktu yang lebih tinggi untuk menghitung Garis Pelacak dan status tren, yang dapat memilih kerangka waktu yang lebih tinggi yang sesuai secara otomatis atau manual (misalnya, 1 menit secara otomatis berpasangan dengan HTF 15 menit).
-
Kondisi Masuk: Ketika tren pada kerangka waktu trading berubah dari netral atau turun menjadi naik dan HTF mengonfirmasi tren naik, sinyal long dihasilkan; sebaliknya, sinyal short dihasilkan.
-
Kondisi Keluar: Ketika tren pada kerangka waktu trading berubah ke arah sebaliknya, atau ketika tren HTF berubah ke arah sebaliknya (fitur baru di v2.5), strategi menutup posisi yang ada.
-
Filter Waktu: Opsional hanya melakukan trading dalam sesi trading tertentu (misalnya, waktu trading saham AS reguler 0930-1600).
Keunggulan Strategi
-
Adaptif Tinggi: Mekanisme Garis Pelacak secara otomatis menyesuaikan dengan volatilitas pasar, terutama saat filter ATR diaktifkan, memberikan kemampuan adaptasi dinamis untuk lingkungan volatilitas yang berbeda.
-
Mekanisme Konfirmasi Tren: Fungsi konfirmasi multi-kerangka waktu secara efektif menyaring trading "noise", hanya melakukan trading ketika arah tren HTF konsisten, sehingga meningkatkan kualitas sinyal secara signifikan.
-
Opsi Konfigurasi Fleksibel: Strategi menawarkan berbagai pengaturan parameter, termasuk periode dan deviasi Bollinger Bands, periode ATR, filter waktu, dan metode pemilihan HTF, yang dapat dioptimalkan untuk berbagai pasar dan instrumen trading.
-
Responsif Tinggi: Mekanisme reaksi terhadap perubahan tren HTF yang baru ditambahkan di v2.5 memungkinkan strategi bereaksi lebih cepat terhadap perubahan tren besar, membatasi kerugian tepat waktu dan menghindari drawdown yang parah.
-
Bantuan Visual: Strategi menggambar Garis Pelacak pada kerangka waktu trading dan HTF di grafik, dan secara opsional menampilkan label sinyal jual/beli, membuat logika trading mudah dipahami secara visual.
-
Manajemen Posisi: Dengan pengaturan pyramiding=0, strategi mencegah beberapa entry dalam arah yang sama, menghindari akumulasi risiko yang tidak perlu.
Risiko Strategi
-
Risiko Breakout Palsu: Meskipun menggunakan Bollinger Bands dan konfirmasi HTF, pasar masih dapat menghasilkan breakout palsu, terutama di lingkungan volatilitas tinggi. Solusi: Dapat meningkatkan nilai deviasi Bollinger Bands atau memperpanjang periode konfirmasi, atau bahkan menambahkan mekanisme konfirmasi breakout tambahan.
-
Sensitivitas Parameter: Kinerja strategi cukup sensitif terhadap parameter seperti periode ATR dan pengaturan Bollinger Bands. Solusi: Backtest harus dilakukan untuk menemukan kombinasi parameter yang paling sesuai untuk instrumen trading tertentu, dan menghindari overfitting yang menyebabkan kurva fitting.
-
Keterlambatan Perubahan Tren: Mekanisme Garis Pelacak mungkin bereaksi lambat pada tahap awal tren, menyebabkan entry yang sedikit terlambat. Solusi: Dapat mempertimbangkan menggunakan pengganda ATR yang lebih kecil atau periode Bollinger Bands yang lebih pendek untuk meningkatkan kecepatan respons, tetapi harus menyeimbangkan kualitas sinyal dan responsivitas.
-
Ketergantungan Kerangka Waktu: Pemilihan HTF yang tidak tepat dapat menyebabkan penyaringan berlebihan atau konflik sinyal. Solusi: Disarankan menggunakan fitur pemilihan HTF otomatis, yang secara otomatis memilih kerangka waktu yang lebih tinggi yang sesuai berdasarkan kerangka waktu grafik saat ini.
-
Ketiadaan Manajemen Risiko: Strategi itu sendiri tidak mencakup mekanisme manajemen risiko yang lengkap. Solusi: Dalam aplikasi praktis, harus dikombinasikan dengan strategi stop loss yang sesuai dan aturan manajemen posisi, seperti risiko persentase tetap atau stop loss kelipatan ATR.
Arah Optimalisasi Strategi
-
Penyaringan Sinyal yang Ditingkatkan: Dapat mempertimbangkan untuk memperkenalkan indikator teknis lainnya, seperti Relative Strength Index (RSI) atau Stochastic, untuk mengonfirmasi sinyal entry, hanya melakukan trading ketika indikator menunjukkan kondisi overbought/oversold. Ini akan lebih mengurangi sinyal breakout palsu dan meningkatkan win rate.
-
Penyesuaian Parameter Dinamis: Dapat mengembangkan mekanisme penyesuaian parameter adaptif berdasarkan kondisi pasar, misalnya secara otomatis meningkatkan nilai deviasi Bollinger Bands di lingkungan volatilitas tinggi, dan menguranginya di lingkungan volatilitas rendah, sehingga strategi dapat lebih baik beradaptasi dengan berbagai kondisi pasar.
-
Optimalisasi Penilaian Tren HTF: Dapat memperbaiki algoritma konfirmasi tren HTF, misalnya dengan memperkenalkan persilangan Exponential Moving Average (EMA) atau indikator tren lainnya, tidak hanya mengandalkan arah Garis Pelacak, untuk mendapatkan penilaian tren yang lebih stabil.
-
Manajemen Risiko yang Lebih Komprehensif: Mengintegrasikan sistem manajemen risiko yang lengkap, menyesuaikan ukuran posisi secara dinamis berdasarkan volatilitas pasar dan ukuran akun, menetapkan level stop loss berdasarkan ATR dan target profit, untuk memaksimalkan return yang disesuaikan dengan risiko.
-
Menambahkan Analisis Kondisi Pasar: Memperkenalkan klasifikasi lingkungan pasar, membedakan pasar tren dan pasar sideways, dan secara otomatis menyesuaikan parameter strategi atau aturan trading berdasarkan kondisi pasar, bahkan menghentikan trading di lingkungan pasar yang tidak cocok untuk strategi ini.
-
Integrasi Multi-Strategi: Menggunakan strategi ini sebagai komponen, dikombinasikan dengan strategi komplementer lainnya (seperti strategi reversal atau strategi konfirmasi breakout) untuk membentuk portofolio strategi yang lengkap, menyeimbangkan kinerja di berbagai lingkungan pasar.
Kesimpulan
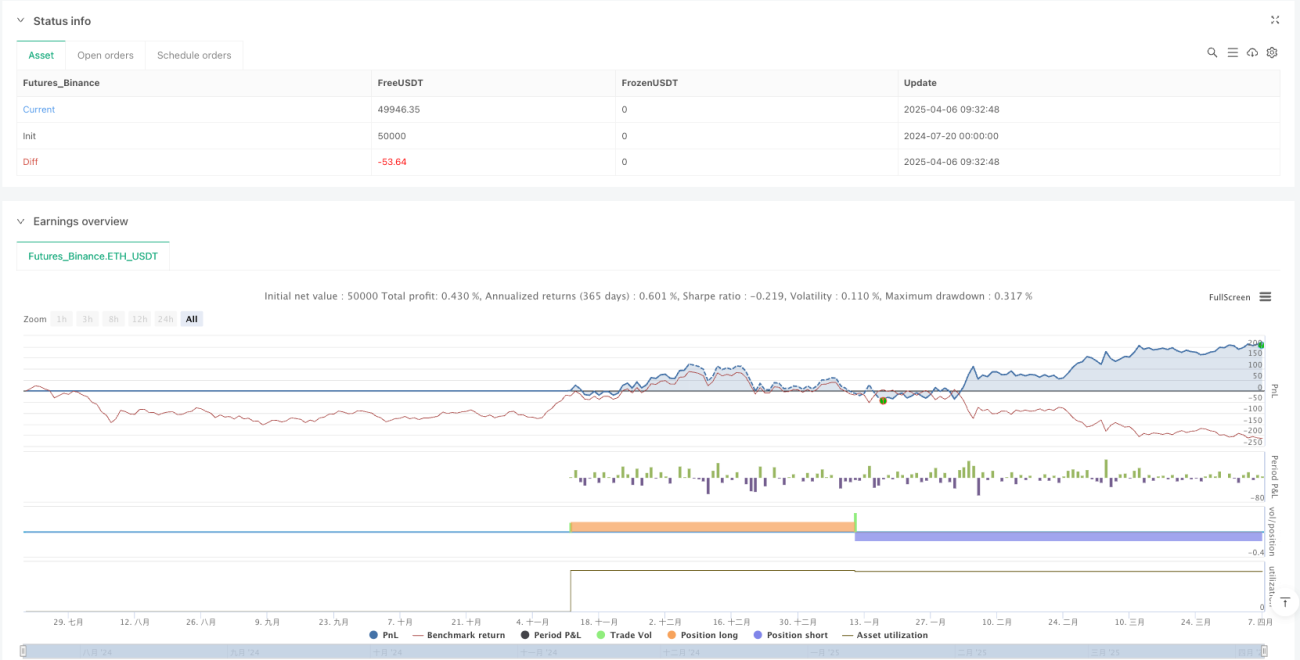
Strategi Pelacakan Tren Dinamis Bollinger Bands dan ATR adalah sistem trading kuantitatif yang dirancang dengan cermat, yang secara efektif mengidentifikasi dan melacak tren pasar dengan menggabungkan Bollinger Bands, ATR, dan analisis multi-kerangka waktu. Keunggulan inti dari strategi ini terletak pada kemampuan adaptif dan fleksibilitasnya, yang secara dinamis menyesuaikan dengan kondisi pasar, sementara mekanisme konfirmasi HTF meningkatkan kualitas sinyal dan win rate.
Meskipun terdapat beberapa risiko inheren, seperti sensitivitas parameter dan masalah breakout palsu, hal ini dapat dikurangi melalui optimalisasi parameter yang tepat dan mekanisme penyaringan tambahan. Arah optimalisasi strategi, seperti penyaringan sinyal yang ditingkatkan, penyesuaian parameter dinamis, dan manajemen risiko yang lebih komprehensif, menyediakan jalur yang jelas untuk meningkatkan kinerja strategi lebih lanjut.
Secara keseluruhan, strategi ini sangat cocok untuk trader tren jangka menengah hingga panjang, menyediakan kerangka kerja yang kuat untuk mengidentifikasi perubahan tren dan mengeksekusi trading dalam kondisi pasar yang menguntungkan. Dengan pengaturan parameter yang tepat dan manajemen risiko yang sesuai, strategi ini berpotensi menghasilkan return yang stabil di berbagai lingkungan pasar.
/*backtest
start: 2024-07-20 00:00:00
end: 2025-04-07 00:00:00
period: 2d
basePeriod: 2d
exchanges: [{"eid":"Futures_Binance","currency":"ETH_USDT"}]
*/

//@version=6
//@fenyesk
//Optional Working Hours and ATR based TP/SL removed
// Added Optional Higher Timeframe Confirmation with Auto/Manual Selection- 1