Sistem Strategi Perdagangan Trend Following dan Hedging Fibonacci Multi-Level

Ikhtisar
Sistem Strategi Perdagangan Fibonacci Multi-Level Trend Following dan Hedging adalah strategi perdagangan kuantitatif komprehensif yang mengintegrasikan berbagai indikator analisis teknis. Strategi ini berpusat pada teori retracement Fibonacci, dikombinasikan dengan beberapa indikator teknis seperti Exponential Moving Average (EMA), Average True Range (ATR), Average Directional Index (ADX), dan Directional Movement Index (DMI), untuk membangun kerangka analisis pasar multidimensi. Strategi ini tidak hanya memiliki fungsi trend-following tradisional, tetapi juga mengintegrasikan mekanisme perdagangan pantulan dan fungsi hedging, yang bertujuan untuk menangkap peluang profit dan mengendalikan risiko secara efektif dalam berbagai kondisi pasar.
Keunikan strategi ini terletak pada sistem manajemen risiko bertingkat dan mode perdagangan yang fleksibel. Dengan menetapkan beberapa target take profit (TP1 dan TP2) dan mekanisme stop-loss dinamis berbasis ATR, strategi ini dapat memaksimalkan potensi keuntungan sambil melindungi modal. Selain itu, fungsi hedging bawaan memberikan bantalan risiko tambahan, memungkinkan strategi untuk mempertahankan kinerja yang relatif stabil bahkan di lingkungan pasar yang sangat fluktuatif.
Prinsip Strategi
Logika inti strategi didasarkan pada kombinasi teori retracement Fibonacci dan analisis tren. Pertama, strategi menentukan level retracement Fibonacci dengan menghitung titik tertinggi dan terendah dalam periode tertentu, termasuk level kunci seperti 23,6%, 38,2%, 50%, 61,8%, 78,6%, 100%, dan 161,8%. Level-level ini digunakan sebagai level support dan resistance penting, memberikan referensi kunci untuk menghasilkan sinyal perdagangan.
Dalam identifikasi tren, strategi menggunakan Exponential Moving Average 50 periode sebagai alat utama penentu tren. Ketika harga berada di atas EMA selama tiga bar berturut-turut, tren dianggap naik; sebaliknya, tren turun. Pada saat yang sama, strategi juga menganalisis struktur harga dengan mengidentifikasi higher low dan higher high untuk mengkonfirmasi struktur bullish, serta lower high dan lower low untuk mengkonfirmasi struktur bearish.
Pengenalan indikator ADX dan DMI meningkatkan akurasi penilaian kekuatan tren. Nilai ADX lebih dari 20 dianggap sebagai standar tren yang kuat, sedangkan kekuatan relatif +DI dan -DI digunakan untuk menentukan arah tren. Analisis volume juga merupakan bagian penting dari strategi; ketika volume melebihi 1,2 kali rata-rata 20 periode, dianggap sebagai konfirmasi volume yang valid.
Pembuatan sinyal perdagangan memerlukan pemenuhan beberapa kondisi secara bersamaan: arah tren yang jelas, harga mendekati level Fibonacci kunci, kekuatan tren yang memadai, konfirmasi indikator directional, dan peningkatan volume. Mekanisme penyaringan ganda ini sangat meningkatkan keandalan sinyal dan mengurangi probabilitas sinyal palsu.
Keunggulan Strategi
Strategi ini memiliki beberapa keunggulan signifikan, pertama tercermin dalam kerangka analisis teknis yang komprehensif. Dengan mengintegrasikan teori Fibonacci, analisis tren, indikator momentum, dan analisis volume, strategi dapat mengevaluasi kondisi pasar dari berbagai dimensi, memberikan sinyal perdagangan yang lebih lengkap dan akurat. Metode penggabungan multi-indikator ini secara efektif mengurangi sinyal yang menyesatkan yang mungkin dihasilkan oleh indikator tunggal, meningkatkan stabilitas dan keandalan strategi secara keseluruhan.
Sistem manajemen risiko strategi ini adalah keunggulan lainnya. Mekanisme dual take profit memungkinkan trader untuk mengunci sebagian keuntungan saat mencapai target pertama, sambil mempertahankan posisi sisa untuk mengejar keuntungan yang lebih besar. Stop-loss dinamis berbasis ATR secara otomatis menyesuaikan tingkat pengendalian risiko sesuai dengan volatilitas pasar, baik memperketat stop-loss saat volatilitas rendah untuk melindungi keuntungan, maupun melonggarkan stop-loss saat volatilitas tinggi untuk menghindari terguncang oleh fluktuasi normal.
Fungsi perdagangan pantulan menambahkan peluang profit tambahan bagi strategi. Ketika harga memantul dari level support atau resistance kunci, strategi dapat dengan cepat mengidentifikasi dan berpartisipasi dalam pembalikan jangka pendek ini, sehingga menambah lebih banyak peluang perdagangan di samping perdagangan tren. Fleksibilitas ini memungkinkan strategi beradaptasi dengan berbagai kondisi pasar, baik pasar tren kuat maupun pasar sideways, tetap dapat menemukan peluang perdagangan yang sesuai.
Integrasi fungsi hedging adalah fitur inovatif dari strategi ini. Ketika posisi long aktif dan muncul sinyal short, strategi akan membuka posisi hedging short; dan sebaliknya. Mekanisme ini memberikan perlindungan tambahan saat pasar berbalik dengan cepat, mengurangi potensi kerugian dan mungkin mengubahnya menjadi peluang profit baru.
Pengaturan filter waktu mencegah overtrading. Dengan mensyaratkan jeda minimal 5 bar antara sinyal berturut-turut, strategi menghindari pembukaan posisi yang terlalu sering dalam waktu singkat, mengurangi biaya perdagangan dan meningkatkan kualitas sinyal.
Risiko Strategi
Meskipun strategi ini memiliki beberapa keunggulan, masih ada beberapa faktor risiko yang perlu diperhatikan. Pertama adalah risiko ketergantungan parameter. Strategi melibatkan beberapa pengaturan parameter, termasuk periode Fibonacci, toleransi, kelipatan ATR, dll., yang memiliki pengaruh signifikan terhadap kinerja strategi. Pengaturan parameter yang tidak tepat dapat menyebabkan overfitting pada data historis atau kinerja buruk di pasar nyata. Oleh karena itu, diperlukan backtesting yang memadai dan optimasi parameter untuk menemukan kombinasi parameter yang paling sesuai untuk pasar dan kerangka waktu tertentu.
Adaptasi lingkungan pasar adalah risiko potensial lainnya. Strategi terutama didasarkan pada analisis teknis, dan mungkin berkinerja buruk dalam kondisi pasar tertentu, misalnya dalam tren satu arah yang kuat yang didorong oleh fundamental, indikator teknis bisa gagal. Selain itu, dalam lingkungan pasar dengan volatilitas sangat rendah atau sangat tinggi, frekuensi dan akurasi pembuatan sinyal strategi dapat terpengaruh.
Risiko slippage dan eksekusi juga perlu dipertimbangkan. Dalam perdagangan aktual, terutama dalam kondisi pasar yang sangat fluktuatif, mungkin ada perbedaan antara harga eksekusi order dan harga yang diharapkan. Biaya slippage ini dapat menggerus keuntungan teoritis strategi, terutama untuk strategi yang sering bertransaksi.
Fungsi hedging, meskipun memberikan perlindungan tambahan, juga meningkatkan kompleksitas strategi. Dalam beberapa kasus, operasi hedging dapat menyebabkan kerugian pada posisi long dan short secara bersamaan, atau menimbulkan biaya tambahan dalam hal komisi. Oleh karena itu, perlu evaluasi hati-hati terhadap efektivitas nyata dari fungsi hedging, dan pertimbangkan apakah akan mengaktifkannya dalam kondisi pasar tertentu.
Arah Optimasi Strategi
Untuk lebih meningkatkan kinerja strategi, optimasi dapat dilakukan dari berbagai arah. Pertama adalah pengenalan mekanisme penyesuaian parameter dinamis. Parameter kunci seperti periode Fibonacci, kelipatan ATR, dll., dapat disesuaikan secara dinamis berdasarkan volatilitas pasar, kekuatan tren, dll. Misalnya, meningkatkan kelipatan ATR di pasar dengan volatilitas tinggi untuk memberikan ruang stop-loss yang lebih besar, dan mengurangi kelipatan ATR di pasar dengan volatilitas rendah untuk memperketat pengendalian risiko.
Integrasi teknik machine learning adalah arah optimasi penting lainnya. Algoritma machine learning dapat digunakan untuk mengidentifikasi waktu entry terbaik, atau mempelajari konfigurasi parameter optimal dari data historis. Selain itu, teknik natural language processing dapat digunakan untuk menganalisis sentimen pasar dan dampak peristiwa berita terhadap harga, menambahkan dimensi analisis fundamental ke strategi.
Integrasi analisis multi-timeframe dapat memberikan perspektif pasar yang lebih komprehensif. Tren besar dapat dikonfirmasi pada timeframe yang lebih panjang, sementara titik entry yang tepat dapat dicari pada timeframe yang lebih pendek. Analisis terkoordinasi multi-timeframe ini dapat meningkatkan kualitas sinyal dan mengurangi risiko perdagangan melawan tren.
Optimasi manajemen modal juga merupakan cara penting untuk meningkatkan kinerja strategi. Ukuran posisi dapat disesuaikan secara dinamis berdasarkan kondisi pasar, tingkat keyakinan strategi, dll. Misalnya, meningkatkan posisi pada sinyal dengan keyakinan tinggi, dan mengurangi posisi pada sinyal dengan keyakinan rendah. Selain itu, mekanisme pengendalian drawdown maksimum dapat diperkenalkan, secara otomatis mengurangi posisi atau menghentikan perdagangan ketika strategi mengalami kerugian besar.
Penyempurnaan lebih lanjut dari logika take profit dan stop-loss juga layak dipertimbangkan. Mekanisme trailing stop dapat diperkenalkan, menyesuaikan posisi stop-loss secara dinamis berdasarkan pergerakan harga untuk mengunci lebih banyak keuntungan. Pada saat yang sama, target take profit yang lebih cerdas dapat ditetapkan berdasarkan karakteristik struktur pasar, misalnya take profit lebih awal di dekat level resistance kunci.
Kesimpulan
Sistem Strategi Perdagangan Fibonacci Multi-Level Trend Following dan Hedging mewakili arah perkembangan penting dalam teknologi perdagangan kuantitatif modern. Strategi ini dengan cerdik mengintegrasikan berbagai alat analisis teknis klasik, membangun kerangka perdagangan yang kokoh dan fleksibel. Mekanisme penyaringan gandanya memastikan kualitas sinyal, sistem manajemen risiko bertingkat memberikan perlindungan modal yang efektif, dan fungsi hedging menambahkan margin keamanan tambahan bagi strategi.
Implementasi strategi yang sukses memerlukan pemahaman penuh tentang prinsip dasar dan mekanisme operasinya, serta penyesuaian dan optimasi parameter yang sesuai berdasarkan lingkungan perdagangan spesifik. Meskipun strategi ini memiliki desain yang baik secara teoritis, dalam aplikasi praktis tetap perlu mempertimbangkan faktor-faktor dunia nyata seperti struktur mikro pasar, biaya perdagangan, slippage, dll.
Seiring dengan perkembangan teknologi kecerdasan buatan dan pembelajaran mesin, strategi ini masih memiliki ruang optimasi yang besar. Dengan memperkenalkan teknik analisis data yang lebih maju dan mekanisme adaptif, kinerja strategi diharapkan dapat ditingkatkan lebih lanjut. Bagi trader kuantitatif, strategi komprehensif semacam ini menyediakan platform pembelajaran dan peningkatan yang berharga, membantu memahami secara mendalam dinamika pasar dan pentingnya manajemen risiko.
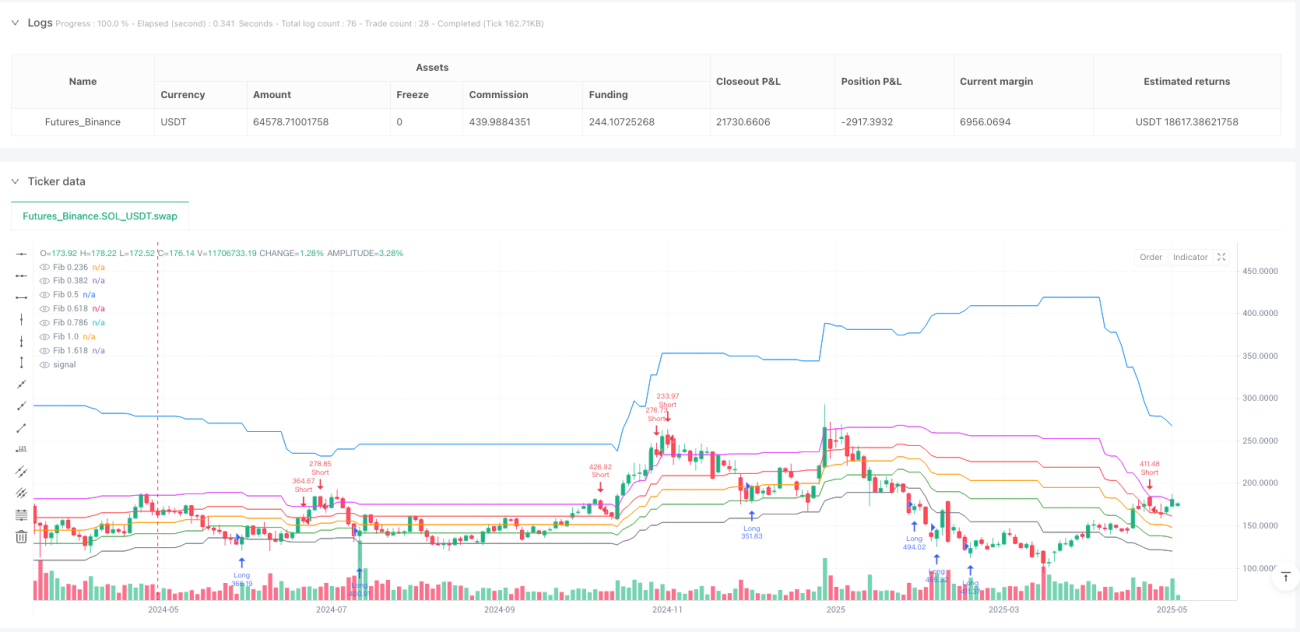
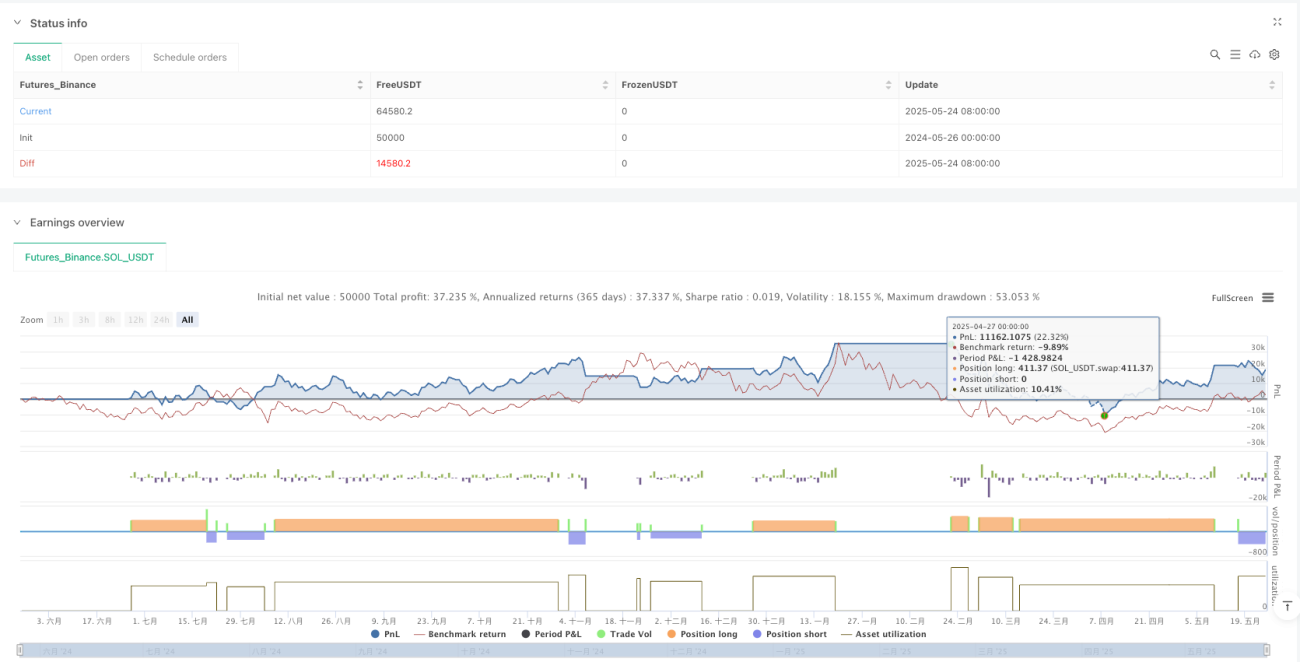
/*backtest
start: 2024-05-26 00:00:00
end: 2025-05-25 00:00:00
period: 2d
basePeriod: 2d
exchanges: [{"eid":"Futures_Binance","currency":"SOL_USDT"}]
*/

//@version=5
strategy("Fibonacci Trend v6.4 - TP/SL Labels", overlay=true, default_qty_type=strategy.percent_of_equity, default_qty_value=100)

// === Parameters ===- 1