
Gambaran Umum
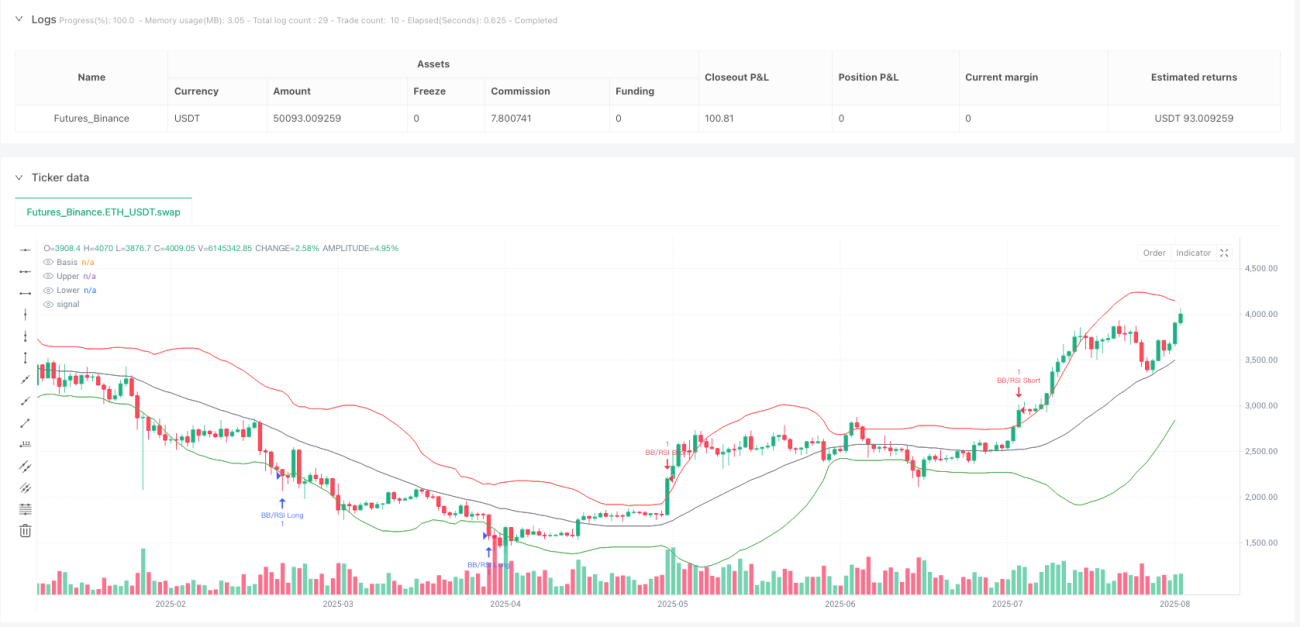
Strategi ini menggabungkan indikator Bollinger Bands dan RSI melalui metode konfirmasi ganda untuk mengidentifikasi titik pembalikan pasar potensial. Ketika harga menembus Bollinger Bands bawah dan RSI mengonfirmasi kondisi oversold, posisi long (beli) dibuka; ketika harga menembus Bollinger Bands atas dan RSI mengonfirmasi kondisi overbought, posisi short (jual) dibuka. Strategi ini juga menerapkan mekanisme manajemen risiko berupa stop loss tetap dan trailing stop untuk menangkap peluang perdagangan pembalikan dengan probabilitas tinggi sambil melindungi modal.
Prinsip Strategi
Strategi ini beroperasi berdasarkan prinsip mean reversion dan mekanisme konfirmasi momentum. Bollinger Bands membantu mengidentifikasi titik ekstrem harga relatif terhadap volatilitas terkini, sedangkan RSI mengonfirmasi apakah pasar benar-benar dalam kondisi overbought atau oversold. Prinsip inti meliputi:
- Menggunakan Bollinger Bands (pita volatilitas di sekitar SMA berdasarkan standar deviasi) untuk mengidentifikasi kapan harga menyimpang secara signifikan dari nilai rata-ratanya.
- Mengonfirmasi potensi pembalikan melalui pembacaan RSI, menyaring sinyal palsu.
- Menerapkan mekanisme manajemen risiko komprehensif berupa stop loss tetap dan trailing stop.
- Memperdagangkan peluang long dan short berdasarkan prinsip teknis yang sama.
Dalam implementasi kode, strategi menggunakan SMA periode 30 hari untuk menghitung garis tengah Bollinger Bands dengan pengganda standar deviasi 2,0, serta RSI periode 14 hari sebagai konfirmasi momentum. Sinyal short dipicu ketika harga menembus pita atas dan RSI di atas 70; sinyal long dipicu ketika harga menembus pita bawah dan RSI di bawah 30. Setiap perdagangan menerapkan stop loss tetap 40 poin dan trailing stop 40 poin untuk memastikan risiko terkendali.
Keunggulan Strategi
- Mekanisme konfirmasi ganda mengurangi sinyal palsu dengan mensyaratkan aksi harga (Bollinger Bands) dan momentum (RSI) terpenuhi secara bersamaan.
- Pendekatan mean reversion memanfaatkan kecenderungan pasar untuk kembali ke nilai rata-rata setelah pergerakan ekstrem.
- Parameter yang fleksibel memungkinkan strategi beradaptasi dengan berbagai kondisi pasar dan instrumen perdagangan.
- Strategi stop loss komprehensif yang menggabungkan stop loss tetap dan trailing stop membantu melindungi modal dan mengunci keuntungan.
- Implementasi yang relatif sederhana membuat strategi mudah dipahami, namun cukup kompleks untuk menyaring noise pasar.
- Simetri strategi memungkinkan penanganan peluang long dan short dengan prinsip yang sama.
- Struktur kode yang jelas dan desain parameterisasi memungkinkan optimasi penyesuaian sesuai karakteristik pasar yang berbeda.
Risiko Strategi
- Di pasar dengan tren kuat, strategi mean reversion dapat menghadapi kerugian beruntun yang berulang.
- Nilai stop loss tetap mungkin tidak selalu optimal di berbagai volatilitas pasar.
- Dalam tren yang berkelanjutan, RSI dan Bollinger Bands dapat bertahan di zona ekstrem untuk waktu yang lama, mengakibatkan entry yang terlalu dini.
- Nilai stop loss tetap 40 poin tidak menyesuaikan diri secara adaptif terhadap instrumen perdagangan yang berbeda dan kisaran harga tipikalnya.
- Kurangnya logika manajemen posisi dapat menyebabkan eksposur risiko yang tidak merata antar perdagangan.
- Tidak adanya mekanisme keluar berbasis waktu dapat menyebabkan posisi bertahan terlalu lama di pasar yang bergerak sideways.
- Di lingkungan dengan volatilitas tinggi, jumlah poin stop loss tetap mungkin tidak cukup untuk melindungi modal.
Arah Optimasi Strategi
- Mengimplementasikan nilai stop loss dan trailing stop adaptif berdasarkan ATR (Average True Range) atau volatilitas historis.
- Menambahkan filter tren untuk menghindari perdagangan kontra-tren di pasar dengan tren kuat.
- Mengintegrasikan konfirmasi volume untuk meningkatkan kualitas sinyal.
- Mengembangkan manajemen posisi dinamis berdasarkan volatilitas atau indikator risiko.
- Menambahkan aturan keluar berbasis waktu untuk menghindari posisi yang terlalu lama.
- Menguji metode perhitungan Bollinger Bands alternatif (misalnya menggunakan EMA alih-alih SMA, atau pengganda standar deviasi yang berbeda).
- Mengoptimalkan waktu entry dengan menambahkan indikator konfirmasi pendukung.
- Mempertimbangkan aturan take profit parsial untuk memperbaiki rasio risk-reward secara keseluruhan.
- Mengeksplorasi penambahan mekanisme penyesuaian volatilitas agar strategi lebih stabil di berbagai lingkungan volatilitas.
Ringkasan
Strategi mean reversion dengan konfirmasi ganda Bollinger Bands-RSI dan perlindungan trailing stop mewakili pendekatan yang matang dalam perdagangan pembalikan pasar. Dengan menggabungkan sinyal volatilitas dari Bollinger Bands dan konfirmasi momentum dari RSI, strategi ini bertujuan menangkap titik pembalikan dengan probabilitas tinggi sambil menyaring sinyal palsu. Mekanisme manajemen risiko yang terintegrasi memberikan lapisan perlindungan penting melalui stop loss tetap dan trailing stop. Meskipun strategi ini memiliki keunggulan yang jelas dalam mengidentifikasi titik pembalikan potensial dengan konfirmasi ganda, strategi ini masih dapat memperoleh manfaat dari optimasi lebih lanjut, terutama dalam adaptasi terhadap berbagai kondisi pasar dan penerapan manajemen posisi serta mekanisme keluar yang lebih kompleks. Secara keseluruhan, ini merupakan fondasi yang kokoh untuk pendekatan perdagangan mean reversion yang menyeimbangkan kualitas sinyal dan manajemen risiko.
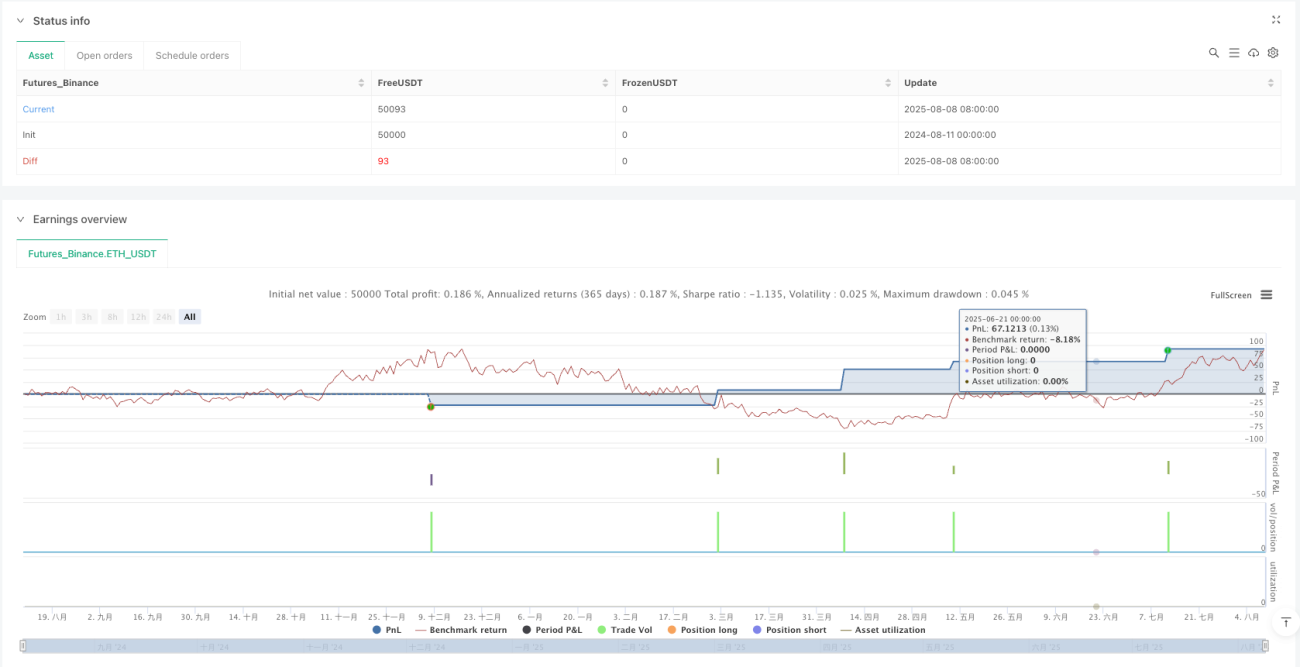
/*backtest
start: 2024-08-11 00:00:00
end: 2025-08-09 08:00:00
period: 1d
basePeriod: 1d
exchanges: [{"eid":"Futures_Binance","currency":"ETH_USDT"}]
*/

//@version=5
strategy("BB & RSI Trailing Stop Strategy", overlay=true, initial_capital=10000)

// --- Inputs for Bollinger Bands, RSI, and Trade Management ---- 1