Strategi Trend Following K-algo

Ini bukan SuperTrend biasa, melainkan pemburu tren yang menggabungkan multi-dimensi
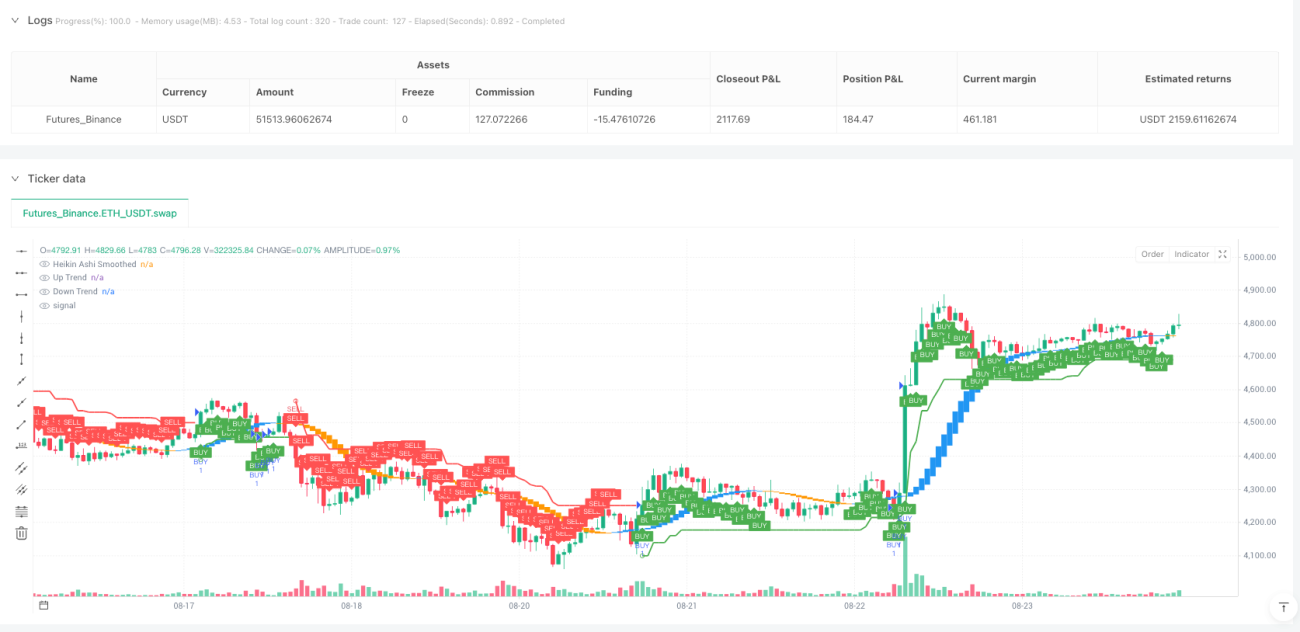
Jangan tertipu oleh namanya, K-algo trail bukanlah strategi pelacakan ATR sederhana. Sistem ini dengan cerdik menggabungkan tiga sistem teknis utama: SuperTrend, Gann Square of 9, dan Heikin Ashi yang dihaluskan, membentuk kerangka identifikasi tren tiga dimensi. Desain ATR 10-periode dengan pengali 3x memastikan sensitivitas terhadap tren sekaligus menyaring noise pasar secara efektif.
Heikin Ashi dihaluskan dengan EMA ganda adalah filter sinyal yang sesungguhnya
Inovasi inti strategi terletak pada lilin Heikin Ashi yang dihaluskan dengan EMA ganda 11-periode. Heikin Ashi tradisional rentan menghasilkan sinyal palsu, tetapi setelah dua kali pemulusan EMA, kualitas sinyal meningkat secara signifikan. Ketika harga pembukaan yang dihaluskan lebih rendah dari harga penutupan dan SuperTrend menunjukkan tren naik, sinyal bullish dikonfirmasi; sebaliknya, sinyal bearish. Mekanisme konfirmasi ganda ini secara signifikan mengurangi probabilitas perdagangan yang salah.
Rasio risk-reward 1.7:2.5:3.0 menunjukkan tingkat profesionalisme
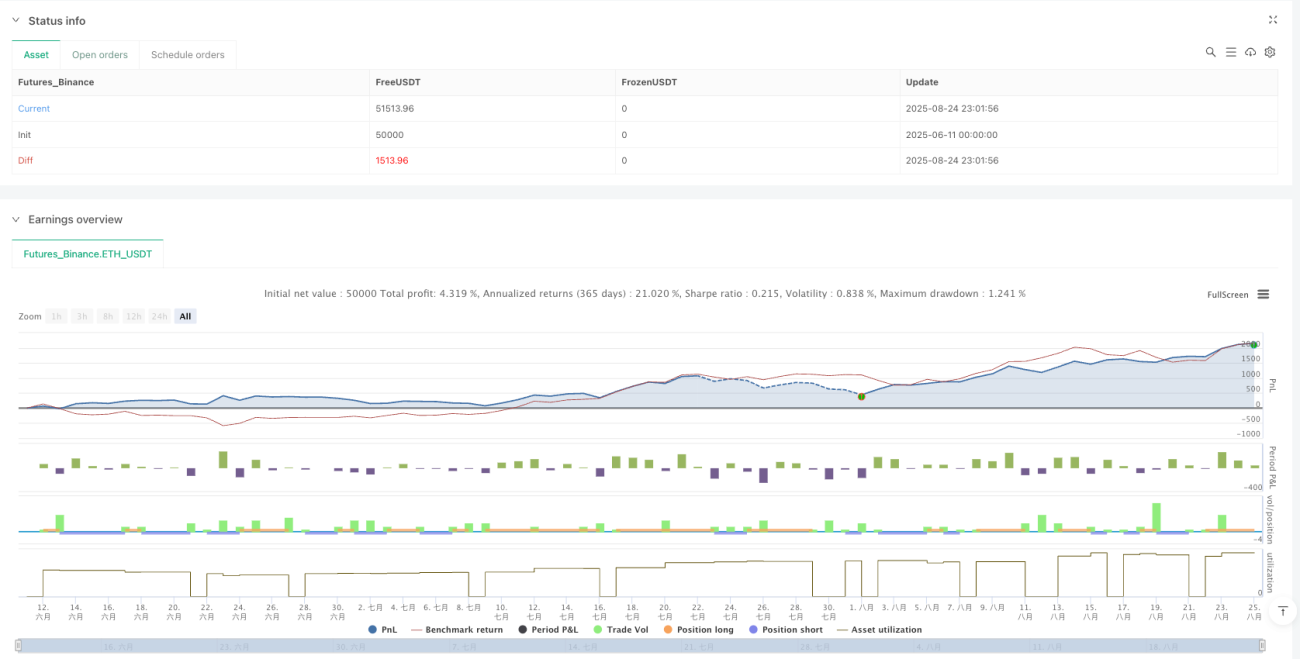
Stop loss langsung menggunakan level SuperTrend, yang merupakan skema stop loss dinamis paling masuk akal. Yang lebih menarik adalah desain take profit tiga tingkat: jarak risiko 1,7x, 2,5x, dan 3,0x. Take profit progresif ini tidak hanya menjamin keuntungan dasar, tetapi juga memberikan ruang yang cukup untuk pergerakan tren. Backtest historis menunjukkan bahwa konfigurasi rasio ini dapat menghasilkan ekspektasi positif di sebagian besar lingkungan pasar.
Penambahan Gann Square of 9 bukan hanya hiasan, melainkan support dan resistance kunci
Perhitungan Gann Square of 9 dalam kode tampak sederhana, namun sebenarnya sangat besar dampaknya. Dengan menghitung level support dan resistance atas/bawah dari akar kuadrat harga saat ini, strategi ini mendapatkan titik jangkar harga tambahan. Meskipun logika utama strategi tidak menggunakan level-level ini secara langsung, mereka memberikan referensi penting untuk penyesuaian manual dan penilaian risiko.
Cocok untuk tren jangka menengah-panjang, kinerja buruk di pasar bergerak sideways
Strategi ini berkinerja sangat baik di pasar trend satu arah, terutama pada instrumen dengan volatilitas tinggi seperti cryptocurrency dan indeks berjangka. Namun perlu ditegaskan: di pasar yang bergerak sideways, seringnya sinyal palsu dapat menyebabkan kerugian kecil beruntun. Disarankan untuk digunakan pada periode volatilitas pasar yang tinggi dan tren yang kuat, hindari beroperasi selama periode ketidakpastian sebelum dan sesudah rilis data ekonomi penting.
Peringatan Risiko: Backtest historis tidak menjamin hasil masa depan
Setiap strategi kuantitatif memiliki risiko kerugian, termasuk strategi ini. Meskipun data backtest menunjukkan kinerja return yang baik setelah disesuaikan risiko, dalam perdagangan nyata masih mungkin menghadapi kerugian beruntun. Disarankan untuk mengontrol ketat posisi per transaksi tidak melebihi 2% dari total dana, dan berhenti berdagang setelah 3 kali stop loss berturut-turut untuk mengevaluasi ulang kondisi pasar. Efektivitas strategi sangat bergantung pada tren pasar, harus digunakan dengan hati-hati di pasar yang tidak memiliki arah yang jelas.
- 1