Robot Investasi Berkala Cerdas

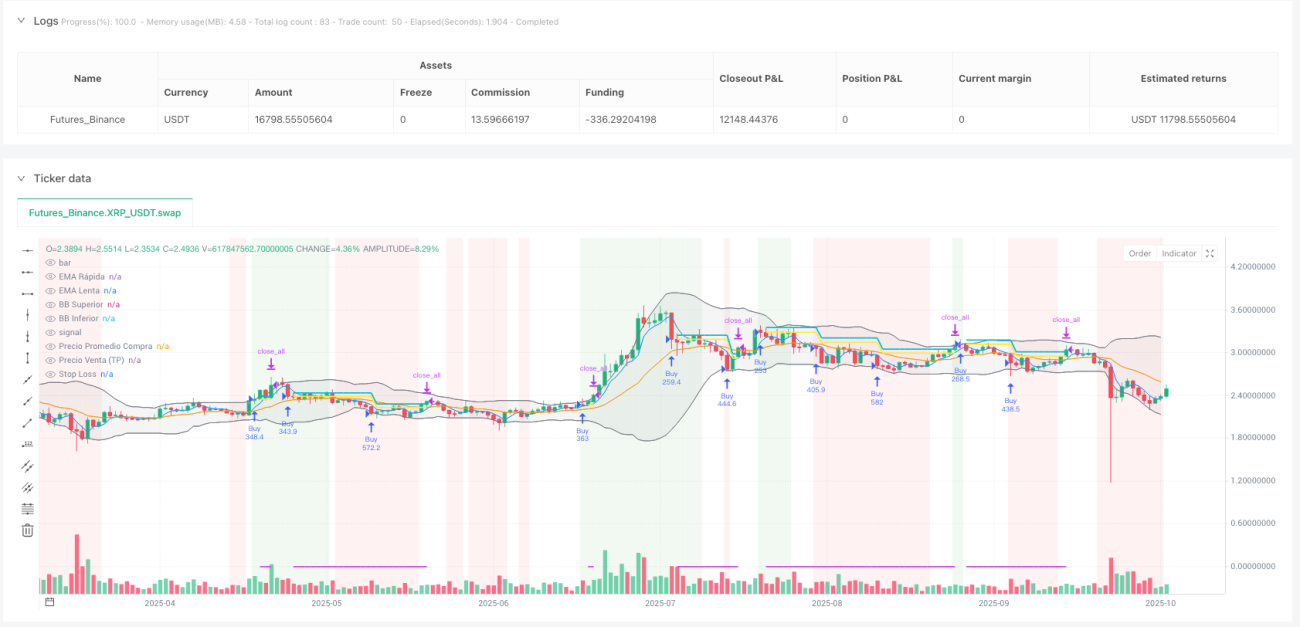
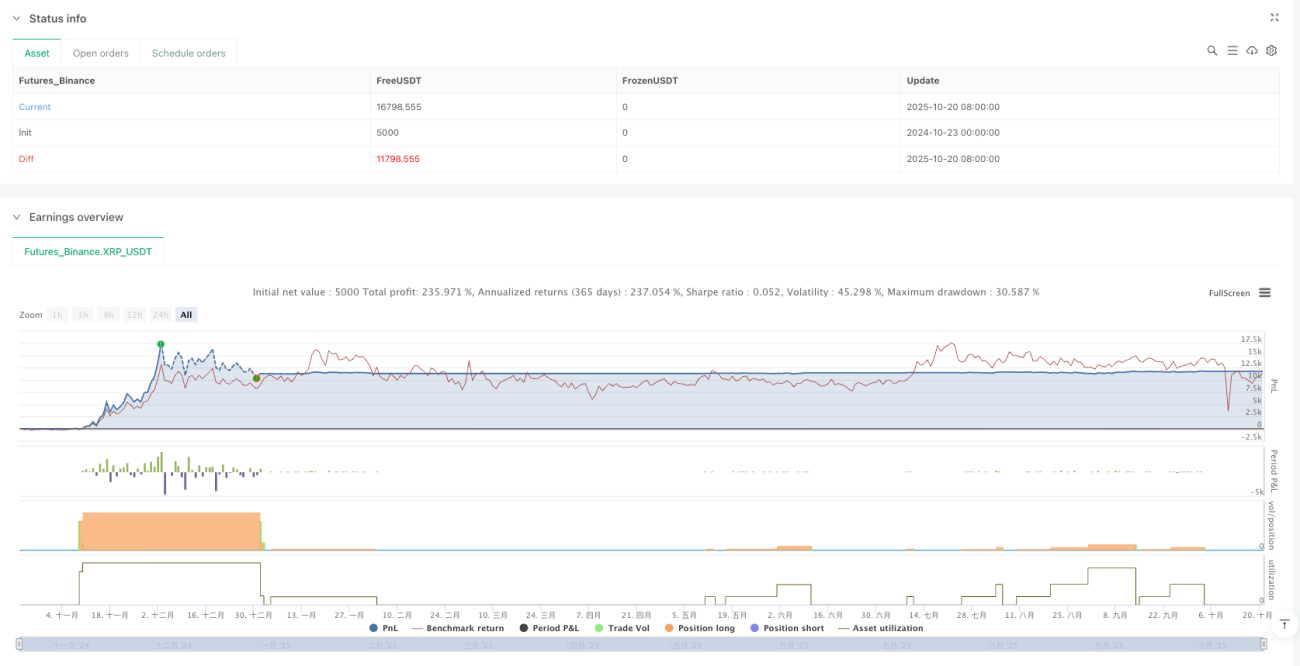
🤖 Ini Bukan DCA Biasa – Ini Robot DCA yang Berpikir!
Tahu nggak? Kebanyakan orang melakukan DCA seperti "beli-beli-beli" tanpa berpikir, tapi strategi ini seperti punya asisten investasi super pintar! Ia menyesuaikan jumlah pembelian berdasarkan kondisi pasar, mulai dari 5% awal dan meningkat secara bertahap hingga 100%. Ibarat belanja di pasar tradisional – beli lebih banyak saat murah, beli lebih sedikit saat mahal. Sederhana, brutal, tapi sangat efektif!
📊 Empat Indikator Teknis Bekerja Sama, Tren Pasar Terlihat Jelas
Poin penting! Strategi ini menggunakan kombinasi empat indikator teknis:
- EMA Cepat/Lambat: Seperti "pemantau detak jantung" pasar, menunjukkan arah tren
- MACD: "Barometer" momentum pasar untuk menentukan waktu masuk dan keluar
- RSI: "Termometer" overbought/oversold untuk menghindari membeli di puncak dan menjual di dasar
- Bollinger Bands: "Zona aman" volatilitas harga untuk menentukan support dan resistance
Keempat indikator ini bekerja sama seperti membentuk "Avengers" – masing-masing punya peran, tapi koordinasi sempurna!
💡 Logika Penambahan Posisi Cerdas: Semakin Turun Semakin Beli
Peringatan jebakan! Masalah terbesar DCA biasa adalah kontrol ukuran posisi yang buruk. Strategi ini jauh lebih pintar:
- Pembelian awal menggunakan 5% modal untuk uji coba
- Setiap penambahan posisi meningkatkan alokasi sebesar 2,5%
- Semakin besar penurunan harga, semakin besar jarak antar pembelian (2%, 6%, 10%...)
- Investasi tunggal maksimum tidak pernah melebihi 100% total modal
Ibarat naik level di game – investasi semakin besar seiring perkembangan, tapi risiko tetap terkendali ketat!
🎯 Take-Profit dan Stop-Loss Cerdas: Biarkan Laba Berlari, Hentikan Kerugian
Logika keluar dari strategi ini sangat ramah pengguna:
- Minimal laba 2% baru dipertimbangkan untuk dijual: Tidak ada lagi "bekerja keras tanpa hasil"
- Keluar saat tren melemah: Ambil laba selagi bisa, amankan keuntungan
- Penurunan harga 2% memicu sinyal jual: Lindungi laba agar tidak kembali
- Stop-loss dapat dikonfigurasi: Meskipun default 100% (hampir tidak pernah terpicu), Anda bisa menyesuaikan berdasarkan toleransi risiko
Singkatnya, strategi ini "tidak kenal ampun saat menghasilkan uang, dan tegas saat waktunya kabur"!
// This Pine Script™ code is subject to the terms of the MPL 2.0 at https://mozilla.org/MPL/2.0/
// © MTB by Neurodoc
// By Nicolás Astorga

//@version=5
strategy("Master Trading Bot by Neurodoc",
         shorttitle="MTB Adaptation",
         overlay=true,
         initial_capital=10000,
         pyramiding=100,
         commission_value=0.1,
commission_type=strategy.commission.percent,- 1