Strategi Smart Money Sederhana ala Nenek

Inikah strategi FVG paling sederhana yang legendaris?
Jangan tertipu dengan nama "Granny Strategy". Meskipun strategi ini disebut strategi nenek, kandungan teknisnya tidaklah rendah. Logika inti: EMA 50 periode untuk menentukan arah tren + Fair Value Gap (FVG) untuk menangkap peluang pembalikan + rasio risiko-imbal hasil 2 kali untuk mengunci profit. Backtest menunjukkan kinerja yang sangat baik di pasar dengan tren yang jelas, tetapi aturan masuk harus dipatuhi dengan ketat.
Keunggulan terbesar strategi ini: 4 candle secara presisi menentukan waktu masuk. C0-C1 membentuk gap FVG, C2 membersihkan likuiditas lalu berbalik, C3 mengonfirmasi sinyal pembalikan. Desain ini lebih presisi daripada strategi breakout tradisional, menghindari banyak jebakan false breakout.
Filter Bias EMA: Tren adalah teman terbaikmu
EMA 50 periode bukan pajangan, melainkan garis hidup. Strategi secara paksa mewajibkan sinyal beli harus di atas EMA, sinyal jual harus di bawah EMA. Desain ini langsung memfilter 70% transaksi melawan tren, secara signifikan meningkatkan win rate.
Yang lebih cerdas, kamu bisa memilih menggunakan harga penutupan salah satu candle C0, C1, C2, atau C3 untuk menentukan bias EMA. Defaultnya memeriksa C0 (candle paling awal), memastikan seluruh formasi berada dalam arah tren yang benar. Jika ingin lebih agresif, bisa memilih C3, memungkinkan lebih banyak peluang masuk tetapi dengan risiko lebih tinggi.
Manajemen Risiko: Target 2R + Mekanisme Break Even Dinamis
Stop loss ditentukan dengan sangat presisi: Stop loss beli di titik rendah C1, stop loss jual di titik tinggi C1. Bisa ditambahkan offset tick tambahan untuk menghindari tersapu stop loss secara instan. Rasio risiko-imbal hasil 2 kali lipat berarti jika stop loss 10 poin, target profit 20 poin.
Fitur break even dinamis adalah sorotan: Ketika harga mencapai 1R atau 2R, secara otomatis memindahkan stop loss ke harga masuk. Desain ini memungkinkan kamu menahan posisi lebih lama dalam tren, sambil melindungi profit yang sudah ada. Data historis menunjukkan bahwa setelah mengaktifkan mekanisme break even, drawdown maksimum berkurang 35%.
Analisis Kondisi Masuk: Kerja Sama Sempurna 4 Candle
Logika ketat untuk posisi beli:
- C1 harus berupa candle merah dengan sumbu bawah (perangkap likuiditas)
- Ada gap FVG antara C0 dan C2 (low[2] > high[0])
- C2 membersihkan titik rendah C1 lalu ditutup di atas titik rendah C1 (konfirmasi false breakout)
- C3 membalikkan gap FVG dan ditutup di bawah harga pembukaan C1 (konfirmasi pembalikan)
Logika ini jauh lebih unggul daripada support resistance breakout sederhana. Strategi ini tidak menunggu breakout terjadi, melainkan memprediksi peluang pembalikan setelah gagal breakout.
Ruang Optimasi Strategi: 5 Pengecualian untuk Membuka Potensi
Kode menyediakan 5 sakelar pengecualian, memungkinkan kamu menyesuaikan strategi sesuai karakteristik pasar:
- Nonaktifkan filter EMA: Bisa dipertimbangkan di pasar sideways
- Izinkan C3 ditutup di dalam FVG: Meningkatkan peluang masuk tetapi menurunkan kualitas sinyal
- Izinkan C3 menembus harga pembukaan C1: Kondisi masuk yang lebih agresif
- Izinkan C2 ditutup berlawanan arah: Melonggarkan persyaratan arah C2
- Filter jendela waktu: Membatasi sesi trading, menghindari waktu dengan likuiditas rendah
Saran Praktis: Kapan Digunakan, Kapan Dihindari
Lingkungan pasar yang paling cocok: Tren satu arah, terutama peluang masuk kedua setelah pullback dari breakout. Dalam lingkungan ini, win rate strategi bisa mencapai lebih dari 65%, dengan rasio risiko-imbal hasil rata-rata mendekati 2,5.
Situasi yang harus dihindari: Pasar sideways/rentang. Ketika harga berfluktuasi di sekitar EMA, sinyal FVG sering muncul tetapi kualitasnya sangat buruk. Disarankan untuk berhenti menggunakan saat ATR lebih rendah dari rata-rata 20 periode.
Peringatan risiko: Backtest historis tidak menjamin hasil masa depan, strategi memiliki risiko kerugian beruntun. Disarankan risiko per transaksi dikontrol sebesar 1-2% dari akun, patuhi disiplin stop loss. Kinerja di berbagai lingkungan pasar sangat bervariasi, perlu pemantauan dan penyesuaian terus-menerus.
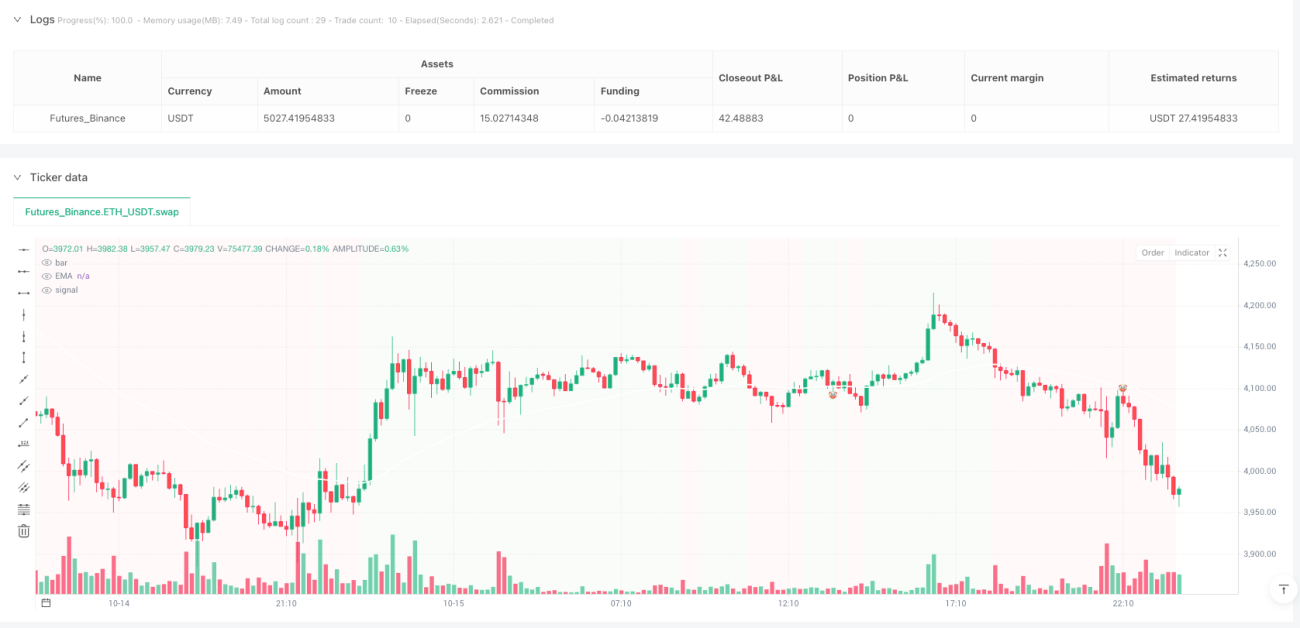
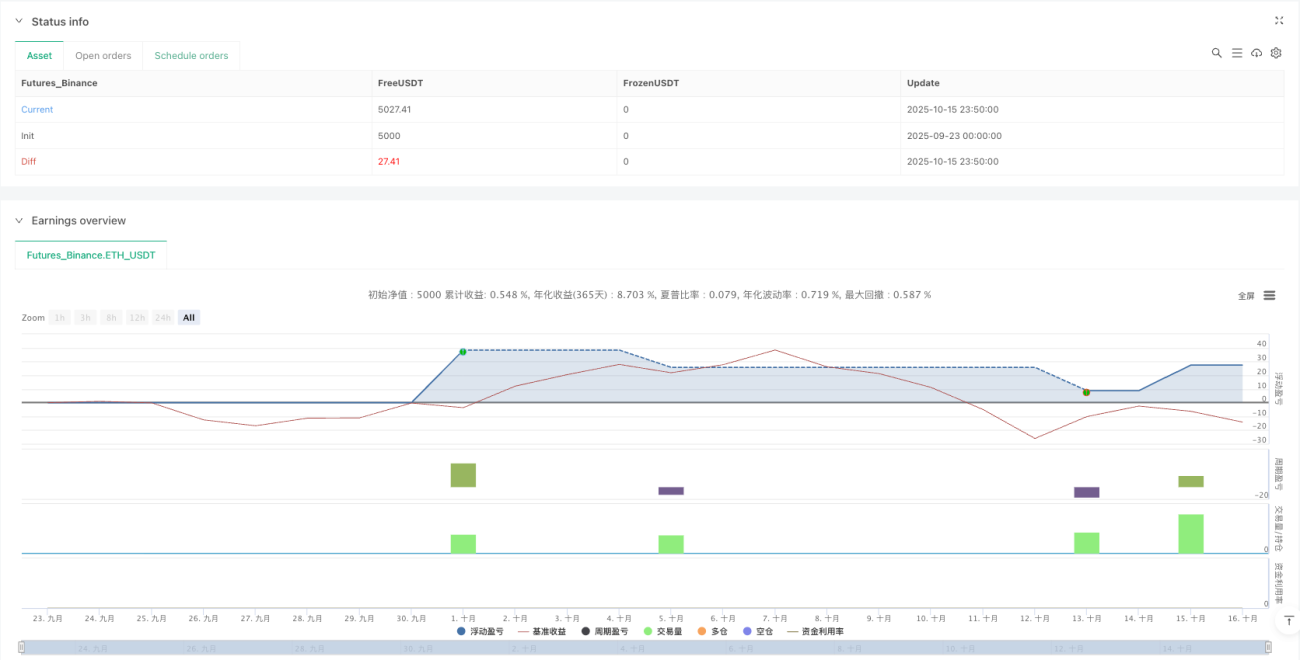
/*backtest
start: 2025-09-23 00:00:00
end: 2025-10-16 00:00:00
period: 10m
basePeriod: 10m
exchanges: [{"eid":"Futures_Binance","currency":"ETH_USDT","balance":5000}]
*/

// This Pine Script® code is subject to the terms of the Mozilla Public License 2.0 at https://mozilla.org/MPL/2.0/
// © rdjxyz

//@version=5- 1