Strategi Pemburu Likuiditas Emas

🎯 Apa yang sebenarnya dilakukan strategi ini?
Tahukah Anda? Ada sekelompok "uang pintar" di pasar yang suka memasang jebakan di level-level kunci! Strategi ini seperti seorang pemburu berpengalaman, yang secara khusus mengidentifikasi jebakan ini dan mengambil posisi sebaliknya. Sederhananya, ketika harga sengaja "menembus palsu" level support/resistance penting lalu dengan cepat ditarik kembali, kita masuk mengikuti ritme modal besar!
📊 Mengungkap Sistem Tiga Lapis Filter
Perhatikan! Strategi ini menggunakan tiga lapis jaring pelindung:
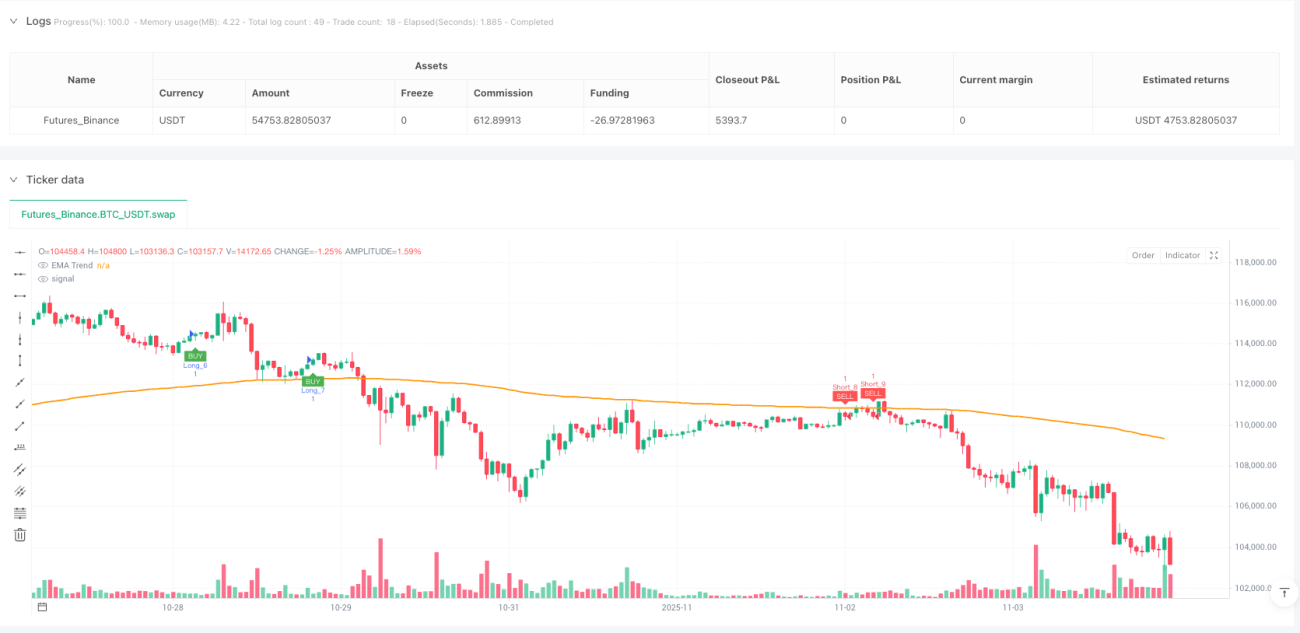
🔸 Filter Tren: EMA 200 periode seperti seorang sopir berpengalaman, memberi tahu Anda apakah ini jalan menanjak atau menurun
🔸 Identifikasi Level Kunci: Secara otomatis menemukan level-level support/resistance yang menjadi "medan pertempuran"
🔸 Deteksi Sapuan Likuiditas: Menangkap "gerakan pura-pura" yang sengaja dibuat oleh modal besar
Ibarat memancing, Anda harus tahu di mana ikannya, umpan apa yang digunakan, dan kapan harus menarik kail!
🎪 Daya Tarik Ajaib Sapuan Likuiditas
Bayangkan: Anda sedang mengantre untuk membeli bubble tea, tiba-tiba seseorang berteriak "Gratis!" Semua orang bergegas ke sana, ternyata bohong, tetapi orang pintar sudah menyelinap ke depan di tengah kekacauan.
Pasar juga seperti itu! Harga terlebih dulu "berpura-pura" menembus level support (menyapu stop loss), lalu dengan cepat ditarik kembali, saat itulah waktu masuk terbaik. Strategi ini menetapkan buffer 0,6 kali ATR, memastikan itu benar-benar "sapuan" bukan penembusan asli.
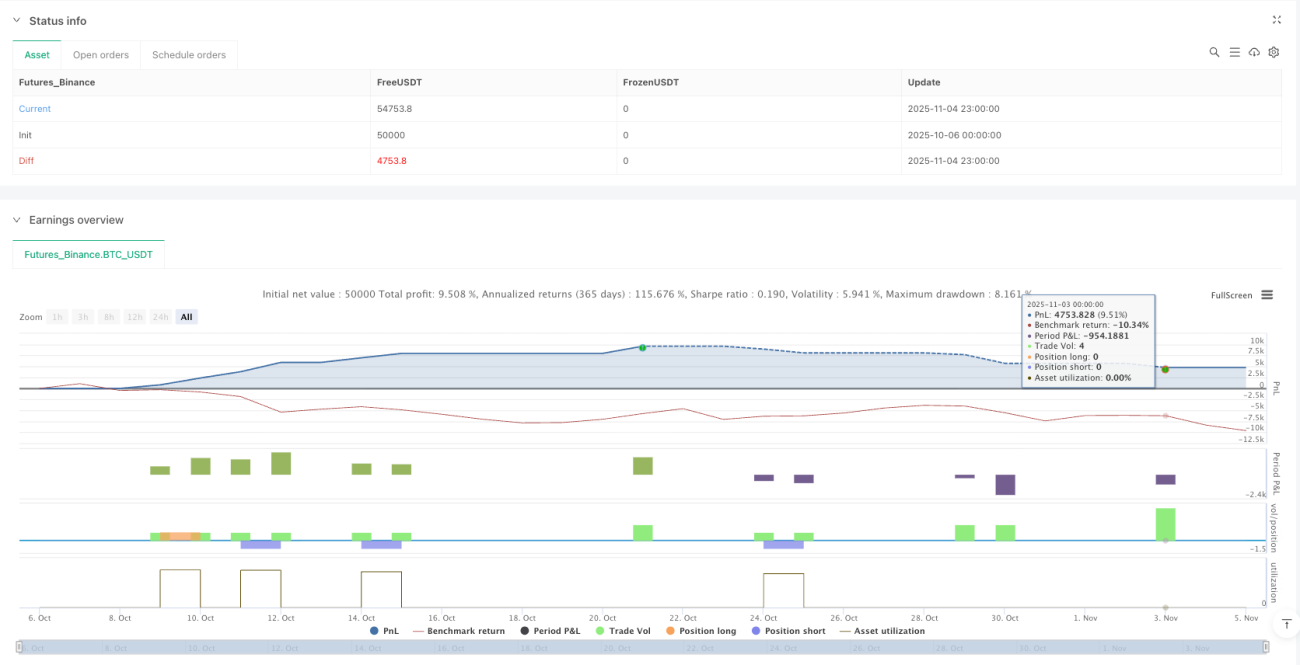
⚡ Kontrol Risiko: Rasio Emas 1:2
Panduan Menghindari Jebakan: Banyak orang bertrading seperti mengemudi tanpa sabuk pengaman, strategi ini menerapkan rasio risiko-imbal hasil 1:2 secara paksa!
- Stop loss ditempatkan 0,5 kali ATR di bawah level kunci
- Take profit adalah dua kali jarak stop loss
- Bahkan dengan tingkat kemenangan hanya 40%, dalam jangka panjang tetap bisa untung!
🚀 Tips Praktis untuk Aplikasi
Strategi ini paling cocok untuk trading emas di timeframe 15 menit, mengapa? Karena likuiditas pasar emas baik, fenomena penembusan palsu jelas, dan timeframe 15 menit menyaring banyak noise.
Ingat: Jangan serakah! Strategi sudah menemukan posisi yang baik untuk Anda, selanjutnya serahkan pada pasar dan waktu~
/*backtest
start: 2025-10-06 00:00:00
end: 2025-11-05 00:00:00
period: 1h
basePeriod: 1h
exchanges: [{"eid":"Futures_Binance","currency":"BTC_USDT"}]
*/

//@version=6
strategy("Gold 15m: Trend + S/R + Liquidity Sweep (RR 1:2)", overlay=true, default_qty_type=strategy.fixed, default_qty_value=1, commission_type=strategy.commission.percent, commission_value=0.0)

// ---------------------- INPUTS ----------------------- 1