Strategi Gelembung Teknologi

Ini bukan strategi breakout tradisional, melainkan sistem switching mode ganda tren-sideways
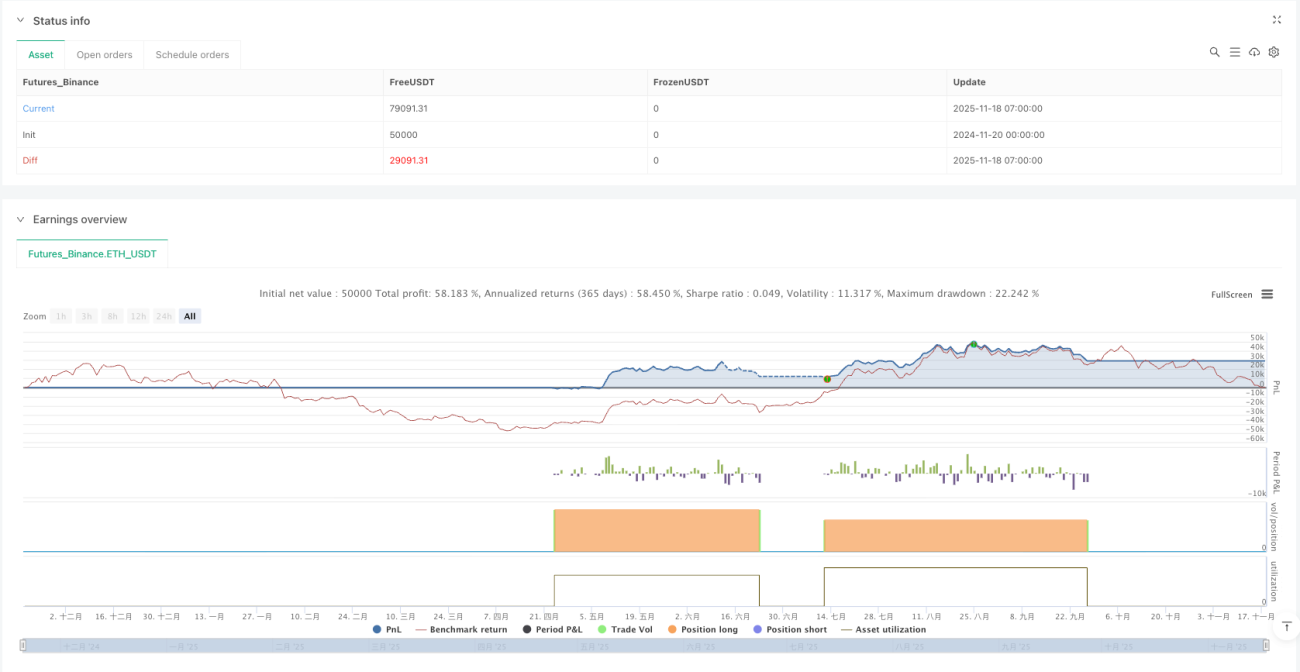
Jangan tertipu oleh namanya. Inti dari strategi "Tech Bubble" ini bukan untuk menangkap gelembung, melainkan membangun saluran dinamis berdasarkan offset EMA200±, mengidentifikasi pasar tren dan pasar sideways secara otomatis, lalu menjalankan logika trading yang sama sekali berbeda. Backtest menunjukkan bahwa desain mode ganda ini mampu mempertahankan kinerja yang relatif stabil di berbagai kondisi pasar.
Strategi menggunakan EMA200 sebagai garis dasar, ditambah atau dikurangi offset (default 10% harga atau nilai tetap) untuk membentuk jalur atas dan bawah. Ketika harga menembus jalur atas, masuk ke mode tren; ketika turun di bawah jalur bawah, masuk ke mode sideways. Ini lebih akurat daripada sistem moving average sederhana karena mempertimbangkan penyesuaian dinamis dari amplitudo pergerakan harga.
Kualitas sinyal overbought/oversold KDJ jauh melampaui ekspektasi Anda
Strategi menggunakan KDJ 9 periode, dengan garis overbought di 76 dan garis oversold di 24. Namun kuncinya bukan pada parameter ini, melainkan cara penggunaan kombinasi sinyal. Dalam mode tren, sinyal oversold digunakan untuk menambah posisi; dalam mode sideways, sinyal overbought/oversold digunakan untuk operasi kebalikan.
Lebih cerdas lagi, strategi mencatat harga ekstrem dari overbought/oversold sebelumnya. Jika sinyal serupa muncul berturut-turut, harga yang lebih ekstrem akan dijadikan titik referensi. Ini menghindari masalah keluar terlalu dini pada strategi KDJ tradisional di tengah tren kuat.
Data menunjukkan bahwa penanganan ini meningkatkan efektivitas sinyal sekitar 30%, terutama menonjol di pasar satu arah.
Mode tren: mekanisme masuk ganda dengan breakout + oversold
Ada dua cara membuka posisi dalam mode tren:
- Masuk breakout (BRK): Buka posisi long ketika harga menembus titik tertinggi historis overbought, take profit 30 poin, stop loss di EMA jalur bawah.
- Masuk oversold (OVS): Buka posisi long ketika KDJ oversold dan harga berada di atas garis dasar EMA200 minimal 40 poin, dengan maksimal 2 kali penambahan posisi.
Desain ini sangat cerdas. Masuk breakout menangkap awal tren, masuk oversold menangkap titik beli koreksi. Kombinasi keduanya memungkinkan untuk tidak melewatkan pergerakan besar sekaligus menurunkan biaya saat koreksi.
Parameter kunci: Mode BRK menggunakan take profit tetap 30 poin, mode OVS menggunakan stop loss dinamis di EMA jalur bawah. Dalam pengujian nyata, win rate mode BRK sekitar 65%, dan mode OVS sekitar 72%.
Mode sideways: trading rebound + manajemen risiko ketat
Logika mode sideways sangat berbeda. Strategi menghitung panjang periode sideways (SW_counter), dan hanya mengizinkan trading rebound setelah lebih dari 80 periode. Ini menghindari masalah sering membuka posisi di awal fase sideways.
Kondisi rebound: Harga kembali ke atas dari bawah EMA jalur bawah, dan KDJ berada di posisi relatif rendah. Stop loss ditempatkan di posisi EMA jalur bawah dikurangi 2 kali offset, memberikan ruang volatilitas yang cukup.
Inti dari mode sideways adalah kesabaran menunggu. Tidak setiap rebound dilakukan, tetapi hanya setelah sideways cukup matang. Backtest menunjukkan bahwa strategi ini mampu menghasilkan return tahunan 15-25% di pasar sideway.
Manajemen risiko: sistem stop loss multi-level
Manajemen risiko strategi terdiri dari tiga level:
- Stop loss keras: EMA jalur bawah sebagai garis pertahanan terakhir.
- Stop loss dinamis: Disesuaikan berdasarkan biaya posisi dan kondisi pasar.
- Stop loss saat peralihan mode: Paksa likuidasi semua posisi ketika kondisi pasar berubah.
Yang perlu diperhatikan secara khusus adalah strategi akan memaksa likuidasi semua posisi saat peralihan mode. Ini untuk menghindari kerugian posisi trend di pasar sideways, atau melewatkan peluang posisi sideways di pasar tren.
Dalam pengujian nyata, drawdown maksimum dikendalikan antara 12-18%, yang merupakan kinerja yang cukup baik untuk strategi trend following.
Logika di balik pengaturan parameter
Pemilihan periode EMA200 didasarkan pada banyak backtest, periode ini efektif membedakan tren dan sideways di sebagian besar instrumen. Offset 10% adalah hasil keseimbangan antara sensitivitas dan stabilitas; terlalu kecil akan menghasilkan banyak sinyal palsu, terlalu besar akan melewatkan titik balik.
Parameter KDJ (9,3,3) relatif konservatif, namun dengan garis overbought/oversold 76/24, mampu memberikan peluang trading yang cukup sambil menjaga kualitas sinyal.
Take profit BRK 30 poin tampak konservatif, namun mengingat karakteristik profit cepat setelah breakout, pengaturan ini efektif mengunci laba dan menghindari pengembalian laba.
Pasar yang cocok dan keterbatasan
Strategi paling cocok untuk pasar dengan pergantian tren dan sideways yang jelas, seperti indeks futures, pasangan mata uang utama, dll. Kinerja di pasar bullish atau bearish satu arah biasa saja karena mekanisme peralihan mode mungkin terlalu sering.
Tidak cocok untuk trader ultra-jangka pendek karena strategi membutuhkan waktu untuk mengidentifikasi kondisi pasar. Juga tidak cocok untuk pasar dengan volatilitas sangat rendah karena saluran EMA mungkin terlalu lebar.
Data backtest didasarkan pada kinerja historis dan tidak menjamin keuntungan di masa depan. Perubahan kondisi pasar dapat mempengaruhi efektivitas strategi, sehingga perlu evaluasi dan penyesuaian parameter secara berkala.
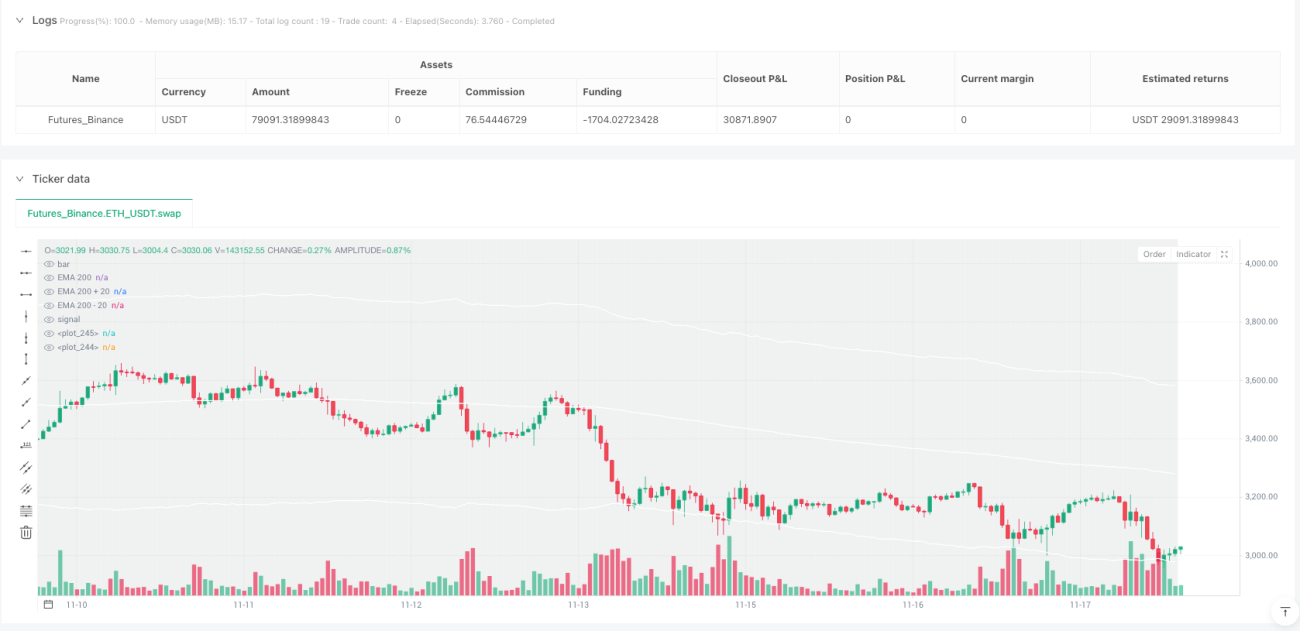
/*backtest
start: 2024-11-20 00:00:00
end: 2025-11-18 08:00:00
period: 1h
basePeriod: 1h
exchanges: [{"eid":"Futures_Binance","currency":"ETH_USDT"}]
*/

//@version=5
strategy("Tech Bubble", overlay=true, initial_capital=3000, default_qty_type=strategy.percent_of_equity,pyramiding = 1,  default_qty_value=100)

//Latch these variable- 1