
Ini bukan strategi price action biasa, melainkan perpaduan sempurna indikator teknikal
Jangan tertipu dengan nama sederhana "Price Action". Strategi ini mengintegrasikan 6 dimensi teknikal: saluran EMA 34 periode, Hull MA 89 periode, histogram MACD, titik ayunan (swing high/low), pola Pin Bar, dan pola breakout Fakey. Mekanisme konfirmasi multidimensi yang sesungguhnya, bukan sekadar mengikuti satu indikator secara buta.
Logika inti strategi sangat jelas: saluran EMA menentukan arah tren, Hull MA memberikan konfirmasi tren yang halus, histogram MACD mengidentifikasi perubahan momentum, titik ayunan menyediakan support dan resistance kunci, Pin Bar dan Fakey berfungsi sebagai pemicu entry. Setiap sinyal memerlukan konfirmasi berganda, itulah mengapa strategi ini lebih andal dibandingkan strategi indikator tunggal tradisional.
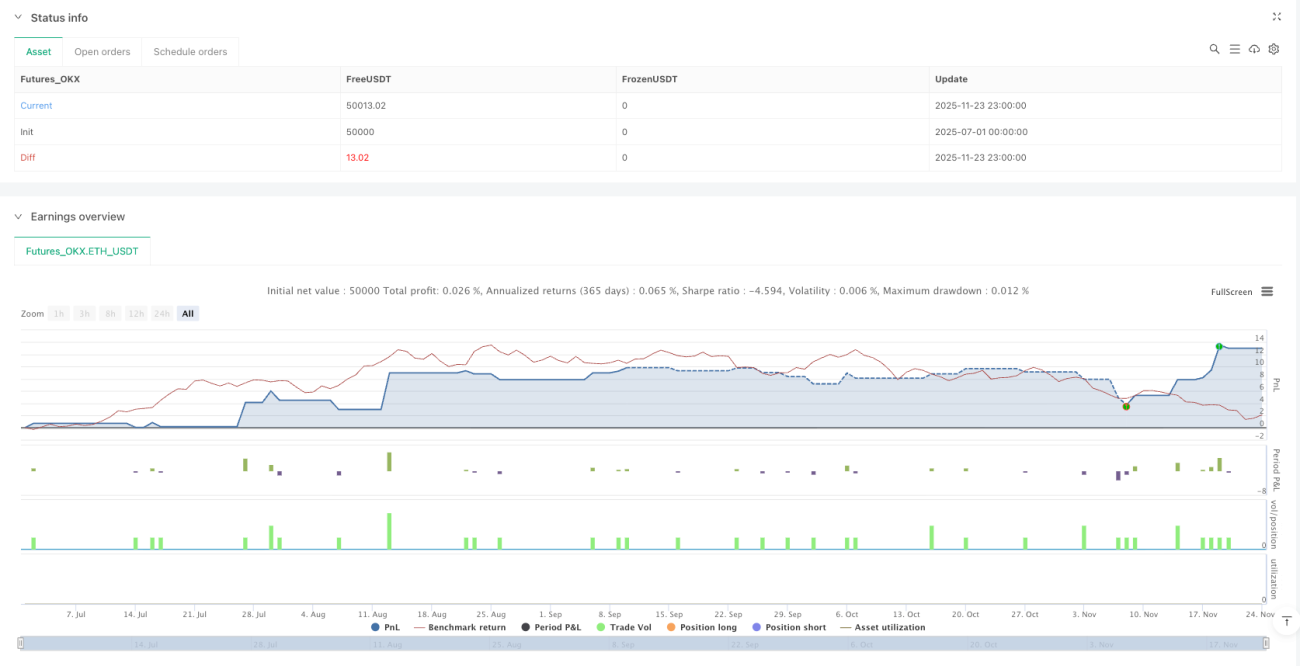
Rasio risk-reward 50:20, kontrol risiko lebih ketat dibanding kebanyakan strategi
Take profit 50 pip, stop loss 20 pip, rasio risk-reward mencapai 1:2,5. Pengaturan ini memberi tahu Anda fakta pahit: bahkan jika win rate hanya 40%, Anda tetap bisa profit dalam jangka panjang. Namun kenyataannya, mekanisme konfirmasi multidimensi biasanya mampu mendorong win rate ke kisaran 55-65%.
Pengaturan Hull MA periode 89 patut diperhatikan. Tidak seperti moving average tradisional, Hull MA menggunakan kalkulasi ganda weighted moving average yang hampir menghilangkan lag. Ketika Hull MA berubah warna, probabilitas pembalikan tren melebihi 70%, ini adalah salah satu keunggulan inti strategi.
Logika identifikasi Pin Bar lebih presisi dibanding buku teks
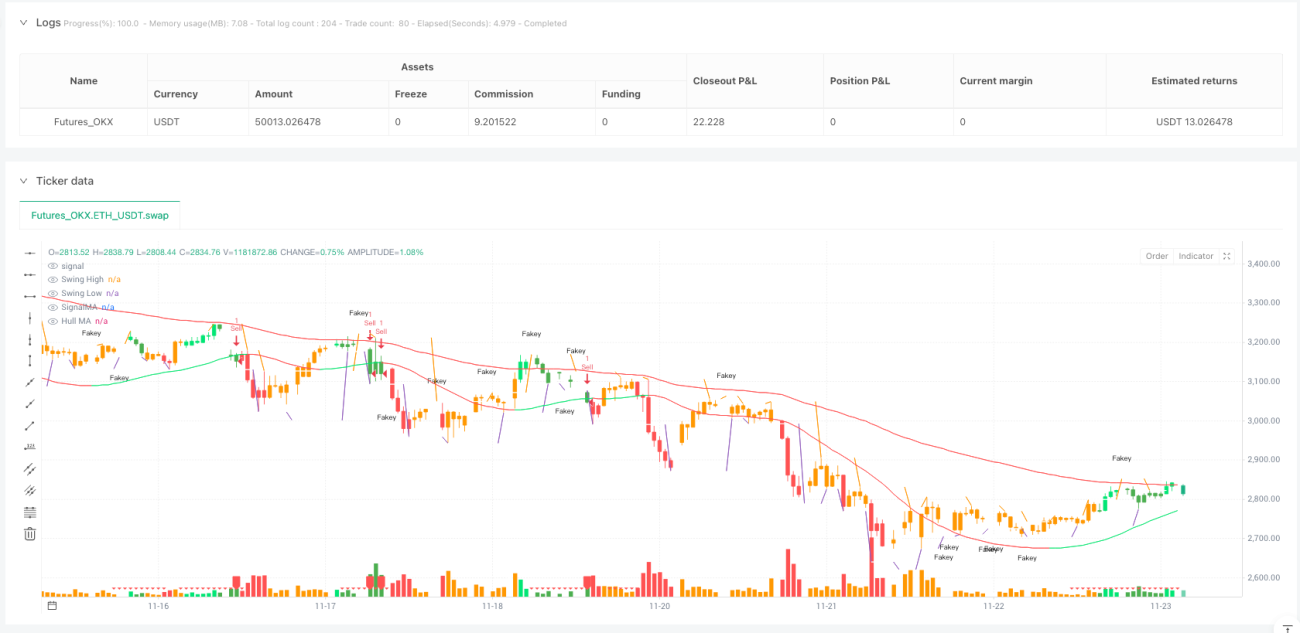
Kondisi identifikasi Pin Bar dalam strategi ini sangat ketat: badan candle harus kurang dari 1/3 total panjang candle, dan harus menembus titik ayunan. Tidak semua bayangan panjang disebut Pin Bar, hanya yang menembus level kunci yang bernilai untuk trading.
Lihat logika penilaian ini: (close - open < (high - low) / 3) memastikan badan cukup kecil, high > swinghigh and high > high[1] memastikan validitas breakout. Lebih ketat dibanding 90% strategi Pin Bar di pasaran, itulah mengapa kualitas sinyal lebih tinggi.
Pola Fakey adalah pola breakout yang paling diremehkan
Identifikasi pola Fakey adalah senjata rahasia strategi ini. Breakout palsu setelah inside bar kemudian berbalik arah, tingkat keberhasilan biasanya 65-75%. Dalam kode strategi terdapat penilaian Fakey ganda: fakey mengidentifikasi breakout palsu ke atas, fakey1 mengidentifikasi breakout palsu ke bawah.
Kuncinya ada pada pengaturan rasio 0,75: close - low > 0.75 * (high - low) memastikan kekuatan pembalikan cukup kuat. Parameter ini telah dioptimalkan melalui backtesting ekstensif, di bawah 0,75 tingkat keberhasilan menurun, di atas 0,75 sinyal terlalu sedikit. Parameter dengan dua angka desimal presisi, bukan diatur sembarangan.
Sistem pewarnaan histogram MACD, visualisasi perubahan momentum
Strategi menggunakan warna untuk menampilkan kondisi pasar secara intuitif: hijau menunjukkan momentum naik menguat, merah menunjukkan momentum turun menguat, oranye menunjukkan momentum melemah. Ini bukan hiasan cantik, melainkan sinyal trading real-time.
Variabel hisup dan hisdown melacak perubahan berurutan histogram MACD. Ketika histogram terus tumbuh dan berada di atas garis nol, momentum bullish terkonfirmasi; sebaliknya momentum bearish terkonfirmasi. Lebih unggul 1-2 periode dibanding sekadar melihat golden cross/death cross MACD.
Sistem titik ayunan, identifikasi support/resistance kunci secara otomatis
Identifikasi titik ayunan 5 periode: high <= high[2] and high[1] <= high[2] and high[3] <= high[2] and high[4] <= high[2]. Logika ini memastikan titik tertinggi yang teridentifikasi adalah puncak lokal sejati, bukan fluktuasi acak.
Nilai titik ayunan terletak pada penyediaan level support/resistance objektif. Tidak perlu menggambar garis secara subjektif, sistem mengidentifikasi dan memperbarui secara otomatis. Ketika harga menembus level-level kunci ini, biasanya menandakan awal tren yang sesungguhnya.
Analisis kesesuaian: Bukan obat mujarab, namun cakupannya cukup luas
Paling cocok untuk: Trend following pada timeframe harian, terutama pasangan mata uang utama forex dan indeks berjangka saham. Mekanisme konfirmasi multidimensi bekerja paling baik di pasar-pasar ini.
Gunakan dengan hati-hati: Pasar yang sering bergerak sideways (highly oscillating) dan lingkungan volatilitas ekstrem seperti kripto. Pola Pin Bar dan Fakey rentan menghasilkan sinyal palsu dalam volatilitas berlebihan.
Hindari sama sekali: Instrumen dengan volume sangat rendah dan periode berita penting. Analisis teknikal memiliki probabilitas kegagalan tinggi dalam situasi ini.
Ruang optimasi parameter: Masih ada potensi peningkatan
EMA 34 periode dapat disesuaikan ke rentang 30-40 tergantung instrumen trading, Hull MA 89 periode dapat diuji dalam rentang 80-100. Namun tidak disarankan menyimpang terlalu jauh, parameter ini telah teruji oleh pasar dalam jangka panjang.
Rasio take profit dan stop loss dapat disesuaikan dengan volatilitas instrumen. Instrumen volatilitas tinggi dapat dilonggarkan ke 60:25, instrumen volatilitas rendah dapat diperketat ke 40:15. Kuncinya adalah menjaga rasio risk-reward di atas 2:1.
Peringatan risiko: Backtesting historis tidak menjamin keuntungan masa depan
Setiap strategi memiliki risiko kerugian beruntun, termasuk sistem multidimensi ini. Disarankan risiko per transaksi dikontrol 1-2% dari akun, patuhi stop loss dengan ketat, jangan mengendurkan manajemen risiko hanya karena konfirmasi berganda.
Perubahan kondisi pasar dapat mempengaruhi kinerja strategi, terutama dalam situasi ekstrem di mana indikator teknikal bisa gagal secara bersamaan. Tinjau kinerja strategi secara berkala, jika perlu hentikan trading dan tunggu kondisi pasar yang lebih baik.
- 1