キーワード,文法,設定の概要
コード構造
Pineのコードは以下のように構成されています.
<version>
<declaration_statement>
<code>
コメント
FMZのPine言語でサポートされている注釈符号:単行注釈//記事の内容はこうです/* */この例の注釈の書き方は,
pine
[macdLine, signalLine, histLine] = ta.macd(close, 12, 26, 9) // 计算MACD指标
/*
plot函数在图表上画出指标线
*/
plot(macdLine, color = color.blue, title='macdLine')
plot(signalLine, color = color.orange, title='signalLine')
plot(histLine, color = color.red, title='histLine')
バージョン
次の形式のコンパイラ指令は,スクリプトがどのバージョンのPineで書かれているかをコンパイラに伝える:
            pine

            //@version=5
標準のv5バージョンは,コードで省略できます.//@version=5。
声明文
宣言文は,スクリプトの種類を決定し,これはまた,スクリプトの何が許容され,どのように使用され,実行されるかを決定します.スクリプトの重要な属性,例えば,その名前,それがグラフに追加されたときにそれがどこに現れるか,それが表示される数値の精度とフォーマット,そして,それが動作するときに特定の行動を管理する数値,例えば,それがグラフで表示される最大画質オブジェクトの数値を設定します. 策略に関しては,属性には,初期資本,手数料,滑り点などの回帰制御のパラメータが含まれます.indicator()またはstrategy()声明の文言
コード
スクリプトの注釈やコンパイラ命令の行は文ではなく,スクリプトのアルゴリズムを実装する文である。文は,これらの内容のいずれかである。
文は様々な方法で並べられます
- 一つの行で表現できる文もあります.例えば,ほとんどの変数宣言は,関数呼び出しの1つの行のみを含む,または単行関数宣言である.他のものは,構造のように,局所的なブロックを必要とするため,常に複数の行が必要です.
- スクリプトの全局的な文言 (つまり,局部的なブロックに属していない部分) は,
空格または制表符(tab鍵) 開始。その最初の文字もその行の最初の文字でなければならない。行の最初の位置で始まる行は,定義によりスクリプトの全域の一部となる。 - 構造または多行関数宣言には常に
local block。 ローカルブロックは表記符または4つの空白に縮小されなければなりません。 そうでなければ,前行の連続コードとして解析され,つまり前行のコードの連続内容として判断されます。 各ローカルブロックは異なるローカル範囲を定義します。 - 多数の単行文は,割り切符としてコマ ((,) を使って一行に並べることができる.
- 文字列は,文字列に注釈を入れてもいいし,注釈だけでもいい.
- 列を包み込むこともできます (複数行で続きます)
例えば,以下のコードで if 構造を使用する3つの局所ブロック,すなわち,自定義関数声明で1つ,変数声明で2つを含む.
            pine

            indicator("", "", true)             // 声明语句(全局范围),可以省略不写

barIsUp() =>                        // 函数声明(全局范围)
    close > open                    // 本地块(本地范围)

plotColor = if barIsUp()            // 变量声明 (全局范围)
    color.green                     // 本地块 (本地范围)
else
    color.red                       // 本地块 (本地范围)

runtime.log("color", color = plotColor)  // 调用一个内置函数输出日志 (全局范围)
コードを入れ替える
長行は複数の行に分割され,または"包み"上げることができる.包み込まれた行は,4の倍数でない限り,任意の数の空間に収縮しなければならない (これらの境界は局部ブロックに収縮するために使用される).
            pine

            a = open + high + low + close
包装できるのは (注:各行に縮小する空白の数は4の倍数ではない):
            pine

            a = open +
      high +
          low +
             close
長いplot ((() の呼び出しは,
            pine

            close1 = request.security(syminfo.tickerid, "D", close)      // syminfo.tickerid 当前交易对的日线级别收盘价数据系列
close2 = request.security(syminfo.tickerid, "240", close)    // syminfo.tickerid 当前交易对的240分钟级别收盘价数据系列
plot(ta.correlation(close, open, 100),                       // 一行长的plot()调用可以被包装
   color = color.new(color.purple, 40),
   style = plot.style_area,
   trackprice = true)
ユーザ定義の関数声明の文も包装できる。しかし,局部ブロックは文法的に縮小で始めなければならないので,次の行に分割すると,文の継続部分は1つ以上の縮小で始めなければならない (例えば:
            pine

            test(c, o) =>
    ret = c > o ?
       (c > o+5000 ?
          1 :
              0):
       (c < o-5000 ?
          -1 :
              0)

a = test(close, open)
plot(a, title="a")
タイムライン
時間序列はデータ型やフォーマットではなく,PINE言語の基本的な構造の概念である.時間的に連続して変化する値を保存するために用いられ,各値は時間点に対応する.時間序列という概念の構造は,時間とともに変化する一連のデータを処理し,記録するのに適している.
変数を組み込むopen例えばopen組み込み変数は,K線BARの開盤値を記録します.openこれは,K線周期の5分のデータです.open変数に記録されるのは,K行BAR (コラム) の5分毎の開拓価格です. 戦略プログラムが実行される時に,コードで引用されます.openK 線 BAR の開盤値を引用する. タイムシーケンスの前値 (過去値) を引用するために,[]歴史操作は,K行BARで策略が実行されたときに,open[1]これは,現在の K 線 BAR の前 K 線 BAR の開場価格を引用するということです.
しかし,タイムラインこの"数列"というデータ構造は,PINE言語にも数列型があります。しかし,それらは時間序列とは全く異なる概念です。
PINE言語は,このような時間序列を設計し,策略コードで簡単に閉店価格の累積値を計算できます.forのような循環構造を使用する必要はありません.PINE言語の内置関数のみを使用します.ta.cum(close)また別の例として,最後の14K行BAR (つまりコード実行時点から現在の時点までの14K行BAR) の最大値と最小値の差の平均値を計算する必要がある.ta.sma(high - low, 14)
タイムライン上で関数を呼び出す結果もタイムライン上で痕跡を残します.[]歴史演算子は引用前の値である.例えば,現在のK行BARの閉算値が最後の10のK行BARの最高値の最大値を超えているかどうかをテストする (現在のK行BARを除く).breach = close > ta.highest(close, 10)[1]書き換えるとbreach = close > ta.highest(close[1], 10)だからta.highest(close, 10)[1]そしてta.highest(close[1], 10)価値のあるものです
このコードで確認できます.
            pine

            strategy("test pine", "test", true)

a = ta.highest(close, 10)[1]
b = ta.highest(close[1], 10)

plotchar(true, title="a", char=str.tostring(a), location=location.abovebar, color=color.red)
plotchar(true, title="b", char=str.tostring(b), location=location.belowbar, color=color.green)
上記のテストコードは,aとbをそれぞれのBAR上で,それぞれの時間序列上の値を出力し,aとbの値が常に等しいことがわかるので,この2つの表現方法は等価である.
歴史データ引用 (history-referencing)
Trading Viewでは,過去データ引用の最大項数制限 (最大5000項) があります.例えば,以下のコード:
            pine

            //@version=6
indicator("test")

ema = ta.ema(close, 10000)      // 报错:Error on bar 0: The 'ema'->'sum' function references too many historical candles (10000), the limit is 5000.
plot(ema, "ema")

// pre10000 = ema[10000]        // 报错:Invalid number of bars back specified in the history-referencing operator. It accepts a value between 0 and 5000.
// plot(pre10000, "pre10000")
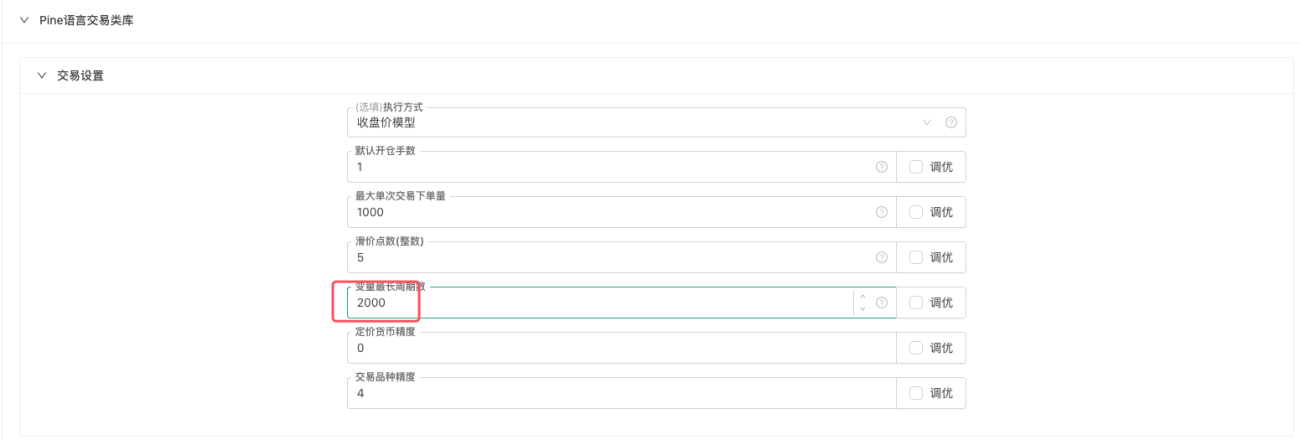
FMZ上でPINE言語策略を使用する"Pine言語取引類別庫"の"取引設定"",変数の最長周期数"のパラメータは,具体的には参照可能なデータの最大項数を設定する.
            pine

            indicator("test")

ema = ta.ema(close, 1000)  // ema = ta.ema(close, 3000) 则报错:Invalid number 3000 of bars back specified in the history-referencing operator. It accepts a value between 0 and 2000.
plot(ema, "ema")
"変数の最長周期数"のパラメータは,大きすぎないように設定し,適切な策略でデータ引用の範囲を指定できます.
Pine 言語の取引クラスデータベースのモジュールパラメータ
PINE策略の内蔵テンプレート"Pine言語取引クラスライブラリ"のパラメータ設定説明書。
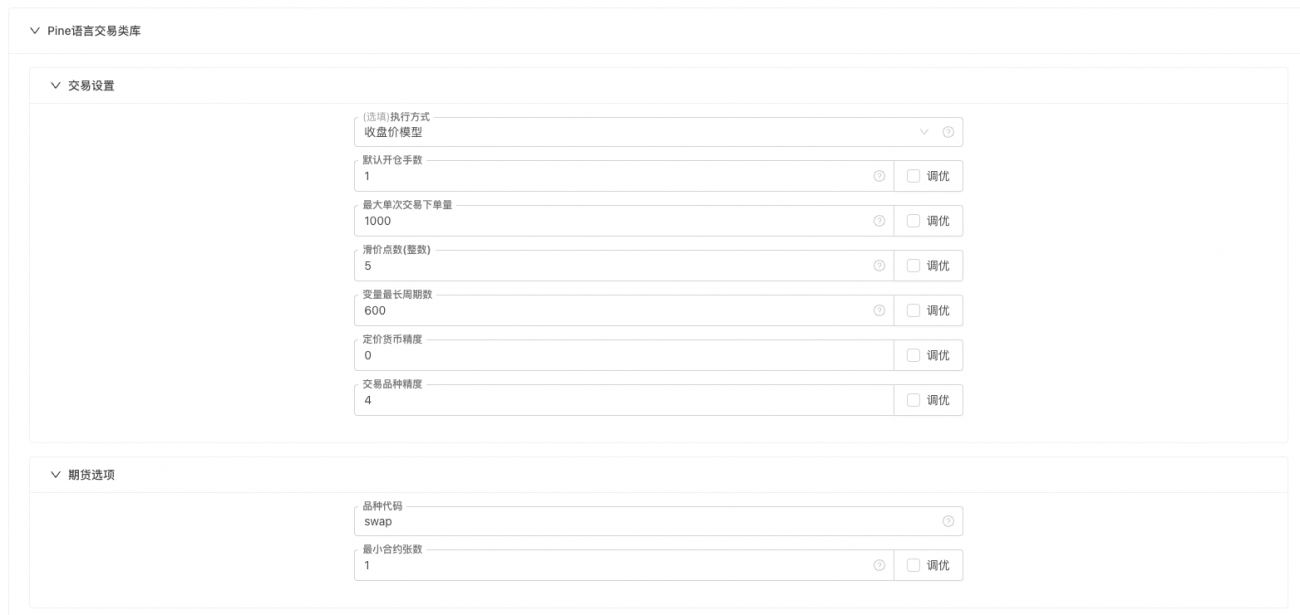
取引設定
- 実行
閉店価格モデル:現在のBARが終了した後にモデルを実行し,下根BARが開始されたときに取引を実行する.
リアルタイム価格モデル:価格の変化ごとにモデルを実行し,信号があれば即座に取引を実行する. - デフォルトの開設手数:取引指令が取引数を指定しない場合,その設定の量に従って取引を実行する.
- 最大単一取引下の単数:実際の上場に応じて,このパラメータの設定と組み合わせて,各下場の最大数値を決定し,上場面を衝撃から避ける.
- 価格変動のポイント:
定价货币精度参数とこの参数で,下令時に滑走価格を決定する。例えば,定価通貨精度設定は2,つまり小数点の2位まで正確で,0.01まで正確である。そのとき,滑走価格の各点数は0.01の定価単位を表している。このとき,滑走価格の設定は5で,下令時に滑走価格は0.05である。滑走価格は下令時に,より良いため,開口注文を交付した際の溢れ出た価格の一部を指している。 - 変数の最長周期数: グラフに影響するK線BARの数,および
javascript策略内の呼び出しSetMaxBarLen機能は同じである.
先物オプション
- 品種コード:契約コード,取引所オブジェクトが非現貨取引所オブジェクトである場合に設定する必要があります.
- 最低契約書数:注文時に契約の最小取引量.
リアルオプション
- 自動復元進捗:前回の戦略停止前の状態に自動復元する.
- 下の注文再試行回数:注文が取引されず,注文を取り消し,再注文を試みる取引.このパラメータは,最大再試行回数を制限するために使用される。
- ネットワークアンケート間隔 ((ミリ秒):REST プロトコルにのみ有効で,ネットワーク要求の間隔を制御し,要求が頻度が高くなり,取引所の制限を超えないようにする.
- アカウント同期時間 ((秒):同期アカウントデータの時間周期。
- ポジション開設後のポジション同期時間 ((ミリ秒):一部の取引所のデータ遅延による繰り返し開設に限って,同期時間を大きく設定することで,このような問題を緩和できます。
- <unk>倍数:<unk>倍数を設定する.
現金取引,その他の設定
- 一手取引量: 既定の一手取引量で,現金でのみ有効.
- 最小取引量: 最小取引量
- 価格の精度:価格の精度,つまり価格の小数点.
- 取引品種の精度:次注文の精度,つまり次注文の小数値.
- 手数料:この設定に基づいていくつかのデータで計算すると,0.002は千分の2を指します.
- 損益統計の間隔: 損益統計は実体ディスクのみで表示する.
- 再試行失敗 ((ミリ秒):ネットワーク要求が失敗した際の再試行間隔.
- REST プロトコルのみで有効.
- 常見ネットワークエラーを隠す: 常見エラーをログに隠す.
- REST プロトコルのみで有効である.
- フォローアップの通知: メールのフォローアップなど
注文する
ポジション開設
            pine

            strategy(title = "open long example", pyramiding = 3)                                // pyramiding 允许的同方向下单的次数
strategy.entry("long1", strategy.long, 0.01)                                         // 市价开多仓,指定分组标签为long1
strategy.entry("long2", strategy.long, 0.02, when = close > ta.ema(close, 10))       // 条件触发,执行下单,市价开多仓
strategy.entry("long3", strategy.long, 0.03, limit = 30000)                          // 指定(较低的)价格,计划下买单订单,等待成交开仓,限价开仓
平仓
            pine

            strategy(title = "close long example", pyramiding = 2)                              // pyramiding 允许的同方向下单的次数
strategy.entry("long1", strategy.long, 0.1)                                         // 市价开多仓,指定分组标签为long1
strategy.entry("long2", strategy.long, 0.1)                                         // 市价开多仓,指定分组标签为long2
strategy.close("long1", when = strategy.position_size > 0.1, qty_percent = 50, comment = "close buy entry for 50%")   // 平仓,指定平掉分组标签为long1的仓位的50%持仓
strategy.close("long2", when = strategy.position_size > 0.1, qty_percent = 80, comment = "close buy entry for 80%")   // 平仓,指定平掉分组标签为long2的仓位的80%持仓
取引メカニズム
PINE言語のポジション保持メカニズムは,一方向のポジション保持に似ています.例えば,多頭方向のポジションを保有するときに (多頭ポジション),取引の注文,計画書などがある場合 (ポジション保持方向に対して逆方向の) 注文をトリガー実行すると,最初に多頭方向のポジションを平坦化して (すべての多頭ポジションを平坦化して),次にトリガーされた (ポジション保持方向に対して逆方向の) 注文を実行します.
計画書
注文指示を使用すると,価格が指定されていない場合,市場価格がデフォルトになります. 市場価格に加えて,計画表で注文することもできます. 計画表は,直ちに注文を操作しません. 計画表は,トリガー時にプログラムが存在しない計画委託のキューブで,試聴するタイムステータス情報 (つまり,戦略が実行される時のステータス<unk>) の"計画注文"表のページ分にご覧いただけます。市場リアルタイム価格が条件を満たすときにこれらの計画単語をトリガーするときにシステムが実際に注文します。したがって,これらの注文は取引価格にわずかな偏差があることは正常な状況です。使用strategy.entryこの関数は,関数で定義されます.limit、stopパラメータ
            var isTrade = false
if not barstate.ishistory and not isTrade
    isTrade := true
    strategy.entry("test 1", strategy.long, 0.1, stop=close*1.3, comment="test 1 order")                     // stop
    strategy.entry("test 2", strategy.long, 0.2, limit=close*0.7, comment="test 2 order")                    // limit
    strategy.entry("test 3", strategy.short, 0.3, stop=close*0.6, limit=close*1.4, comment="test 3 order")   // stop-limit
-
制限注文
オーダーが"購入"の値である場合 (つまり,
directionパラメータはstrategy.long),当時の市場価格が価格より低い場合にのみ,注文がトリガーされます.
オーダーが売り切れた場合 (つまりdirectionパラメータはstrategy.short),当時の市場価格が価格より高い場合にのみ,注文がトリガーされます. -
停止命令
注文のストップ損失価格を設定し,注文が買取の場合,現在の市場価格が価格より高い場合にのみ,注文がトリガーされます.
注文が売り物である場合,現在の市場価格が価格より低い場合にのみ,注文がトリガーされます. -
ストップ・リミット
設定できます.
limit、stopパラメータは,注文が最初に条件を満たす価格でトリガーされます.
権利の割合
            pine

            //@version=5
strategy("Percent of Equity Order", overlay=true, default_qty_type=strategy.percent_of_equity, default_qty_value=100)

// 简单的均线交叉策略
longCondition = ta.crossover(ta.sma(close, 14), ta.sma(close, 28))
shortCondition = ta.crossunder(ta.sma(close, 14), ta.sma(close, 28))

// 如果均线交叉条件满足,则买入或卖出
if (longCondition)
    strategy.entry("Long", strategy.long)

if (shortCondition)
    strategy.entry("Short", strategy.short)
指定するdefault_qty_type=strategy.percent_of_equity設定するdefault_qty_valueパーセント数として ((0~100),1は1%。 口座の計価通貨数に従って下單の計算。 例えば:現在の口座には10000USDTがあり,1%の下單を設定,つまり100USDT規模の下單の注文を使用する。 (販売時に現在の価格に基づいて計算) ・・・
宣言,論理構造のキーワード
var
varは,分配と一次初期化変数のキーワードである.
通常,キーワード var を含まない変数代入文法により,データ更新ごとに変数の値が覆われる.対照的に,キーワード var を使って変数を代入すると,データ更新にもかかわらず,状態を保持し,if-expressions の条件を満たす場合にのみ変更される.
var variable_name = expression
解説:
variable_name- Pine Script で許可されているユーザー変数の名前 ((は,大文字と小文字のラテン文字,数字と下線を含むことができる)_),しかし数字で始められない) 。expression- 任意の算術表現は,通常の変数を定義するように. 表現を計算し,変数に1回割り当てます.
例として
            pine

            // Var keyword example
var a = close
var b = 0.0
var c = 0.0
var green_bars_count = 0
if close > open
    var x = close
    b := x
    green_bars_count := green_bars_count + 1
    if green_bars_count >= 10
        var y = close
        c := y
plot(a, title = "a")
plot(b, title = "b")
plot(c, title = "c")
変数 'a' は,列内の各柱の第1柱の終値を維持する.
変数 'b' は,シリーズで最初の<unk>緑色の<unk>の値棒の終値を維持する.
変数 'c' は,シリーズ第10の<unk>緑の<unk>の終盤価格を維持している.
FMZでは,リアルタイム価格モデルとクローズアップ価格モデルに分けられます.var、varip声明の変数は以下のコードでテストします.
            pine

            strategy("test pine", "test 1", true)

// 测试 var varip
var i = 0
varip ii = 0

// 将策略逻辑每轮改变的i、ii打印在图上
plotchar(true, title="ii", char=str.tostring(ii), location=location.abovebar, color=color.red)
plotchar(true, title="i", char=str.tostring(i), location=location.belowbar, color=color.green)

// 每轮逻辑执行都给i、ii递增1
if true
    i := i + 1
    ii := ii + 1
-
リアルタイム価格モデル
上記のテストコードは,実行時に2段階に分けられます: 1 历史K線段階 ◎ 2 リアルK線段階 ◎ リアルタイム価格モデル,歴史K線段階では,var、varip声明の変数i,iiは,策略コードの実行毎に増加操作を実行します.if trueだから必ず対応する条件コードブロックを実行する) 。 だから,反測結果K線BARに表示される数字はそれぞれ1ずつ増加しているのが見えます。 歴史K線段階が終了すると,リアルタイムK線段階が始まります。var、varip声明の変数は異なる変化を始める. リアルタイム価格モデルであるため,K線BAR内の価格の変化ごとに戦略コードが実行され,i := i + 1そしてii := ii + 1すべては1回実行する。違いは,iiが毎回修正する。iは毎回修正するものの,次の実行回では,策略論理が実行されたときに以前の値が復元され,現在のK行BARが終了するまで,iの値を更新して決定する (すなわち,次の実行回では,策略論理が実行されたときに以前の値が復元されない).したがって,iの変数は,iが1つずつ増加していることがわかります。しかし,iiの変数は,BARごとに数回累積する。 -
終値モデル
閉じる価格モデルは,K線BARが終了するたびに戦略論理を実行する.したがって,閉じる価格モデルでは,歴史的K線段階とリアルタイムK線段階は,var、varip宣言の変数は,上記の例で増加表現が完全に一致しており,すべては,各 K 行 BAR 増加 1 。
varip
varip ((var intrabar persist) は,分配および単発初期化変数用のキーワードである。それはvarキーワードに似ているが,varip宣言を使用した変数は,リアルタイムK行更新の間にその値を保持する。
varip variable_name = expression
解説:
variable_name- Pineスクリプトで許可されているユーザ変数の名前 (英語) は,大文字と小文字のラテン文字,数字と下書きを含むことができる._),しかし数字で始められない) 。expression- 任意の算術式は,通常の変数を定義する時のように。最初のK行では,式は1回だけ計算され,変数に1回だけ割り振られます。
例として
            pine

            // varip
varip int v = -1
v := v + 1
plot(v)
varを使用すると,図はbar_indexの値を返します。 varpを使用すると,歴史のK線で同じ動作が起こりますが,リアルタイムのK線で,図は1つの値を返します. この値は,各 tick に対して1を増加します。
注記
float,int,bool,stringなどの単純な型と,これらの型の配列としか使用できません。
true
バール型変数の値を表す,または式で使う比較するまたはロジックオペレーターで計算できる値
注記
参照比較する演算子とロジックオペレーターの説明
続きを見る
bool
false
ブル型変数の値を表示し,比較操作,論理操作の結果を表示する.
注記
参照比較する演算子とロジックオペレーターの説明
続きを見る
bool
if
if文は,表現条件を満たすときに実行しなければならない文ブロックを定義する.Pineスクリプト言語の第4版では,<unk>else if<unk>文法を使用することができます.
共有コードは以下の通りです.
            var_declarationX = if condition
    var_decl_then0
    var_decl_then1
    ...
    var_decl_thenN
    return_expression_then
else if [optional block]
    var_decl_else0
    var_decl_else1
    ...
    var_decl_elseN
    return_expression_else
else
    var_decl_else0
    var_decl_else1
    ...
    var_decl_elseN
    return_expression_else
注記
var_declarationX- この変数はif文の値を取得します.
condition- 条件がtrueなら,文塊を使用するthen論理的にvar_decl_then0,var_decl_then1条件が false ならば,文塊を使用します.else ifまたはelse論理的にvar_decl_else0,var_decl_else1(笑)
return_expression_then , return_expression_else- モジュール内の最後の式またはブロックelseからの式は,文の最終値を返します。変数の宣言が最後にある場合,その値は結果値になります。
if 文の返される値の種類は,return_expression_thenそしてreturn_expression_elseタイプ。TradingViewで実行するときは,それらのタイプがマッチしなければならない:elseブロックに文字列値がある場合,then文ブロックから整数値を返すことは不可能。FMZで実行する場合は,次の例は誤差をなくし,y値が"open"と取られたとき,プロットグラフの値はn/a。
例として
            pine

            // This code compiles
x = if close > open
    close
else
    open

// This code doesn’t compile by trading view
// y = if close > open
//     close
// else
//     "open"
plot(x)
省略するelseブロック。この場合,条件がfalseである場合,var_declarationX変数に<unk>empty<unk>値 ((na,falseまたは<unk>) を割り当てます):
例として
            pine

            // if
x = if close > open
    close
// If current close > current open, then x = close.
// Otherwise the x = na.
plot(x)
複数の<unk>else if<unk>を使用するか,全く使用しないこともできます.<unk>then<unk>,<unk>else if<unk>,<unk>else<unk>のブロックは4つの空白に移動されます:
例として
            pine

            // if
x = if open > close
    5
else if high > low
    close
else
    open
plot(x)
無視できるif文の結果値 ((<unk>var_declarationX=<unk>は省略できます) ⇒ 文の副作用が必要な場合,例えば,戦略取引において有用である可能性があります.
例として
            pine

            if (ta.crossover(high, low))
    strategy.entry("BBandLE", strategy.long, stop=low)
else
    strategy.cancel(id="BBandLE")
if 文は,次のとおりに相互に包含される:
例として
            pine

            // if
float x = na
if close > open
    if close > close[1]
        x := close
    else
        x := close[1]
else
    x := open
plot(x)
for
forの構造は,複数の文を繰り返し実行することを許します.
            [var_declaration =] for counter = from_num to to_num [by step_num]
    statements | continue | break
    return_expression
var_declaration- 選択可能な変数声明で,返回回線の return_expression の値として指定されます.
counter- 回転数値の変数を保存し,回転の各エピデーションで1または step_numの値を増加/減少する.
from_num- カウンタの初期値。 <unk>series int/float <unk>値/式の使用が許可されている。
to_num- カウンタの最終値。 カウンタがto_numより大きいとき (またはfrom_num > to_numの場合にto_numより小さいとき) ループが中断されます。 <unk>series int/float <unk>値/式を使用することが許可されていますが,それらはループの最初の<unk>代時にのみ評価されます。
step_num- カウンタの増加/減少値。 選択可能な。 既定値は+1または-1, from_numまたはto_numの最大値による。 値を使用すると,カウンタはfrom_numまたはto_numの最大値に基づいて増加/減少するので,step_numの+/-符号は選択可能な。
statements | continue | break- 任意の数の文,または'continue'または'break'キーワードを4つの空白または1つのタブに縮小します.
return_expression- ループの返される値は,存在すると,var_declaration内の変数に割り当てられます。 ループが<unk>continue<unk>または<unk>break<unk>のキーワードのために退出した場合,ループの返される値は,ループが退出する前に割り当てられた最後の変数の返される値になります。
continue- 回転の次の代数が実行されるため,回転の回転の中でのみ使用できるキーワード
break返信するキーワードは "退出する"
例として
            pine

            // Here, we count the quantity of bars in a given 'lookback' length which closed above the current bar's close
qtyOfHigherCloses(lookback) =>
    int result = 0
    for i = 1 to lookback
        if close[i] > close
            result += 1
    result
plot(qtyOfHigherCloses(14))
for...in
for...in構造は,配列の各要素に対して複数の文を繰り返し実行することを許可する. これは任意の参数と使用できます:array_element, または 2 つのパラメータと一緒に使用します.[index, array_element]┃ 第二の形式は回路の機能に影響しない。 それは元組の最初の変数における現在の代数のインデックスを追跡する。
            [var_declaration =] for array_element in array_id
    statements | continue | break
    return_expression

[var_declaration =] for [index, array_element] in array_id
    statements | continue | break
    return_expression
var_declaration変数の定義は1つの変数で,return_expression値について
index- 現在の代数インデックスの選択変数を追跡する. 索引は0から始まる. 変数は循環体内で不変である. 使用される場合,それは1つに含まれなければならない.array_elementグループで
array_element- ループで処理される各連続配列要素の変数を含みます. この変数はループ体では変化しません.
array_id- 回転円の代数の配列ID。
statements | continue | break- 任意の数の文,または'continue'または'break'キーワードを4つの空白または1つのタブに縮小します.
return_expressionループの返り値は,var_declaration中にある変数,存在する場合. ループが'continue'または'break'キーワードのために退出した場合,ループの返される値は,ループが退出する前の最後の代入された変数である.
continue- 回転の次の代数が実行されるため,回転の回転の中でのみ使用できるキーワード
break返信するキーワードは "退出する"
ループ内で配列の要素またはその大きさを修正することが許可されます.
この例では,for...in単項式は,各K線で,K線のOHLC値が 'close' 値のSMAより大きい数値を決定します.
例として
            pine

            // Here we determine on each bar how many of the bar's OHLC values are greater than the SMA of 'close' values
float[] ohlcValues = array.from(open, high, low, close)
qtyGreaterThan(value, array) =>
    int result = 0
    for currentElement in array
        if currentElement > value
            result += 1
        result
plot(qtyGreaterThan(ta.sma(close, 20), ohlcValues))
この2つのパラメータを for...in で表します.isPos配列の値が になります.true敵が我々を攻撃する時valuesArray配列内の対応値は正時である:
例として
            pine

            // for...in
var valuesArray = array.from(4, -8, 11, 78, -16, 34, 7, 99, 0, 55)
var isPos = array.new_bool(10, false)

for [index, value] in valuesArray
    if value > 0
        array.set(isPos, index, true)

if barstate.islastconfirmedhistory
    runtime.log(str.tostring(isPos))
続きを見る
for while array.sum array.min array.max
while
while文は,ローカルコードブロックの条件代入を許可する.
            variable_declaration = while boolean_expression
    ...
    continue
    ...
    break
    ...
    return_expression
解説:
variable_declaration- 選択可能な変数宣言return expressionこの変数に対して初期化値を指定できます.
boolean_expression- 実行するwhile文の本部部分. false ならば,while文を書き終えた後,脚本を実行する.
continue - continueキーワードは次の代入に循環を分岐させます.
break - breakキーワードがループを終了させる.while文の後に復元する.
return_expression- 提供するwhile任意の行で文が返される.
例として
            pine

            // This is a simple example of calculating a factorial using a while loop.
int i_n = input.int(10, "Factorial Size", minval=0)
int counter   = i_n
int factorial = 1
while counter > 0
    factorial := factorial * counter
    counter   := counter - 1

plot(factorial)
注記
スタートwhileローカルコードのブロックは4つの空白または1つの表記符に縮小されなければなりません. 終了します.while循環するwhile実行される必要があります. 実行される必要があります.break。
switch
switch オペレーターは,条件と表現の値に応じて,コントロールをいくつかの文の1つに移します.
            [variable_declaration = ] switch expression
    value1 => local_block
    value2 => local_block
    ...
    => default_local_block

[variable_declaration = ] switch
    boolean_expression1 => local_block
    boolean_expression2 => local_block
    ...
    => default_local_block
"switch"という表現で表される:
例として
            pine

            // Switch using an expression

string i_maType = input.string("EMA", "MA type", options = ["EMA", "SMA", "RMA", "WMA"])

float ma = switch i_maType
    "EMA" => ta.ema(close, 10)
    "SMA" => ta.sma(close, 10)
    "RMA" => ta.rma(close, 10)
    // Default used when the three first cases do not match.
    => ta.wma(close, 10)

plot(ma)
表現のないswitch:
例として
            pine

            strategy("Switch without an expression", overlay = true)

bool longCondition  = ta.crossover( ta.sma(close, 14), ta.sma(close, 28))
bool shortCondition = ta.crossunder(ta.sma(close, 14), ta.sma(close, 28))

switch
    longCondition  => strategy.entry("Long ID", strategy.long)
    shortCondition => strategy.entry("Short ID", strategy.short)
返される値
実行されるローカルステートメントブロックの最後の式の値。
注記
実行するだけlocal_block例として,default_local_block"つ目はdefault_local_block単に=>標識は一緒に導入され,前のブロックが実行されていない場合にのみ実行されます.switch文の結果は変数に割り当てられ,指定されていません.default_local_block実行されない場合local_block返される.naありがとうございました.switch変数に代入すると,すべてのlocal_blockこの例は,同じタイプの値を返さなければなりません.
series
seriesは,データシリーズのタイプを表すキーワードである. 明確に使用する.seriesキーワードは通常不要です.
オペレーター
=
変数に値を与えるのに用いられるが,変数を宣言するときにのみ用いられる.
:=
代入演算子,左側の変数に代入する. 前述の変数に代入する.
!=
任意の種類の表現に適用される.
expr1 != expr2
返される値
ブール値,またはブール値の連鎖
%
模数 ((整数余数) 。数値表現に適用する。
expr1 % expr2
返される値
整数または浮動点値,または一連の値.
注記
パイン・スクリプトでは,整数の余剰を計算するとき,商は切断される。すなわち,最小絶対値に四辺五入する。得られた価値は,配当と同じ符号を持つ。
例:-1 % 9 = -1 - 9 * truncate ((-1/9) = -1 - 9 * truncate ((-0.111) = -1 - 9 * 0 = -1。
%=
モジュール指令。数値表現に適用する。
expr1 %= expr2
例として
            pine

            // Equals to expr1 = expr1 % expr2.
a = 3
b = 3
a %= b
// Result: a = 0.
plot(a)
返される値
整数または浮動点値,または一連の値.
*
掛法。数値表現に適用する。
expr1 * expr2
返される値
整数または浮動点値,または一連の値.
*=
乘法指令。数値表現に適用する。
expr1 *= expr2
例として
            pine

            // Equals to expr1 = expr1 * expr2.
a = 2
b = 3
a *= b
// Result: a = 6.
plot(a)
返される値
整数または浮動点値,または一連の値.
+
添付または正元である。数値表現または文字列に適用される。
expr1 + expr2
+ expr
返される値
文字列の二進制+"expr1"と"expr2"の組み合わせを返します.
数字は整数または浮点値を返します.
二進法'+'はexpr1+expr2を返します.
1元<unk>+<unk>はexpr ((1元演算子の対称性には何も追加しない) を返します.
注記
数値付き算術演算子や変数列を使用できます. 列を使用する場合は,演算子は要素に適用されます.
+=
加法指定。数値表現または文字列に適用。
expr1 += expr2
例として
            pine

            // Equals to expr1 = expr1 + expr2.
a = 2
b = 3
a += b
// Result: a = 5.
plot(a)
返される値
文字列の場合,expr1とexpr2の並列を返します. 数値の場合,整数または浮点値を返します.
注記
数値付き算術演算子や変数列を使用できます. 列を使用する場合は,演算子は要素に適用されます.
-
減算法または一元負号。数値表現に適用する。
expr1 - expr2
- expr
返される値
整数または浮点値,または一連の値を返します.
二進法'+'は,expr1 減 express2 を返します.
1 ドル-expr の否定式を返します.
注記
数値付き算術演算子や変数列を使用できます. 列を使用する場合は,演算子は要素に適用されます.
-=
減法指定。数値表現に適用。
expr1 -= expr2
例として
            pine

            // Equals to expr1 = expr1 - expr2.
a = 2
b = 3
a -= b
// Result: a = -1.
plot(a)
返される値
整数または浮動点値,または一連の値.
/
除法 〔数字式に適用する〕
expr1 / expr2
返される値
整数または浮動点値,または一連の値.
/=
除法指令。数値表現に適用。
expr1 /= expr2
例として
            pine

            // Equals to expr1 = expr1 / expr2.
a = 3
b = 3
a /= b
// Result: a = 1.
plot(a)
返される値
整数または浮動点値,または一連の値.
<
小さい. 数値表現に適用する.
expr1 < expr2
返される値
ブール値,またはブール値の連鎖
<=
未満または等しい。数値表現に適用。
expr1 <= expr2
返される値
ブール値,またはブール値の連鎖
==
任意の種類の表現に適用されます.
expr1 == expr2
返される値
ブール値,またはブール値の連鎖
=>
'=>' オペレーターは,ユーザ定義の関数宣言とswitch文の中で
函数宣言の文法は次のとおりです.
            <identifier>([<parameter_name>[=<default_value>]], ...) =>
    <local_block>
    <function_result>
1つ<local_block>これは,Pineの文の0個以上である.
<function_result>変数,式,または元群である.
例として
            pine

            // single-line function
f1(x, y) => x + y
// multi-line function
f2(x, y) =>
    sum = x + y
    sumChange = ta.change(sum, 10)
    // Function automatically returns the last expression used in it
plot(f1(30, 8) + f2(1, 3))
注記
ユーザハンドルの声明関数とスクリプトライブラリページで,ユーザ定義関数に関する詳細をご覧いただけます.
>
より大きい。数値表現に適用する。
expr1 > expr2
返される値
ブール値,またはブール値の連鎖
>=
大きいか等しい. 数値表現に適用する.
expr1 >= expr2
返される値
ブール値,またはブール値の連鎖
?:
三元条件演算子。
expr1 ? expr2 : expr3
例として
            pine

            // Draw circles at the bars where open crosses close
s2 = ta.cross(open, close) ? math.avg(open,close) : na
plot(s2, style=plot.style_circles, linewidth=2, color=color.red)

// Combination of ?: operators for 'switch'-like logic
c = timeframe.isintraday ? color.red : timeframe.isdaily ? color.green : timeframe.isweekly ? color.blue : color.gray
plot(hl2, color=c)
返される値
もしexpr1がtrueと評価され,expr2が,expr3と評価されなければ,expr3である.ゼロ値 ((0とNaN+,Infinity,-Infinity) はfalseと判断され,その他の値はtrueである.
注記
<unk>else<unk>の枝としてnaを使ってください.
<unk>switch<unk>のような文を実現するために,2つまたは複数の?: オペレーターを使用して組み合わせることができます (上の例を参照).
数値付き算術演算子や変数列を使用できます. 列を使用する場合は,演算子は要素に適用されます.
続きを見る
na
[]
シリーズ下標。expr1シリーズの前の値へのアクセスを提供。expr2は過去k行の数で,数値でなければならない。浮動は下向きに丸められる。
expr1[expr2]
例として
            pine

            // [] can be used to "save" variable value between bars
a = 0.0 // declare `a`
a := a[1] // immediately set current value to the same as previous. `na` in the beginning of history
if high == low // if some condition - change `a` value to another
    a := low
plot(a)
返される値
数値のセット
続きを見る
math.floor
and
LOGICAL AND。ブル式に適用される。
expr1 and expr2
返される値
ブール値,またはブール値の連鎖
or
論理OR。はブル式に適用されます。
expr1 or expr2
返される値
ブール値,またはブール値の連鎖
not
論理反転 ((NOT) 〜はブル式に適用されます。
not expr1
返される値
ブール値,またはブール値の連鎖
データ型 キーワード
bool
変数またはパラメータを明示的に宣言する bool <unk> ((ブール)) 型のキーワード. "Bool"の変数の値は true, false,または na になります.
例として
            pine

            // bool
bool b = true    // Same as `b = true`
b := na
plot(b ? open : close)
注記
変数宣言でタイプを明示的に言及することは,naで初期化されている場合を除き,オプションです. タイプシステムのユーザーハンドルページでPineタイプについての詳細をご覧ください.
続きを見る
var varip int float color string true false
int
変数またはパラメータを明示的に宣言する<unk>int<unk> ((整数) タイプのキーワード。
例として
            pine

            // int
int i = 14    // Same as `i = 14`
i := na
plot(i)
注記
変数宣言でタイプを明示的に言及することは,naで初期化されている場合を除き,オプションです. タイプシステムのユーザーハンドルページでPineタイプについての詳細をご覧ください.
続きを見る
var varip float bool color string
float
変数またはパラメータを明示的に宣言する float () のキーワード.
例として
            pine

            // float
float f = 3.14    // Same as `f = 3.14`
f := na
plot(f)
注記
変数声明で明確にタイプを記述することは,naで初期化されている場合を除き,オプションです.
続きを見る
var varip int bool color string
string
変数やパラメータを明示的に宣言する"string"タイプのキーワード。
例として
            pine

            // string
string s = "Hello World!"    // Same as `s = "Hello world!"`
// string s = na // same as ""
plot(na, title=s)
注記
変数宣言でタイプを明示的に言及することは,naで初期化されている場合を除き,オプションです. タイプシステムのユーザーハンドルページでPineタイプについての詳細をご覧ください.
続きを見る
var varip int float bool str.tostring str.format
color
変数またはパラメータを明示的に宣言する"color"タイプのキーワード。
例として
            pine

            // color
color textColor = color.green
if barstate.islastconfirmedhistory
    runtime.log("test", textcolor = textColor)
注記
カラー文字は以下の形式で表示されます:#RRGGBBまたは#RRGGBBAA。文字対は,00からFFまでの16進制値を代表する (((0から255までの10進制),RR,GG,BB対は,色の赤,緑,青の分数の値である。AAは,色の透明度 (((またはalpha分数) のオプション値であり,00は見えず,FFは透明ではない。AA対が提供されない場合,FFを使用する。16進制文字は,大文字または小文字である。
変数宣言でタイプを明示的に言及することは,naで初期化されている場合を除き,オプションです. タイプシステムのユーザーハンドルページでPineタイプについての詳細をご覧ください.
続きを見る
var varip int float string color.rgb color.new
array
変数またはパラメータを明示的に宣言する<unk>配列の<unk>型のキーワード.array.new<type>,array.from関数は,配列オブジェクト ((またはID) を作成する.
例として
            pine

            // array
array<float> a = na
a := array.new<float>(1, close)
plot(array.get(a, 0))
注記
配列のオブジェクトは常に<unk>系列<unk>形式である。
続きを見る
var array.new array.from
Objects
PINE言語のObjectsオブジェクトは,ユーザ定義型 ((UDT) の例であり,方法のないクラスとして理解され,ユーザがポリシーでカスタム型を作成し,異なる値を一つのエンティティに組織することができます.
タイプを定義する
オーダー情報を保存する order タイプを定義します.
            pine

            type order
    float price
    float amount
    string symbol
- 使用
typeキーワード宣言のタイプ - type キーワードの後に type の名前があります。
- 最初の行 type は,型名を定義した後, 4 つの空白に縮小して,その型が含まれるフィールドを定義します.
- 各フィールドは,int,float,string等のデータタイプを指定する必要があります.
作成対象
定義されたタイプを使用し,呼び出しnew()この関数のオブジェクトは,
            pine

            order1 = order.new()
            pine

            order1 = order.new(100, 0.1, "BTC_USDT")
            pine

            order1 = order.new(amount = 0.1, symbol = "BTC_USDT", price = 100)
画像を空にしたオブジェクトを作成することもできます.
            pine

            order order1 = na
この記事の記事では,この問題について説明します.
            pine

            type order
    float price
    float amount
    string symbol

if strategy.position_size == 0 and open > close
    strategy.entry("long", strategy.long, 1)

order1 = order.new(strategy.opentrades.entry_price(strategy.opentrades - 1), strategy.opentrades.size(strategy.opentrades - 1), syminfo.ticker)
// runtime.log(order1)   // 输出 {"data":{"price":46002.8,"amount":1,"symbol":"swap"},"_meta":0,"_type":"order"}
ビデオの例として,
            pine

            order1 = order.new(strategy.opentrades.entry_price(strategy.opentrades - 1), strategy.opentrades.size(strategy.opentrades - 1), syminfo.ticker)
書き込みの形式は以下の通りです.
            pine

            order order1 = na
order1 := order.new(strategy.opentrades.entry_price(strategy.opentrades - 1), strategy.opentrades.size(strategy.opentrades - 1), syminfo.ticker)
オブジェクトのタイプ var キーワードの使用
            pine

            //@version=5
indicator("Objects using `var` demo")

//@type A custom type to hold index, price, and volume information.
type BarInfo
    int   index = bar_index
    float price = close
    float vol   = volume

//@variable A `BarInfo` instance whose fields persist through all iterations, starting from the first bar.
var BarInfo firstBar = BarInfo.new()
//@variable A `BarInfo` instance declared on every bar.
BarInfo currentBar = BarInfo.new()

// Plot the `index` fields of both instances to compare the difference.
plot(firstBar.index, "firstBar")
plot(currentBar.index, "currentBar")
var キーワード宣言を使用すると,ユーザ定義型のオブジェクトの変数に割り当てられると,そのキーワードは自動的にそのオブジェクトのすべてのフィールドに適用されます.これは,var キーワード宣言によって宣言されたオブジェクトが,各イデレーションの間にその状態を保持することを意味し,各イデレーションでそのフィールド値を再初期化する必要はありません.
- firstBar オブジェクトは var キーワードで宣言されているので,そのフィールド ((index,price,vol) は,最初のエントリから最後のエントリまで,各エピデーションでその値を保持します。
- currentBar オブジェクトは var キーワード宣言を使用していないので,そのフィールドは各エントリーで再初期化され,各エピデーションに新しいオブジェクトがあります.
2つのオブジェクトのインデックスフィールドをマッピングすることで,それらの間の違いを比較できます. firstBar.indexは,各エピソードで先行設定の値を保持し, currentBar.indexは,各エピソードで,現在の項目の bar_index 値として再初期化されます.
オブジェクトのタイプ Varip キーワードの使用
            pine

            //@version=5
indicator("Objects using `varip` fields demo")

//@type A custom type that counts the bars and ticks in the script's execution.
type Counter
    int       bars  = 0
    varip int ticks = 0

//@variable A `Counter` object whose reference persists throughout all bars.
var Counter counter = Counter.new()

// Add 1 to the `bars` and `ticks` fields. The `ticks` field is not subject to rollback on unconfirmed bars.
counter.bars  += 1
counter.ticks += 1

// Plot both fields for comparison.
plot(counter.bars, "Bar counter", color.blue, 3)
plot(counter.ticks, "Tick counter", color.purple, 3)
パインでは,varipキーワードを使用することで,スクリプトの実行全体でオブジェクトのフィールドが継続的に存在することを指示し,未確認の列に回転しないようにします.
カウンター型の声明では,bars フィールドはvarip キーワードを使用していないので,未確認の各列で回転する.ticks フィールドはvarip キーワードを使用しているので,未確認の列で回転しない.
counter オブジェクトは var キーワードで宣言されているので,スクリプトの実行全体で持続します.
それぞれの代数では,bars フィールドと ticks フィールドが 1 倍に増加します. bars フィールドは,未確認の各列で回転しますが,ticks フィールドは回転しません.
最後に,counter.barsとcounter.ticksのフィールドをグラフ化することで,それらの間の違いを比較することができます. counter.barsの値は,未確認の各列の中で回転し, counter.ticksの値は,スクリプトの実行が終了するまで増加し続けます.
フィールドの値を変更する
            pine

            type order
    float price
    float amount
    string symbol

if strategy.position_size == 0 and open > close
    strategy.entry("long", strategy.long, 1)

order1 = order.new(strategy.opentrades.entry_price(strategy.opentrades - 1), strategy.opentrades.size(strategy.opentrades - 1), syminfo.ticker)

if strategy.position_size != 0
    runtime.log(order1)
    order1.price := 999
    order1.amount := 100
    runtime.log(order1)
    runtime.error("stop")
使用可能:=重ねるオペレータは,オブジェクトフィールドの値を変更します.
オブジェクトの集合
例は,ユーザが定義した order タイプのオブジェクトを保存する空の配列を宣言します.
            pine

            type order
    float price
    float amount
    string symbol

arrOrder = array.new<order>()

order1 = order.new(99, 1, "BTC_USDT")
order2 = order.new(100, 2, "ETH_USDT")

array.push(arrOrder, order1)
array.push(arrOrder, order2)

runtime.log(arrOrder)
runtime.error("stop")
または
            pine

            type order
    float price
    float amount
    string symbol

var array<order> arrOrder = na
arrOrder := array.new<order>()

order1 = order.new(99, 1, "BTC_USDT")
order2 = order.new(100, 2, "ETH_USDT")

array.push(arrOrder, order1)
array.push(arrOrder, order2)

runtime.log(arrOrder)
runtime.error("stop")
コピー対象
Pineでは,オブジェクトは引用によって割り当てられます.既存のオブジェクトが新しい変数に割り当てられると,どちらも同じオブジェクトを指します.
            pine

            //@version=5
indicator("")
type pivotPoint
    int x
    float y
pivot1 = pivotPoint.new()
pivot1.x := 1000
pivot2 = pivot1
pivot2.x := 2000
// Both plot the value 2000.
plot(pivot1.x)
plot(pivot2.x)
以下の例では,ピボット1オブジェクトを作成し,そのxフィールドを1000に設定します. 次に,ピボット2にこのピボット1オブジェクトへの引用を含む変数を宣言します. したがって,両方が同じインスタンスを指します. したがって,ピボット2.xを変更すると,ピボット1.xも変更されます.
元のオブジェクトから独立したコピーを作成するには,この場合,内蔵のcopy () メソッドを使用できます. この例では,pivot2がpivot1オブジェクトの複製インスタンスの変数を引用しています.
            pine

            //@version=5
indicator("")
type pivotPoint
    int x
    float y
pivot1 = pivotPoint.new()
pivot1.x := 1000
pivot2 = pivotPoint.copy(pivot1)
pivot2.x := 2000
// Plots 1000 and 2000.
plot(pivot1.x)
plot(pivot2.x)
注目すべきは,TradingView の copy メソッドは浅コピーであることです. もしオブジェクトに特殊なタイプのフィールド (arrayなど) があれば,オブジェクトの浅コピー内のこれらのフィールドは,そのオブジェクトと同じインスタンスを指します.
FMZのプラットフォームは,追加処理を必要とせず,直接ディープコピーを実行します.
複製する
            pine

            //@version=5

indicator("test deepCopy")

type orderInfo
    float price
    float amount

type labelInfo
    orderInfo order
    string labelMsg

labelInfo1 = labelInfo.new(orderInfo.new(100, 0.1), "test labelInfo1")
labelInfo2 = labelInfo.copy(labelInfo1)

labelInfo1.labelMsg := "labelInfo1->2"    // 修改 labelInfo1 的基础类型字段,看是否影响 labelInfo2
labelInfo1.order.price := 999             // 修改 labelInfo1 的复合类型字段,看是否影响 labelInfo2

runtime.log(labelInfo1)
runtime.log(labelInfo2)
runtime.error("stop")
テスト結果は,labelInfo.copy ((labelInfo1) が実行される時に深部コピーであり,labelInfo1の任意のフィールドを変更してもlabelInfo2に影響しない。
Methods
Pine言語の方法 (Methods) は,特定のインスタンスの内置またはユーザ定義された型に関連した特殊な関数である.ほとんどの点で,それらは通常の関数と基本的には同じだが,より短く,より便利な文法を提供する.ユーザは,Pineオブジェクトのフィールドにアクセスするように,変数上の方法に点符号を使用して直接アクセスすることができる.Pineは,数列,マトリックス,マッピングライン,充填ラインなど,すべての特殊なタイプの内置方法を含んでいる.これらの方法は,ユーザにスクリプトでこれらのタイプの特殊なプログラムを呼び出すためのより簡潔な方法を提供します.
組み込み方法
このスクリプトのコードは,
            pine

            //@version=5
indicator("Custom Sample BB", overlay = true)

float sourceInput  = input.source(close, "Source")
int   samplesInput = input.int(20, "Samples")
int   n            = input.int(10, "Bars")
float multiplier   = input.float(2.0, "StdDev")

var array<float> sourceArray = array.new<float>(samplesInput)
var float        sampleMean  = na
var float        sampleDev   = na

// Identify if `n` bars have passed.
if bar_index % n == 0
    // Update the queue.
    array.push(sourceArray, sourceInput)
    array.shift(sourceArray)
    // Update the mean and standard deviaiton values.
    sampleMean := array.avg(sourceArray)
    sampleDev  := array.stdev(sourceArray) * multiplier

// Calculate bands.
float highBand = sampleMean + sampleDev
float lowBand  = sampleMean - sampleDev

plot(sampleMean, "Basis", color.orange)
plot(highBand, "Upper", color.lime)
plot(lowBand, "Lower", color.red)
文字の定義は以下の通りです.
            pine

            //@version=5
indicator("Custom Sample BB", overlay = true)

float sourceInput  = input.source(close, "Source")
int   samplesInput = input.int(20, "Samples")
int   n            = input.int(10, "Bars")
float multiplier   = input.float(2.0, "StdDev")

var array<float> sourceArray = array.new<float>(samplesInput)
var float        sampleMean  = na
var float        sampleDev   = na

// Identify if `n` bars have passed.
if bar_index % n == 0
    // Update the queue.
    sourceArray.push(sourceInput)
    sourceArray.shift()
    // Update the mean and standard deviaiton values.
    sampleMean := sourceArray.avg()
    sampleDev  := sourceArray.stdev() * multiplier

// Calculate band values.
float highBand = sampleMean + sampleDev
float lowBand  = sampleMean - sampleDev

plot(sampleMean, "Basis", color.orange)
plot(highBand, "Upper", color.lime)
plot(lowBand, "Lower", color.red)
支持されていることがわかりますMethodsそして,コードarray.avg(sourceArray)方法の形式で記述できる:sourceArray.avg()。
FMZは一時的にサポートされていません.array.avgこの呼び出しは
ユーザー定義の方法
Pine は,ユーザが定義する任意の内置またはユーザが定義するタイプのオブジェクトと一緒に使用するカスタムメソッドを許可します.定義メソッドは本質的に定義関数と同じですが,二つの重要な違いがあります.
1、method キーワードは,関数名前の前に含めなければならない。
2. method のパラメータ,そのうちの最初のパラメータの型は,その方法が関連付けられるオブジェクトの型を表すので,明示的な声明でなければならない.
例えば,以下のコードで,ブリン指標の計算のコードを,ユーザが自定義した方法として包装します.
            pine

            //@version=5
indicator("Custom Sample BB", overlay = true)

float sourceInput  = input.source(close, "Source")
int   samplesInput = input.int(20, "Samples")
int   n            = input.int(10, "Bars")
float multiplier   = input.float(2.0, "StdDev")

var array<float> sourceArray = array.new<float>(samplesInput)
var float        sampleMean  = na
var float        sampleDev   = na

// Identify if `n` bars have passed.
if bar_index % n == 0
    // Update the queue.
    sourceArray.push(sourceInput)
    sourceArray.shift()
    // Update the mean and standard deviaiton values.
    sampleMean := sourceArray.avg()
    sampleDev  := sourceArray.stdev() * multiplier

// Calculate band values.
float highBand = sampleMean + sampleDev
float lowBand  = sampleMean - sampleDev

plot(sampleMean, "Basis", color.orange)
plot(highBand, "Upper", color.lime)
plot(lowBand, "Lower", color.red)
変更しました.
            pine

            //@version=5
indicator("Custom Sample BB", overlay = true)

float sourceInput  = input.source(close, "Source")
int   samplesInput = input.int(20, "Samples")
int   n            = input.int(10, "Bars")
float multiplier   = input.float(2.0, "StdDev")

var array<float> sourceArray = array.new<float>(samplesInput)
method maintainQueue(array<float> srcArray, float value, bool takeSample = true) =>
    if takeSample
        srcArray.push(value)
        srcArray.shift()
    srcArray

method calcBB(array<float> srcArray, float mult, bool calculate = true) =>
    var float mean = na
    var float dev  = na
    if calculate
        mean := srcArray.avg()
        dev  := srcArray.stdev() * mult
    [mean, mean + dev, mean - dev]

bool newSample = bar_index % n == 0

[sampleMean, highBand, lowBand] = sourceArray.maintainQueue(sourceInput, newSample).calcBB(multiplier, newSample)

plot(sampleMean, "Basis", color.orange)
plot(highBand, "Upper", color.lime)
plot(lowBand, "Lower", color.red)
キーワードメソッド宣言を使用したユーザカスタムメソッド:maintainQueue,calcBBのパラメータリストの最初のパラメータはarray<float>タイプは,メソッドがarray<float>タイプ変数の方法,以下のようなコードを呼び出し,ブリン指数を計算することを見ることができます.
            pine

            [sampleMean, highBand, lowBand] = sourceArray.maintainQueue(sourceInput, newSample).calcBB(multiplier, newSample)
METHODSをリロードする
ユーザ定義のメソッドは,同一の識別子を持つ既存の組み込みメソッドとユーザ定義のメソッドを覆い,オーバーロードすることができる.この機能は,ユーザが同じメソッド名の下に異なるパラメータの署名に関連した複数の例程を定義することを可能にする.簡単な例として,変数の種類を識別するためにメソッドを定義したいとします.ユーザ定義のメソッドに関連したオブジェクトのタイプを明示的に指定しなければならないので,我々はそれが識別することを希望する各種類に対してオーバーロードを定義する必要があります.
            pine

            //@version=5
indicator("Type Inspection")

// @function   Identifies an object's type.
// @param this Object to inspect.
// @returns    (string) A string representation of the type.
method getType(int this) =>
    na(this) ? "int(na)" : "int"

method getType(float this) =>
    na(this) ? "float(na)" : "float"

method getType(bool this) =>
    na(this) ? "bool(na)" : "bool"

method getType(color this) =>
    na(this) ? "color(na)" : "color"

method getType(string this) =>
    na(this) ? "string(na)" : "string"

a = 1             // a.getType(): float
b = 1.0           // b.getType(): float
c = true          // c.getType(): bool
d = color.white   // d.getType(): string(na)
e = "1"           // e.getType(): string

runtime.log("a.getType():", a.getType())
runtime.log("b.getType():", b.getType())
runtime.log("c.getType():", c.getType())
runtime.log("d.getType():", d.getType())
runtime.log("e.getType():", e.getType())
runtime.error("stop")
変数の基本型を決定するgetType()FMZプラットフォームでは,PINEスクリプトの底層がJavascript言語として実装されているため,数値タイプは浮点型のデータ ((float) として判断されます.
組み込み関数
函数呼び出し時にパラメータを伝送し,パラメータ名付与を指定し,対応するパラメータ位置で直接変数を伝送し,混合使用もサポートする.例えば:
            pine

            plot(close, title="test plot")     // 直接传参数 close ;指定参数 title ,赋值字符串"test plot"
指定したパラメータ名赋値の後に,直接変数をパラメータとして伝送することはできません.その後の伝送参数は,パラメータ名赋値の形式で書かなければなりません.
            pine

            // plot(close, title="test", color.red)    // 虽然plot第三个参数是颜色值,但是这样写就会报错
plot(close, title="test", color=color.red) // 正确写法
plot(close, "test", color.red)             // 正确写法
timeframe
timeframe.in_seconds
送付するtimeframeパラメータの時間周期は秒に変換する.
timeframe.in_seconds(timeframe)
例として
            pine

            // Get chart timeframe:
i_tf = input.timeframe("1D")

// Convert timeframe to the int value (number of seconds in 1 Day):
tf = timeframe.in_seconds(i_tf)

plot(tf)
返される値
timeframeの K 行の中の秒数の int 表示形式は。
パラメータ
timeframe(simple string) タイムフレーム。可選。デフォルトはtimeframe.period。
注記
についてtimeframe>= '1M'関数は,月の30.4167 (365/12) 日に基づいて秒数を計算する.
続きを見る
input.timeframe timeframe.period
ticker
ticker.heikinashi
コード識別子を作成し,平らな平均K線値を求めます.
ticker.heikinashi(symbol)
例として
            pine

            heikinashi_close = request.security(ticker.heikinashi(syminfo.tickerid), timeframe.period, close)

heikinashi_aapl_60_close = request.security(ticker.heikinashi(syminfo.tickerid), "60", close)
plot(heikinashi_close)
plot(heikinashi_aapl_60_close)
返される値
ストックコードの文字列値は,request.security関数に提供されます.
パラメータ
symbol(simple string) 商品コード識別子。
続きを見る
syminfo.tickerid syminfo.ticker request.security
request
request.data
外部データ
request.data(url, attribute)
例として
            pine

            /*backtest
start: 2024-09-01 16:00:00
end: 2024-10-10 08:00:00
period: 1d
basePeriod: 1d
exchanges: [{"eid":"Futures_Binance","currency":"BTC_USDT"}]
args: [["RunMode",1,358374],["ZPrecision",0,358374]]
*/

var chart_data = "https://www.datadata.com/api/v1/query/ebe46218-c5c6-4366-8c72-413694417976/data"
spotPrice = request.data(chart_data, "$.spot_close_price")
futuresPrice = request.data(chart_data, "$.future_close_price")
diff = futuresPrice - spotPrice

plot(diff, "永续-现货差价")
plot(futuresPrice, "期货价格", overlay=true)
plot(spotPrice, "现货价格", overlay=true)

if diff > 80 and strategy.position_size >= 0
    runtime.log("diff > 80")
    strategy.entry("Enter Short", strategy.short)
if diff < 60 and strategy.position_size <= 0
    runtime.log("diff < 60")
    strategy.entry("Enter Short", strategy.long)
返される値
パラメータattribute指定されたデータセット
パラメータ
-
url(simple string) リクエストのデータソースurl,データソースの応答のデータフォーマットは,要求事項に適合して,少なくともtime、data属性を含む必要がある:{"data": [], "schema": ["time", "data"]}参考になるデータ形式はjson{ "data": [ [1720051200000, "{\"spot_close_price\" : 57050.01, \"future_close_price\" : 57045.9}"], [1720137600000, "{\"spot_close_price\" : 56628.79, \"future_close_price\" : 56604.9}"], // ... ], "schema": ["time", "data"] } -
attribute(simple string) 属性の名前を指定し,必要なデータを返します.例えば:"$.spot_close_price"、使用$.前置として,属性の名前と,要求されたデータソースで返信されたデータ内のdataフィールドの属性が一致します.
誤ったメッセージはチェックする必要があります.request.dataリクエストの時間範囲が,回測設定の時間範囲と一致しているかどうか,回測時間序列でデータ検索ができないとエラーが返される.
この例では,data-data の SQL 文をクエリします.
            sql

            WITH latest_data AS (
    SELECT
        klines.spot_1d.Time AS time,
        CONCAT('{\"spot_close_price\" : ', klines.spot_1d.Close, ', \"future_close_price\" : ', klines.future_1d.Close, '}') AS data
    FROM
        klines.spot_1d
    JOIN
        klines.future_1d
    ON
        klines.spot_1d.Time = klines.future_1d.Time
    WHERE
        klines.spot_1d.Symbol = 'btc_usdt'
    AND
        klines.future_1d.Symbol = 'btc_usdt.swap'
    AND
        klines.spot_1d.Exchange = 'Binance'
    AND
        klines.future_1d.Exchange = 'Binance'
    ORDER BY
        klines.spot_1d.Time DESC
    LIMIT 100
)
SELECT * FROM latest_data
ORDER BY time ASC;
FMZのプラットフォームでデータ探索ページをクエリし,データリンクを作成します.https://www.datadata.com/api/v1/query/ebe46218-c5c6-4366-8c72-413694417976/data。
request.security
別の品種/解像度を求めます.
request.security(symbol, timeframe, expression, gaps, lookahead, ignore_invalid_symbol, currency)
例として
            pine

            s = request.security(syminfo.tickerid, "D", close)   // 1 Day
plot(s)

expr = ta.sma(close, 10)
s1 = request.security(syminfo.tickerid, "240", expr) // 240 Minutes
plot(s1)

// To avoid difference in calculation on history/realtime you can request not latest values and use merge strategy flags as follows:
s2 = request.security(syminfo.tickerid, "D", close[1], barmerge.gaps_off, barmerge.lookahead_on)
plot(s2)
f() => [open, high]
[o, h] = request.security(syminfo.tickerid, "D", f())
[l, c] = request.security(syminfo.tickerid, "D", [low, close])
plot((o + h + l + c) / 4)
返される値
要求シリーズ
パラメータ
symbol(simple string) 商品コード。timeframe(simple string) 時間周期。空の文字列はグラフの現在の時間周期として解釈されます。expression(series int/float/bool/color) は request.security の呼び出しから計算され,表現を返します。これは,シリーズまたはシリーズに変換できる要素を含む元組である。gaps(barmerge_gaps) 要求されたデータ結合策略を指定する (※データがメインシリーズOHLCデータと自動的に結合することを要求する) 可能な値: barmerge.gaps_on, barmerge.gaps_off ◎ barmerge.gaps_on - 要求されたデータが可能なギャップと結合する (※na値) ◎ barmerge.gaps_off - 要求されたデータが連続的に結合し,すべてのギャップは,以前の最近の既存の値で満たされる. 既定値はbarmerge.gaps_off ◎lookahead(barmerge_lookahead) 要求されたデータ統合策略.可能な値:barmerge.lookahead_on,barmerge.lookahead_off. バージョン3以降,デフォルト値はbarmerge.lookahead_off. 注意してください,行動はリアルタイムと同じで,歴史上だけ異なる。ignore_invalid_symbol(const bool) 任意のパラメータ.指定された商品が見つからなかった場合,関数の動作を決定する. false の場合は,スクリプトが停止し,実行時にエラーを返します. true の場合は,関数が na を返して実行を続ける. 既定値は false です.currency(simple string) 商品の通貨関連値 (((例えばOHLC) を通貨に変換する. その後,変換後の値に基づいて計算する. <unk>expression <unk>. 使用する変換率は,FX_IDCペアの前日の為替レートをベースにします. 計算するK線に相対する. 選択する. 既定値はsyminfo.currency になる. 可能な値:ISO 4217フォーマットの通貨コード (((例えば<unk>USD<unk>) を持つ3文字文字文字の文字列または currency.* 名前空間の常数の一つ,例えばcurrency.USD。
注記
この機能を使用したPineScriptコードは,履歴とリアルタイムのデータに対して異なる計算を行うことができます.
取引の時間や調整の種類など,追加パラメータを指定したい場合は,ticker.new() 関数を使用できます.
'ticker' 変数を使用して差分をこの関数に転送することはできません. あなたは 'ticker.new' 変数または,例えば, AAPL+MSFT のストックコードの文字列表示形式を使用できます.*TSLA”。
現在,スクリプトには最大40の request.security 呼び出しが許可されています.
この変数/関数を使用すると,指標が再描画される可能性があります.
解像度パラメータの許容値は:
1S,5S,15S,30S - 秒間隔 ((グラフ周期は,要求された周期より小さいか等しい)
1から1440分
1Dから365Dまで
1Wから52Wまで
1Mから12Mまでの数ヶ月
続きを見る
syminfo.ticker syminfo.tickerid timeframe.period ta.correlation barmerge.lookahead_off barmerge.lookahead_on
str
str.contains
その場合source文字列に含まれるstr子文字列は,true を返し,そうでなければ false を返します.
str.contains(source, str)
例として
            pine

            // If the current chart is a continuous futures chart, e.g “BTC1!”, then the function will return true, false otherwise.
var isFutures = str.contains(syminfo.tickerid, "!")
plot(isFutures ? 1 : 0)
返される値
その場合,source文字列で検索するstr変数に変数がある場合は true,そうでない場合は false になります.
パラメータ
source(series string) ソース文字列str(series string) 検索する子文字列
str.endswith
その場合source文字列はstr指定された子文字列の末尾は,true を返し,そうでない場合は,false を返します.
str.endswith(source, str)
返される値
その場合source文字列はstr指定された子文字列の末尾は,trueで,そうでない場合は,falseとなります.
パラメータ
source(series string) ソース文字列str(series string) 検索する子文字列
続きを見る
str.startswith
str.startswith
その場合source文字列はstr指定された子文字列の開始は,true を返し,そうでない場合は,false を返します.
str.startswith(source, str)
返される値
その場合source文字列はstr指定された子文字列は,trueで始まる.
パラメータ
source(series string) ソース文字列str(series string) 検索する子文字列
続きを見る
str.endswith
str.substring
文字列を返します.source文字列の子文字列。子文字列はbegin_pos指定されたインデックスの文字で始まり,source文字列の 'end_pos - 1' について
str.substring(source, begin_pos)
str.substring(source, begin_pos, end_pos)
例として
            pine

            sym= "EXCHANGE_NAME:SYMBOL_NAME"
pos = str.pos(sym, ":")        // Get position of ":" character
tkr= str.substring(sym, pos+1) // "SYMBOL_NAME"
if barstate.islastconfirmedhistory
    runtime.log(tkr)
返される値
ソース文字列から抽出した子文字列。
パラメータ
source(series string) から子文字列のソース文字列を抽出する。begin_pos(series int) 抽出された子文字列の開始位置。 独占である ((抽出された子文字列にはその位置の文字が含まれている) 。end_pos(series int) 終了位置。 独占である。 抽出された文字列は,その位置の文字を含まない。 選択可能な。 既定値はsource文字列の長さ
注記
文字列のインデックスは 0 から始まる.begin_pos等しいend_pos,関数は空の文字列を返します.
続きを見る
str.contains str.pos str.match
str.tonumber
str.tonumber(string)
返される値
有効数字を含む場合は,文字列の浮点型,そうでない場合はna。
パラメータ
string(series string) int または float の文字列表現形式。
str.format
フォーマット文字列と値をフォーマット文字列に変換する. フォーマット文字列には,テキストとフォーマットされる各値の大括弧{}内の占位符が含まれる. 各占位符には,その必要パラメータを代入する指数 ((0から始まる) が含まれており,選択可能なフォーマット説明符がある. 索引は,str.formatパラメータリスト内のそのパラメータの位置を示している.
str.format(formatString, arg0, arg1, ...)
例として
            pine

            // The format specifier inside the curly braces accepts certain modifiers:
// - Specify the number of decimals to display:
s1 = str.format("{0,number,#.#}", 1.34) // returns: 1.3
runtime.log(s1)

// - Round a float value to an integer:
s2 = str.format("{0,number,integer}", 1.34) // returns: 1
runtime.log(s2)

// - Display a number in currency:
s3 = str.format("{0,number,currency}", 1.34) // returns: $1.34
runtime.log(s3)

// - Display a number as a percentage:
s4 = str.format("{0,number,percent}", 0.5) // returns: 50%
runtime.log(s4)

// EXAMPLES WITH SEVERAL ARGUMENTS
// returns: Number 1 is not equal to 4
s5 = str.format("Number {0} is not {1} to {2}", 1, "equal", 4)
runtime.log(s5)

// returns: 1.34 != 1.3
s6 = str.format("{0} != {0, number, #.#}", 1.34)
runtime.log(s6)

// returns: 1 is equal to 1, but 2 is equal to 2
s7 = str.format("{0, number, integer} is equal to 1, but {1, number, integer} is equal to 2", 1.34, 1.52)
runtime.log(s7)

// returns: The cash turnover amounted to $1,340,000.00
s8 = str.format("The cash turnover amounted to {0, number, currency}", 1340000)
runtime.log(s8)

// returns: Expected return is 10% - 20%
s9 = str.format("Expected return is {0, number, percent} - {1, number, percent}", 0.1, 0.2)
runtime.log(s9)
返される値
フォーマットされた文字列
パラメータ
formatString(series string) 形式の文字列。arg0, arg1, ...(series int/float/bool/string/na/int[]/float[]/bool[]/string[]) フォーマットする値。
注記
引用されていないスタイルのすべての括弧はバランスをとらなければならない.例えば",ab {0} de"と"ab '}' de"は有効なスタイルのものだが",ab {0'}' de","ab } de"と"""'{'""は有効なスタイルのものではない.
str.length
文字列の文字数に対応する整数 を返します.
str.length(string)
返される値
ソース文字列の文字数
パラメータ
string(series string) ソース文字列
str.lower
すべての文字が小文字に変換された新しい文字列を返します.
str.lower(source)
返される値
文字はすべて新しい文字列に小文字に変換されます。
パラメータ
source(series string) 変換する文字列
続きを見る
str.upper
str.upper
すべての文字を大文字に変換した新しい文字列を返します.
str.upper(source)
返される値
文字はすべて大文字の新しい文字列に変換されます。
パラメータ
source(series string) 変換する文字列
続きを見る
str.lower
str.match
合っている場合regex正規表現は,返されるsource文字列の新子文字列で, 'na' を返します.
str.match(source, regex)
例として
            pine

            s = input.string("It's time to sell some EXCHANGE_NAME:SYMBOL_NAME!")

// finding first substring that matches regular expression "[\w]+:[\w]+"
var string tickerid = str.match(s, "[\\w]+:[\\w]+")

if barstate.islastconfirmedhistory
    runtime.log(tickerid) // "EXCHANGE_NAME:SYMBOL_NAME"
返される値
source文字列の新しい子文字列は,それがマッチングしている場合regex正規表現は 'na'。
パラメータ
source(series string) ソース文字列regex(series string) この文字列にマッチする正規表現。
注記
関数の戻り値source文字列の正規表現の最初の正規表現は。
regex文字列の反斜線<unk>記号は,例えば<unk>などの追加の反斜線を用いて変換する必要があります.\d<unk>は正規表現<unk>\d<unk>。を表しています.
続きを見る
str.contains str.substring
str.pos
戻ったsource文字列で最初に表示されるstr文字列の位置,または'na'を返します.
str.pos(source, str)
返される値
str文字列はsource文字列の中の位置
パラメータ
source(series string) ソース文字列str(series string) 検索する子文字列
注記
文字列のインデックスは 0 から始まる。
続きを見る
str.contains str.match str.substring
str.replace
N+1回目となる新しい文字列を返しますtarget文字列は,以前からtarget文字列はreplacement文字列のNはoccurrence中 指定する。Nは,交換するターゲット文字列のソース文字列に現れるマッチングインデックス。
str.replace(source, target, replacement, occurrence)
例として
            pine

            var source = "EXCHANGE1:SYMBOL1 / EXCHANGE1:SYMBOL2"

// Replace first occurrence of "EXCHANGE1" with "EXCHANGE2" replacement string
var newSource = str.replace(source, "EXCHANGE1",  "EXCHANGE2", 0)

if barstate.islastconfirmedhistory
    // Display "EXCHANGE2:SYMBOL1 / EXCHANGE1:SYMBOL2"
    runtime.log(newSource)
返される値
処理された文字列
パラメータ
source(series string) ソース文字列target(series string) を文字列に置き換えるreplacement(series string) 挿入する文字列ではなくターゲット文字列。occurrence(series int) 置き換えられるターゲット文字列は,ソース文字列に現れるマッチングインデックスである.最初のマッチングインデックスは0から始まる.選択可能な.0がデフォルト値である.
続きを見る
str.replace_all str.match
str.replace_all
代替文字列で,ソース文字列の毎回出現するターゲット文字列を代替する。
str.replace_all(source, target, replacement)
返される値
処理された文字列
パラメータ
source(series string) ソース文字列target(series string) を文字列に置き換えるreplacement(series string) ターゲット文字列が登場するたびに 置き換えられる文字列
str.split
文字列を子文字列の配列に分割し,その配列ID を返します.
str.split(string, separator)
返される値
文字列の配列のID。
パラメータ
string(series string) ソース文字列separator(series string) 各子文字列を区切る文字列
str.tostring
str.tostring(value)
str.tostring(value, format)
str.tostring(value[])
str.tostring(value[], format)
返される値
value引数の文字列は形式を表示する。
その場合value参数が文字列であれば,そのまま返されます.
したvaluenaの場合,関数は文字列<unk>NaN<unk>を返します.
パラメータ
value(series int/float/bool/string/int[]/float[]/bool[]/string[]) その要素を文字列の値または配列IDに変換する.format(series string) Format string. Accepts these format.* constants: format.mintick, format.percent, format.volume. Optional. The default value is '#.##########'.
注記
浮点値のフォーマットも,必要に応じてこれらの値を四辺五入する.例えば,str.tostring ((3.99, '#') は<unk>4<unk>を返します。
0の後に 0 が表示される場合は,'#'の代わりに '0' を使ってください. 例えば,'#.000'。
format.mintick を使用すると,この値は,syminfo.mintick で割り切れる余剰値のない最も近い数字に四辺五入されます. 返される文字列は,ゼロの付随で返されます.
x 参数が文字列であれば,同じ文字列値を返します。
Bool 型のパラメータは true または false を返します.
x が na であるとき,関数は<unk>NaN<unk>を返します.
color
color.new
機能色は,与えられた色に対して透明性を指定します.
color.new(color, transp)
例として
            pine

            plot(close, color=color.new(color.red, 50))
返される値
特定の透明性の色
パラメータ
color(series color)transp(series int/float) 利用可能な値は0から100までです.
注記
非常数のパラメータを使用する (例えば,<unk>simple<unk>,<unk>input<unk>,<unk>series<unk>) は,スクリプト<unk>の設定/スタイル<unk>のタグページで表示される色に影響を与える. 詳細については,ユーザーマニュアルを参照してください.
color.rgb
RGB色モデルを使って,透明性のある新しい色を作成します.
color.rgb(red, green, blue, transp)
例として
            pine

            plot(close, color=color.rgb(255, 0, 0, 50))
返される値
特定の透明性の色
パラメータ
red(series int/float) 赤色。可能な値は0から255である。green(series int/float) 緑色。可能な値は0から255。blue(series int/float) 青色。可能な値は0から255である。transp(series int/float) 選択する。色は透明。可能な値は0〜100 (不透明) 。デフォルト値は0。
注記
非常数のパラメータを使用する (例えば,<unk>simple<unk>,<unk>input<unk>,<unk>series<unk>) は,スクリプト<unk>の設定/スタイル<unk>のタグページで表示される色に影響を与える. 詳細については,ユーザーマニュアルを参照してください.
runtime
runtime.debug
コントロールで変数情報を印刷する.
FMZはPINE言語に特有の機能を持ち,runtime.debug(value)単一のパラメータがある.
runtime.log
ブログの出力内容について
FMZはPINE言語に特有の機能を持ち,runtime.log(1, 2, 3, close, high, ...)複数のパラメータを転送できます.
runtime.error
実行時にエラーが発生し,messageパラメータで指定されたエラーメッセージ
runtime.error(message)
パラメータ
message (series string) エラーメッセージ
input
input
Input をスクリプトの設定の入力タグページに追加します. これは,スクリプトユーザに設定オプションを提供することを可能にします. この関数は,defval <unk>の参数タイプを自動的に検出し,対応する入力プラグインを使用します.
input(defval, title, tooltip, inline, group)
input(defval, title, inline, group, tooltip)
例として
            pine

            i_switch = input(true, "On/Off")     // 设置true,默认勾选
plot(i_switch ? open : na)

i_len = input(7, "Length")
i_src = input(close, "Source")       // 下拉框,默认选择close
plot(ta.sma(i_src, i_len))

i_col = input(color.red, "Plot Color")
plot(close, color=i_col)

i_text = input("Hello!", "Message")
runtime.log(i_text)
返される値
変数の値を入力します.
パラメータ
defval(const int/float/bool/string/color or source-type built-ins) スクリプトの<unk>設定/入力<unk>のタグページで推奨される入力変数のデフォルト値を決定し,スクリプトユーザがそこから変更することができます. 源型内置関数は,計算ソースの指定した内置連鎖浮点変数です.close、hlc3その通りtitle(const string) 入力のタイトル。指定されていない場合は,変数名を入力のタイトルとして使用する。指定されているが空のタイトルがある場合は,空文字列に名称が指定されます。tooltip(const string) この文字列は,マウスがツールの提示アイコンにハングされたときにユーザーに表示されます.inline(const string) 一行に同じパラメータを使用したすべての入力呼び出しを統合する。パラメータとして使用される文字列は表示されない。それは,同じ行に属する入力のみを識別するために使用される。group(const string) 同じコンポーネント数字の文字列を使用して,すべての入力の上にヘッダを作成します. この文字列は,ヘッダのテキストとしても使用されます.
注記
input関数の返される値は常に変数に割り当てられるべきである.上記の例を参照.
続きを見る
input.bool input.color input.int input.float input.string input.timeframe input.source
input.source
スクリプトの設定のインプットタグページにインプットを追加します.これは,スクリプトのユーザーに設定オプションを提供することを可能にします.この機能は,ユーザが計算ソースを選択することを可能にするドロップダウンメニューを追加しました. close,hl2など. スクリプトは, input.source () 呼び出しのみを含んでいる場合,ユーザは,グラフ上の別の指標の出力ソースを選択することもできます.
input.source(defval, title, tooltip, inline, group)
例として
            pine

            i_src = input.source(close, "Source")
plot(i_src)
返される値
変数の値を入力します.
パラメータ
defval(series int/float) スクリプトの<unk>設定/入力<unk>のタグページで推奨される入力変数のデフォルト値を決定し,ユーザが変更できる.title(const string) 入力のタイトル。指定されていない場合は,変数名を入力のタイトルとして使用する。指定されているが空のタイトルがある場合は,空文字列に名称が指定されます。tooltip(const string) この文字列は,マウスがツールの提示アイコンにハングされたときにユーザーに表示されます.inline(const string) 一行に同じパラメータを使用したすべての入力呼び出しを統合する。パラメータとして使用される文字列は表示されない。それは,同じ行に属する入力のみを識別するために使用される。group(const string) 同じコンポーネント数字の文字列を使用して,すべての入力の上にヘッダを作成します. この文字列は,ヘッダのテキストとしても使用されます.
注記
input.source関数の結果は常に1つの変数に割り当てられるべきである.上記の例を参照してください.
続きを見る
input.bool input.int input.float input.string input.timeframe input.color input
input.string
スクリプトの設定の入力オプションカードにinput を追加します.これは,スクリプトのユーザに設定オプションを提供することを可能にします. この関数は,スクリプトの入力に文字列入力フィールドを追加します.
input.string(defval, title, options, tooltip, inline, group, confirm)
例として
            pine

            i_text = input.string("Hello!", "Message")
runtime.log(i_text)
返される値
変数の値を入力します.
パラメータ
defval(const string) スクリプトのコンスタンス設定/入力コンスタンスタグページで推奨される入力変数のデフォルト値を指定し,ユーザが変更できる.options参数と一緒に使用する場合は,その値がいずれかである必要があります.title(const string) 入力のタイトル。指定されていない場合は,変数名を入力のタイトルとして使用する。指定されているが空のタイトルがある場合は,空文字列に名称が指定されます。options(List of constants: [<type>...]) 選択可能なオプションのリスト。tooltip(const string) この文字列は,マウスがツールの提示アイコンにハングされたときにユーザーに表示されます.inline(const string) 一行に同じパラメータを使用したすべての入力呼び出しを統合する。パラメータとして使用される文字列は表示されない。それは,同じ行に属する入力のみを識別するために使用される。group(const string) 同じコンポーネント数字の文字列を使用して,すべての入力の上にヘッダを作成します. この文字列は,ヘッダのテキストとしても使用されます.confirm(const bool) true とすると,指標をグラフに追加する前に,ユーザに入力値を確認するように求められます. 既定値は false です.
注記
input.string関数の結果は常に1つの変数に割り当てるべきで,上の例を参照してください。
続きを見る
input.bool input.int input.float input.timeframe input.source input.color input
input.bool
スクリプトの設定の入力タグページにinput を追加します.これは,スクリプトユーザに設定オプションを提供することを可能にします.この関数は,スクリプトの入力に選択マークを追加します.
input.bool(defval, title, tooltip, inline, group, confirm)
例として
            pine

            i_switch = input.bool(true, "On/Off")
plot(i_switch ? open : na)
返される値
変数の値を入力します.
パラメータ
defval(const bool) スクリプトのタグ設定/入力タグのタグページで推奨される入力変数のデフォルト値を決定し,ユーザがそこから変更することができます.title(const string) 入力のタイトル。指定されていない場合は,変数名を入力のタイトルとして使用する。指定されているが空のタイトルがある場合は,空文字列に名称が指定されます。tooltip(const string) この文字列は,マウスがツールの提示アイコンにハングされたときにユーザーに表示されます.inline(const string) 一行に同じパラメータを使用したすべての入力呼び出しを統合する。パラメータとして使用される文字列は表示されない。それは,同じ行に属する入力のみを識別するために使用される。group(const string) 同じコンポーネント数字の文字列を使用して,すべての入力の上にヘッダを作成します. この文字列は,ヘッダのテキストとしても使用されます.confirm(const bool) true とすると,指標をグラフに追加する前に,ユーザに入力値を確認するように求められます. 既定値は false です.
注記
input.bool関数の結果は常に1つの変数に割り当てるべきで,上の例を参照してください。
続きを見る
input.int input.float input.string input.timeframe input.source input.color input
input.int
スクリプトの設定の入力タグページにinput を追加します.これは,スクリプトのユーザーに設定オプションを提供することを可能にします. この関数は,スクリプトの入力に整数入力フィールドを追加します.
input.int(defval, title, minval, maxval, step, tooltip, inline, group, confirm)
input.int(defval, title, options, tooltip, inline, group, confirm)
例として
            pine

            i_len1 = input.int(10, "Length 1", minval=5, maxval=21, step=1)
plot(ta.sma(close, i_len1))

i_len2 = input.int(10, "Length 2", options=[5, 10, 21])
plot(ta.sma(close, i_len2))
返される値
変数の値を入力します.
パラメータ
defval(const int) スクリプトの<unk>設定/入力<unk>のタグページで推奨される入力変数のデフォルト値を決定し,スクリプトユーザが変更できる.options参数と一緒に使用する場合は,その値がいずれかである必要があります.title(const string) 入力のタイトル。指定されていない場合は,変数名を入力のタイトルとして使用する。指定されているが空のタイトルがある場合は,空文字列に名称が指定されます。minval(const int) 入力変数の最小可能な値。可選。maxval(const int) 入力変数の可能な最大値。可選。step(const int) 入力を加減するステップ長さの値。 任意。 既定値は 1。options(tuple of const int values: [val1, val2, ...]) は,ドロップダウンメニューから選択したオプションのリストで,コマで区切られ,平方括弧で囲まれている.[val1,val2,...]。 このパラメータを使用すると,使用できません.minval、maxvalそしてstepパラメータtooltip(const string) この文字列は,マウスがツールの提示アイコンにハングされたときにユーザーに表示されます.inline(const string) 一行に同じパラメータを使用したすべての入力呼び出しを統合する。パラメータとして使用される文字列は表示されない。それは,同じ行に属する入力のみを識別するために使用される。group(const string) 同じコンポーネント数字の文字列を使用して,すべての入力の上にヘッダを作成します. この文字列は,ヘッダのテキストとしても使用されます.confirm(const bool) true とすると,指標をグラフに追加する前に,ユーザに入力値を確認するように求められます. 既定値は false です.
注記
input.int 関数の結果は,常に 1 つの変数に割り当てられるべきである.上記の例を参照してください。
続きを見る
input.bool input.float input.string input.timeframe input.source input.color input
input.float
スクリプトの設定の入力タグページにinput を追加します.これは,スクリプトユーザに設定オプションを提供することを可能にします. この関数は,浮点入力フィールドをスクリプトの入力に追加します.
input.float(defval, title, minval, maxval, step, tooltip, inline, group, confirm)
input.float(defval, title, options, tooltip, inline, group, confirm)
例として
            pine

            i_angle1 = input.float(0.5, "Sin Angle", minval=-3.14, maxval=3.14, step=0.02)
plot(math.sin(i_angle1) > 0 ? close : open, "sin", color=color.green)

i_angle2 = input.float(0, "Cos Angle", options=[-3.14, -1.57, 0, 1.57, 3.14])
plot(math.cos(i_angle2) > 0 ? close : open, "cos", color=color.red)
返される値
変数の値を入力します.
パラメータ
defval(const int/float) スクリプトの<unk>設定/入力<unk>のタグページで推奨される入力変数のデフォルト値を決定し,スクリプトユーザが変更できる.options参数と一緒に使用する場合は,その値がいずれかである必要があります.title(const string) 入力のタイトル。指定されていない場合は,変数名を入力のタイトルとして使用する。指定されているが空のタイトルがある場合は,空文字列に名称が指定されます。minval(const int/float) 入力変数の最小可能な値。可選。maxval(const int/float) 入力変数の可能な最大値。可選。step(const int/float) 入力を加減するステップ長さの値。可選。 既定値は 1。options(tuple of const int/float values: [val1, val2, ...]) は,ドロップダウンメニューから選択したオプションのリストで,コマで区切られ,平方括弧で囲まれている.[val1,val2,...]。 このパラメータを使用すると,使用できません.minval、maxvalそしてstepパラメータtooltip(const string) この文字列は,マウスがツールの提示アイコンにハングされたときにユーザーに表示されます.inline(const string) 一行に同じパラメータを使用したすべての入力呼び出しを統合する。パラメータとして使用される文字列は表示されない。それは,同じ行に属する入力のみを識別するために使用される。group(const string) 同じコンポーネント数字の文字列を使用して,すべての入力の上にヘッダを作成します. この文字列は,ヘッダのテキストとしても使用されます.confirm(const bool) true とすると,指標をグラフに追加する前に,ユーザに入力値を確認するように求められます. 既定値は false です.
注記
input.float関数の結果は常に1つの変数に割り当てられるべきである.上記の例を参照してください。
続きを見る
input.bool input.int input.string input.timeframe input.source input.color input
input.color
Input をスクリプトの設定の入力タグページに追加します.これは,スクリプトのユーザーに設定オプションを提供することを可能にします.この関数は,色彩選択器を追加し,色彩と透明性を色彩板または16進数値から選択することができます.
input.color(defval, title, tooltip, inline, group, confirm)
例として
            pine

            i_col = input.color(color.red, "Plot Color")
plot(close, color=i_col)
返される値
変数の値を入力します.
パラメータ
defval(const color) スクリプトのタグ設定/入力タグのタグページで推奨される入力変数のデフォルト値を指定し,ユーザが変更することができます.title(const string) 入力のタイトル。指定されていない場合は,変数名を入力のタイトルとして使用する。指定されているが空のタイトルがある場合は,空文字列に名称が指定されます。tooltip(const string) この文字列は,マウスがツールの提示アイコンにハングされたときにユーザーに表示されます.inline(const string) 一行に同じパラメータを使用したすべての入力呼び出しを統合する。パラメータとして使用される文字列は表示されない。それは,同じ行に属する入力のみを識別するために使用される。group(const string) 同じコンポーネント数字の文字列を使用して,すべての入力の上にヘッダを作成します. この文字列は,ヘッダのテキストとしても使用されます.confirm(const bool) true とすると,指標をグラフに追加する前に,ユーザに入力値を確認するように求められます. 既定値は false です.
注記
input.color関数の結果は常に1つの変数に割り当てられるべきである.上記の例を参照してください.
続きを見る
input.bool input.int input.float input.string input.timeframe input.source input
input.price
価格入力をスクリプトのタグセット/入力タグのページに追加します.confirm = trueインタラクティブな入力モードを有効にして,グラフをクリックして価格を選択します.
input.price(defval, title, tooltip, inline, group, confirm)
例として
            pine

            price1 = input.price(title="Date", defval=42)
plot(price1)

price2 = input.price(54, title="Date")
plot(price2)
返される値
変数の値を入力します.
パラメータ
defval(const int/float) スクリプトの<unk>設定/入力<unk>のタグページで推奨される入力変数のデフォルト値を指定し,ユーザが変更できる.title(const string) 入力のタイトル。指定されていない場合は,変数名を入力のタイトルとして使用する。指定されているが空のタイトルがある場合は,空文字列に名称が指定されます。tooltip(const string) この文字列は,マウスがツールの提示アイコンにハングされたときにユーザーに表示されます.inline(const string) 一行に同じパラメータを使用したすべての入力呼び出しを統合する。パラメータとして使用される文字列は表示されない。それは,同じ行に属する入力のみを識別するために使用される。group(const string) 同じコンポーネント数字の文字列を使用して,すべての入力の上にヘッダを作成します. この文字列は,ヘッダのテキストとしても使用されます.confirm(const bool) true の場合は,インタラクティブ入力モードを有効にして,指標をグラフに追加するときにグラフをクリックして選択を完了します. または,指標を選択し,その後選択を移動して選択を完了します.
注記
インタラクティブモードでは, 2 つの関数が呼び出される場合inline参数が同じ参数を使用する場合,時間入力と価格入力を組み合わせて使用できます.
続きを見る
input.bool input.int input.float input.string input.resolution input.source input.color input
input.timeframe
スクリプトの設定の入力タグページにインプットを追加します.これは,スクリプトのユーザーに設定オプションを提供することを可能にします. この関数は,ユーザがタイムピークセレクターから特定のタイムピークを選択し,それを文字列として返却することを可能にする,ドロップダウンリストを追加します.
input.timeframe(defval, title, options, tooltip, inline, group, confirm)
例として
            pine

            i_res = input.timeframe('D', "Resolution", options=['D', 'W', 'M'])
s = request.security(syminfo.tickerid, i_res, close)
plot(s)
返される値
変数の値を入力します.
パラメータ
defval(const string) スクリプトのコンスタンス設定/入力コンスタンスタグページで推奨される入力変数のデフォルト値を指定し,ユーザが変更できる.options参数と一緒に使用する場合は,その値がいずれかである必要があります.title(const string) 入力のタイトル。指定されていない場合は,変数名を入力のタイトルとして使用する。指定されているが空のタイトルがある場合は,空文字列に名称が指定されます。options(tuple of const string values: [val1, val2, ...]) から選択できるオプションのリスト.tooltip(const string) この文字列は,マウスがツールの提示アイコンにハングされたときにユーザーに表示されます.inline(const string) 一行に同じパラメータを使用したすべての入力呼び出しを統合する。パラメータとして使用される文字列は表示されない。それは,同じ行に属する入力のみを識別するために使用される。group(const string) 同じコンポーネント数字の文字列を使用して,すべての入力の上にヘッダを作成します. この文字列は,ヘッダのテキストとしても使用されます.confirm(const bool) true とすると,指標をグラフに追加する前に,ユーザに入力値を確認するように求められます. 既定値は false です.
注記
input.timeframe関数の結果は常に1つの変数に割り当てられるべきである.上記の例を参照してください.
続きを見る
input.bool input.int input.float input.string input.source input.color input
input.integer
暫定的に
input.resolution
暫定的に
ta
ta.alma
Arnaud Legoux 移動平均. 移動平均の重みとして高氏分布を使用する.
ta.alma(series, length, offset, sigma)
ta.alma(series, length, offset, sigma, floor)
例として
            pine

            plot(ta.alma(close, 9, 0.85, 6))

// same on pine, but much less efficient
pine_alma(series, windowsize, offset, sigma) =>
    m = offset * (windowsize - 1)
    //m = math.floor(offset * (windowsize - 1)) // Used as m when math.floor=true
    s = windowsize / sigma
    norm = 0.0
    sum = 0.0
    for i = 0 to windowsize - 1
        weight = math.exp(-1 * math.pow(i - m, 2) / (2 * math.pow(s, 2)))
        norm := norm + weight
        sum := sum + series[windowsize - i - 1] * weight
    sum / norm
plot(pine_alma(close, 9, 0.85, 6))
返される値
アルナウド・レゴウ 移動平均
パラメータ
series(series int/float) 実行されるシリーズ値length(series int) K 行の数 (長さ)offset(simple int/float) 制御の滑らかさ ((より近い1) と応答性 ((より近い0) の間のバランス.sigma(simple int/float) ALMAの滑らかさを変更する。Sigmaが大きいほどALMAが滑らかになる。floor(simple bool) 選択可能なパラメータ.ALMAを計算する前に,偏移量計算が下限であるかどうかを指定する.デフォルト値はfalseである.
続きを見る
ta.sma ta.ema ta.rma ta.wma ta.vwma ta.swma
ta.sma
sma関数は移動平均,つまり x の最後の y 値, を y で割った値を返します.
ta.sma(source, length)
例として
            pine

            plot(ta.sma(close, 15))

// same on pine, but much less efficient
pine_sma(x, y) =>
    sum = 0.0
    for i = 0 to y - 1
        sum := sum + x[i] / y
    sum
plot(pine_sma(close, 15))
返される値
length返されるsource移動平均は,
パラメータ
source(series int/float) 実行されるシリーズ値length(series int) K 行の数 (長さ)
続きを見る
ta.ema ta.rma ta.wma ta.vwma ta.swma ta.alma
ta.cog
cogは統計学とフィボナッチの黄金比率に基づいた指標である.
ta.cog(source, length)
例として
            pine

            plot(ta.cog(close, 10))

// the same on pine
pine_cog(source, length) =>
    sum = math.sum(source, length)
    num = 0.0
    for i = 0 to length - 1
        price = source[i]
        num := num + price * (i + 1)
    -num / sum

plot(pine_cog(close, 10))
返される値
集中する
パラメータ
source(series int/float) 実行されるシリーズ値length(series int) K 行の数 (長さ)
続きを見る
ta.stoch
ta.dev
測定系列とそのta.smaとの違い
ta.dev(source, length)
例として
            pine

            plot(ta.dev(close, 10))

// the same on pine
pine_dev(source, length) =>
    mean = ta.sma(source, length)
    sum = 0.0
    for i = 0 to length - 1
        val = source[i]
        sum := sum + math.abs(val - mean)
    dev = sum/length
plot(pine_dev(close, 10))
返される値
length返されるsource偏差値について
パラメータ
source(series int/float) 実行されるシリーズ値length(series int) K 行の数 (長さ)
続きを見る
ta.variance ta.stdev
ta.stdev
ta.stdev(source, length, biased)
例として
            pine

            plot(ta.stdev(close, 5))

//the same on pine
isZero(val, eps) => math.abs(val) <= eps

SUM(fst, snd) =>
    EPS = 1e-10
    res = fst + snd
    if isZero(res, EPS)
        res := 0
    else
        if not isZero(res, 1e-4)
            res := res
        else
            15

pine_stdev(src, length) =>
    avg = ta.sma(src, length)
    sumOfSquareDeviations = 0.0
    for i = 0 to length - 1
        sum = SUM(src[i], -avg)
        sumOfSquareDeviations := sumOfSquareDeviations + sum * sum

    stdev = math.sqrt(sumOfSquareDeviations / length)
plot(pine_stdev(close, 5))
返される値
標準差
パラメータ
source(series int/float) 実行されるシリーズ値length(series int) K 行の数 (長さ)biased(series bool) どの推定値を使うべきかを決定する. 選択する. 既定値は true.
注記
その場合biasedtrueであれば,関数は全体全体に対する偏見のある見積もりを使って計算し,falseであれば,サンプルに対する偏見のない見積もりを使って計算する.
続きを見る
ta.dev ta.variance
ta.ema
ema関数は指数加重移動平均を返します. emaで加重因子は指数下落します.以下のような公式を使用して計算します.EMA = alpha * source + (1 - alpha) * EMA[1],ここでalpha = 2 / (length + 1) である.
ta.ema(source, length)
例として
            pine

            plot(ta.ema(close, 15))

//the same on pine
pine_ema(src, length) =>
    alpha = 2 / (length + 1)
    sum = 0.0
    sum := na(sum[1]) ? src : alpha * src + (1 - alpha) * nz(sum[1])
plot(pine_ema(close,15))
返される値
source指数移動平均,alpha = 2 / (長さ + 1) について
パラメータ
source(series int/float) 実行されるシリーズ値length(simple int) K線数 (長さ)
注記
この変数/関数を使用すると,指標が再描画される可能性があります.
続きを見る
ta.sma ta.rma ta.wma ta.vwma ta.swma ta.alma
ta.wma
wma関数が返されます.lengthKラインのsourceの加重移動平均. wmaでは加重因子は算術的位数で減少する.
ta.wma(source, length)
例として
            pine

            plot(ta.wma(close, 15))

// same on pine, but much less efficient
pine_wma(x, y) =>
    norm = 0.0
    sum = 0.0
    for i = 0 to y - 1
        weight = (y - i) * y
        norm := norm + weight
        sum := sum + x[i] * weight
    sum / norm
plot(pine_wma(close, 15))
返される値
length返されるsource移動平均を重み付けました
パラメータ
source(series int/float) 実行されるシリーズ値length(series int) K 行の数 (長さ)
続きを見る
ta.sma ta.ema ta.rma ta.vwma ta.swma ta.alma
ta.swma
固定長さの対称加重移動平均:4. 重量:[1/6,2 / 6,2 / 6,1 / 6]。
ta.swma(source)
例として
            pine

            plot(ta.swma(close))

// same on pine, but less efficient
pine_swma(x) =>
    x[3] * 1 / 6 + x[2] * 2 / 6 + x[1] * 2 / 6 + x[0] * 1 / 6
plot(pine_swma(close))
返される値
シンメトリー・ウェイト・ムービング・アベアンス
パラメータ
source(series int/float) ソースシリーズ。
続きを見る
ta.sma ta.ema ta.rma ta.wma ta.vwma ta.alma
ta.hma
hma関数は船体移動平均HMAを返します.
ta.hma(source, length)
例として
            pine

            src = input(defval=close, title="Source")
length = input(defval=9, title="Length")
hmaBuildIn = ta.hma(src, length)
plot(hmaBuildIn, title="Hull MA", color=#674EA7)
返される値
Hull Moving Average を Hull Moving Average に返します.
パラメータ
source(series int/float) 実行されるシリーズ値length(simple int) K 行の数
続きを見る
ta.ema ta.rma ta.wma ta.vwma ta.sma
ta.rma
RSIで使用される移動平均. 指数加重移動平均で,alpha加重値=1/長さである.
ta.rma(source, length)
例として
            pine

            plot(ta.rma(close, 15))

//the same on pine
pine_rma(src, length) =>
  alpha = 1/length
  sum = 0.0
  sum := na(sum[1]) ? ta.sma(src, length) : alpha * src + (1 - alpha) * nz(sum[1])
plot(pine_rma(close, 15))
返される値
sourceグラフの指数移動平均は,length。
パラメータ
source(series int/float) 実行されるシリーズ値length(simple int) K線数 (長さ)
続きを見る
ta.sma ta.ema ta.wma ta.vwma ta.swma ta.alma ta.rsi
ta.rsi
比較的強度指数. それは最後の時に使用されます.lengthオンラインsource変化の上昇と低下ta.rma()計算された
ta.rsi(source, length)
例として
            pine

            plot(ta.rsi(close, 7))

// same on pine, but less efficient
pine_rsi(x, y) =>
    u = math.max(x - x[1], 0) // upward ta.change
    d = math.max(x[1] - x, 0) // downward ta.change
    rs = ta.rma(u, y) / ta.rma(d, y)
    res = 100 - 100 / (1 + rs)
    res

plot(pine_rsi(close, 7))
返される値
RSI (相対的に強い指標)
パラメータ
source(series int/float) 実行されるシリーズ値length(simple int) K線数 (長さ)
続きを見る
ta.rma
ta.tsi
実際の強み・弱さ指数 金融機関の潜在的動力を用いた移動平均
ta.tsi(source, short_length, long_length)
返される値
実際の強み・弱さ指数 範囲[−1,1] の値
パラメータ
source(series int/float) ソースシリーズ。short_length(simple int) 短い長さ。long_length(simple int) 長線長について。
ta.roc
変数roc (変化率) が表示されます.source計算する.source数日前にlength値間の差
100 * change ((src, length) / src の式で計算する[length]。
ta.roc(source, length)
返される値
length返されるsource変化の割合
パラメータ
source(series int/float) 実行されるシリーズ値length(series int) K 行の数 (長さ)
ta.range
配列の最小値と最大値の差を返します.
ta.range(source, length)
返される値
序列の最小値と最大値の間の差
パラメータ
source(series int/float) 実行されるシリーズ値length(series int) K 行の数 (長さ)
ta.macd
MACDは,株価トレンドの強さ,方向,動力,および持続時間の変化を明らかにする.
ta.macd(source, fastlen, slowlen, siglen)
例として
            pine

            [macdLine, signalLine, histLine] = ta.macd(close, 12, 26, 9)
plot(macdLine, color=color.blue)
plot(signalLine, color=color.orange)
plot(histLine, color=color.red, style=plot.style_histogram)
値が1つだけ必要なら,次のような位置符を使います._':
例として
            pine

            [_, signalLine, _] = ta.macd(close, 12, 26, 9)
plot(signalLine, color=color.orange)
返される値
3つのMACDシリーズの元:MACD線,信号線,直角図線.
パラメータ
source(series int/float) 実行されるシリーズ値fastlen(simple int) 素線関数slowlen(simple int) 遅い長さの参数。siglen(simple int) 信号長度パラメータ。
ta.mode
配列のモードを返します.同じ周波数を持つ複数の値がある場合は最小値を返します.
ta.mode(source, length)
返される値
序列のパターン
パラメータ
source(series int/float) 実行されるシリーズ値length(series int) K 行の数 (長さ)
ta.median
配列の中位数に戻す
ta.median(source, length)
返される値
序列の中位数である.
パラメータ
source(series int/float) 実行されるシリーズ値length(series int) K 行の数 (長さ)
ta.linreg
線形回帰曲線。ユーザ定義の時間帯の中で指定価格に最も適合する線。最小二乗法を使用して計算されている。この関数の結果は,次の公式を使用して計算される:linreg = intercept + slope * (length - 1 - offset),ここで intercept と slope は使用されている.sourceシリーズの最小二乗の計算値。
ta.linreg(source, length, offset)
返される値
線形回帰曲線
パラメータ
source(series int/float) ソースシリーズ。length(series int)offset(simple int) 偏移する
ta.bb
ブリン帯 (Brinband) は,証券価格の単純移動平均 (SMA) との2つの標準偏差 (POSITIVEとNEGATIVE) の間の距離 (SMA) を定義する技術分析ツールであるが,ユーザーの好みに合わせて調整することができる.
ta.bb(series, length, mult)
例として
            pine

            [middle, upper, lower] = ta.bb(close, 5, 4)
plot(middle, color=color.yellow)
plot(upper, color=color.yellow)
plot(lower, color=color.yellow)

// the same on pine
f_bb(src, length, mult) =>
    float basis = ta.sma(src, length)
    float dev = mult * ta.stdev(src, length)
    [basis, basis + dev, basis - dev]

[pineMiddle, pineUpper, pineLower] = f_bb(close, 5, 4)

plot(pineMiddle)
plot(pineUpper)
plot(pineLower)
返される値
ブリン・ベルト
パラメータ
series(series int/float) 実行されるシリーズ値length(series int) K 行の数 (長さ)mult(simple int/float) 標準差因子。
ta.bbw
ブリン帯の幅 ブルリン帯の幅は,上線と下線から中線までの距離である.
ta.bbw(series, length, mult)
例として
            pine

            plot(ta.bbw(close, 5, 4), color=color.yellow)

// the same on pine
f_bbw(src, length, mult) =>
    float basis = ta.sma(src, length)
    float dev = mult * ta.stdev(src, length)
    ((basis + dev) - (basis - dev)) / basis

plot(f_bbw(close, 5, 4))
返される値
ブリン・バンド幅
パラメータ
series(series int/float) 実行されるシリーズ値length(series int) K 行の数 (長さ)mult(simple int/float) 標準差因子。
ta.cci
CCIの計算方法は,商品の典型的な価格とその単純な移動平均の間の差を典型的な価格の平均絶対偏差で割ることである.この指数は,より読みやすい数字を提供するために,0.015の逆転で縮小される.
ta.cci(source, length)
返される値
lengthK線で返されるソースの商品チャネル指数。
パラメータ
source(series int/float) 実行されるシリーズ値length(series int) K 行の数 (長さ)
ta.change
現在の値と前の値の差分, source - source[length]。
ta.change(source, length)
ta.change(source)
返される値
減税の結果
パラメータ
source(series int/float) ソースシリーズ。length(series int) 現在のk行から前のk行に偏移する. 任意で,与えられていない場合,length = 1 を使う.
ta.mom
source価格とsource価格についてlengthK線前の動力.これは単なる差分である:source - source[length]。
ta.mom(source, length)
返される値
source価格とsource価格についてlengthK線前の動力
パラメータ
source(series int/float) 実行されるシリーズ値length(series int) 現在のk行から前のk行へ偏移する。
続きを見る
ta.change
ta.cmo
チャンドル・ダイナミクス・ホイング・インディケーター. 最近の上昇点数と最近の下落点数の合計を計算し,両方を減算し,その結果を同じ期間のすべての価格変動の合計で割る.
ta.cmo(series, length)
例として
            pine

            plot(ta.cmo(close, 5), color=color.yellow)

// the same on pine
f_cmo(src, length) =>
    float mom = ta.change(src)
    float sm1 = math.sum((mom >= 0) ? mom : 0.0, length)
    float sm2 = math.sum((mom >= 0) ? 0.0 : -mom, length)
    100 * (sm1 - sm2) / (sm1 + sm2)

plot(f_cmo(close, 5))
返される値
チャンド動力の振動指数
パラメータ
series(series int/float) 実行されるシリーズ値length(series int) K 行の数 (長さ)
続きを見る
ta.rsi ta.stoch math.sum
ta.percentile_linear_interpolation
最近の2つのランキング間の線形挿入法を使用してパーセントを計算する.
ta.percentile_linear_interpolation(source, length, percentage)
返される値
length返されるsourceシリーズ第Pパーセント.
パラメータ
source(series int/float) 実行される一連の値 ((ソース) 。length(series int) 過去のK行の数 (長さ)percentage(simple int/float) パーセント,0から100までの数字
注記
この方法で計算されるパーセントは,入力データセットの全てではないことに注意してください.
続きを見る
ta.percentile_nearest_rank
ta.percentile_nearest_rank
最近のランキング方法による割合.
ta.percentile_nearest_rank(source, length, percentage)
返される値
length返されるsourceシリーズ第Pパーセント.
パラメータ
source(series int/float) 実行される一連の値 ((ソース) 。length(series int) 過去のK行の数 (長さ)percentage(simple int/float) パーセント,0から100までの数字
注記
過去100k線長未満の近年並列法を使用すると,同じ数字が複数のパーセント位に使用される結果となる.
最近のランキングでは,入力データセットに含まれる割合が計算されています.
100 番目のパーセントは,入力データセットの最大値として定義されます.
続きを見る
ta.percentile_linear_interpolation
ta.percentrank
パーセント等級は,前の値が,与えられた一連の現在の値より小さいか等しいパーセントである.
ta.percentrank(source, length)
返される値
length返されるsource百分位ランキング
パラメータ
source(series int/float) 実行されるシリーズ値length(series int) K 行の数 (長さ)
ta.variance
方差は,平均値から数列の平方偏差の期待値 (ta.sma) で,一組の数字から平均値までの距離を非公式に測定する.
ta.variance(source, length, biased)
返される値
length返されるsource差異について
パラメータ
source(series int/float) 実行されるシリーズ値length(series int) K 行の数 (長さ)biased(series bool) どの推定値を使うべきかを決定する. 選択する. 既定値は true.
注記
その場合biasedtrueであれば,関数は全体全体に対する偏見のある見積もりを使って計算し,falseであれば,サンプルに対する偏見のない見積もりを使って計算する.
ta.tr
ta.tr(handle_na)
返される値
math.max (高 - 低, math.abs (高 - 近い)[1]), math.abs(low - close[1]))。
パラメータ
handle_na(simple bool) の NaN 値の処理について.もし true で,前日の閉盘価格が NaN ならば,tr はその日の高-低点として計算されます.もしそうでないなら,tr はその状況で NaN を返します.また,ta.atr は ta.tr ([true]) を使います.
注記
ta.tr(false)そしてta.tr完全に同じです
続きを見る
ta.atr
ta.mfi
資金流動指標 資金流動指標は,価格と取引量を使用して,資産の過剰買いまたは過剰販売状況を決定する技術的指標である.
ta.mfi(series, length)
例として
            pine

            plot(ta.mfi(hlc3, 14), color=color.yellow)

// the same on pine
pine_mfi(src, length) =>
    float upper = math.sum(volume * (ta.change(src) <= 0.0 ? 0.0 : src), length)
    float lower = math.sum(volume * (ta.change(src) >= 0.0 ? 0.0 : src), length)
    mfi = 100.0 - (100.0 / (1.0 + upper / lower))
    mfi

plot(pine_mfi(hlc3, 14))
返される値
資金流動指数
パラメータ
series(series int/float) 実行されるシリーズ値length(series int) K 行の数 (長さ)
ta.kc
ケントナ通路 ケントナ通路は,中間の移動平均と上下軌道通路を含む技術指標である.
ta.kc(series, length, mult)
ta.kc(series, length, mult, useTrueRange)
例として
            pine

            [middle, upper, lower] = ta.kc(close, 5, 4)
plot(middle, color=color.yellow)
plot(upper, color=color.yellow)
plot(lower, color=color.yellow)


// the same on pine
f_kc(src, length, mult, useTrueRange) =>
    float basis = ta.ema(src, length)
    float span = (useTrueRange) ? ta.tr : (high - low)
    float rangeEma = ta.ema(span, length)
    [basis, basis + rangeEma * mult, basis - rangeEma * mult]

[pineMiddle, pineUpper, pineLower] = f_kc(close, 5, 4, true)

plot(pineMiddle)
plot(pineUpper)
plot(pineLower)
返される値
ケンタナ通路
パラメータ
series(series int/float) 実行されるシリーズ値length(simple int) K線数 (長さ)mult(simple int/float) 標準差因子。useTrueRange(simple bool) 選択可能なパラメータ。真範囲を使用するかどうかを指定する. trueをデフォルトする。値がfalseなら,表現 ((high-low) を用いて範囲を計算する。
ta.kcw
ケントナ通路の幅 ケーントナ通路の幅は上下通路間の差分を中間通路の値で割る.
ta.kcw(series, length, mult)
ta.kcw(series, length, mult, useTrueRange)
例として
            pine

            plot(ta.kcw(close, 5, 4), color=color.yellow)

// the same on pine
f_kcw(src, length, mult, useTrueRange) =>
    float basis = ta.ema(src, length)
    float span = (useTrueRange) ? ta.tr : (high - low)
    float rangeEma = ta.ema(span, length)

    ((basis + rangeEma * mult) - (basis - rangeEma * mult)) / basis

plot(f_kcw(close, 5, 4, true))
返される値
ケンター通路の幅
パラメータ
series(series int/float) 実行されるシリーズ値length(simple int) K線数 (長さ)mult(simple int/float) 標準差因子。useTrueRange(simple bool) 選択可能なパラメータ。真範囲を使用するかどうかを指定する. trueをデフォルトする。値がfalseなら,表現 ((high-low) を用いて範囲を計算する。
続きを見る
ta.kc ta.ema ta.atr ta.bb
ta.correlation
関連系数 △は,2つの系列が,その ta.sma 値から偏る傾向の程度を表している.
ta.correlation(source1, source2, length)
返される値
関連系数
パラメータ
source1(series int/float) ソースシリーズ。source2(series int/float) ターゲットシリーズ。length(series int) 長さ (k 行の数)
続きを見る
request.security
ta.cross
ta.cross(source1, source2)
返される値
2つの連続が互いに交差する場合は true,そうでない場合は falseである.
パラメータ
source1(series int/float) 第1データシリーズ。source2(series int/float) 2番目のデータシリーズ。
続きを見る
ta.change
ta.crossover
source1-series は,横断するとして定義されます.source2このK線では,source1値が大きい場合はsource2この線は,この線が,この線がsource2source1 の値について小于source2`値について
ta.crossover(source1, source2)
返される値
その場合source1通過するsource2返信は true でなければ false になります.
パラメータ
source1(series int/float) 第1データシリーズ。source2(series int/float) 2番目のデータシリーズ。
ta.crossunder
source1-series は,この状態で定義されます.source2このK線は,K線が1つである場合,source1この値より小さいです.source2この線は,この線が,この線がsource1値が大きい場合はsource2値について
ta.crossunder(source1, source2)
返される値
その場合source1存在するsource2文字列をクリックすると true,そうでない場合は falseとなります.
パラメータ
source1(series int/float) 第1データシリーズ。source2(series int/float) 2番目のデータシリーズ。
ta.atr
函数ATR ((真波幅の平均値) は,真範囲のRMAを返します.真波幅はmax ((high - low, abs ((high - close) である.[1]), abs(low - close[1]))。
ta.atr(length)
例として
            pine

            plot(ta.atr(14))

//the same on pine
pine_atr(length) =>
    trueRange = na(high[1])? high-low : math.max(math.max(high - low, math.abs(high - close[1])), math.abs(low - close[1]))
    //true range can be also calculated with ta.tr(true)
    ta.rma(trueRange, length)

plot(pine_atr(14))
返される値
実際の波動幅の平均値 ((ATR)
パラメータ
length (simple int) length (K行の数)
ta.sar
パラロイドの回転 (パラロイドの停止と逆転) は,取引市場の価格方向の潜在的逆転を特定するために,J. Welles Wilder, Jr.によって設計された方法である.
ta.sar(start, inc, max)
例として
            pine

            plot(ta.sar(0.02, 0.02, 0.2), style=plot.style_cross, linewidth=3)

// The same on Pine
pine_sar(start, inc, max) =>
  var float result = na
  var float maxMin = na
  var float acceleration = na
  var bool isBelow = na
  bool isFirstTrendBar = false

  if bar_index == 1
    if close > close[1]
      isBelow := true
      maxMin := high
      result := low[1]
    else
      isBelow := false
      maxMin := low
      result := high[1]
    isFirstTrendBar := true
    acceleration := start

  result := result + acceleration * (maxMin - result)

  if isBelow
    if result > low
      isFirstTrendBar := true
      isBelow := false
      result := math.max(high, maxMin)
      maxMin := low
      acceleration := start
  else
    if result < high
      isFirstTrendBar := true
      isBelow := true
      result := math.min(low, maxMin)
      maxMin := high
      acceleration := start

  if not isFirstTrendBar
    if isBelow
      if high > maxMin
        maxMin := high
        acceleration := math.min(acceleration + inc, max)
    else
      if low < maxMin
        maxMin := low
        acceleration := math.min(acceleration + inc, max)

  if isBelow
    result := math.min(result, low[1])
    if bar_index > 1
      result := math.min(result, low[2])

  else
    result := math.max(result, high[1])
    if bar_index > 1
      result := math.max(result, high[2])

  result

plot(pine_sar(0.02, 0.02, 0.2), style=plot.style_cross, linewidth=3)
返される値
横線は指針に回転した.
パラメータ
start(simple int/float) はじめました。inc(simple int/float) を追加するmax(simple int/float) 最大で
ta.barssince
前回の条件がtrueであるから,K行の数を計算する。
ta.barssince(condition)
例として
            pine

            // get number of bars since last color.green bar
plot(ta.barssince(close >= open))
返される値
条件が true であれば k 行の数
注記
この関数は,現在のK行以前にこの条件が満たされていない場合,na。 を返します.
この変数/関数を使用すると,指標が再描画される可能性があります.
続きを見る
ta.lowestbars ta.highestbars ta.valuewhen ta.highest ta.lowest
ta.cum
source総和は,つまり,source全体の要素の総和である.
ta.cum(source)
返される値
シリーズ総括
パラメータ
source(series int/float)
続きを見る
math.sum
ta.dmi
dmi関数は動向指数DMI。を返します.
ta.dmi(diLength, adxSmoothing)
例として
            pine

            len = input.int(17, minval=1, title="DI Length")
lensig = input.int(14, title="ADX Smoothing", minval=1, maxval=50)
[diplus, diminus, adx] = ta.dmi(len, lensig)
plot(adx, color=color.red, title="ADX")
plot(diplus, color=color.blue, title="+DI")
plot(diminus, color=color.orange, title="-DI")
返される値
3つのDMIシリーズの分組:正方向運動 ((+DI),負方向運動 ((-DI) と平均方向運動指数 ((ADX) 。
パラメータ
diLength(simple int) DI Period。adxSmoothing(simple int) ADX平滑周期
ta.falling
テストsourceシリーズlengthK-LONGが落ちているかどうか.
ta.falling(source, length)
返される値
今,もしあなたがsourceゼロから始めます.lengthKラインは,前回に返します.source値が true でない場合は false になります.
パラメータ
source(series int/float) 実行されるシリーズ値length(series int) K 行の数 (長さ)
続きを見る
ta.rising
ta.rising
テストsourceシリーズlengthK線ロングが上昇しているかどうか.
ta.rising(source, length)
返される値
今,もしあなたがsource価値は100億円以上lengthKラインは,前回に返します.source値が true でない場合は false になります.
パラメータ
source(series int/float) 実行されるシリーズ値length(series int) K 行の数 (長さ)
続きを見る
ta.falling
ta.pivothigh
この関数は,枢軸高点の価格を返します.もし枢軸高点がない場合は,<unk>NaN<unk>を返します.
ta.pivothigh(source, leftbars, rightbars)
ta.pivothigh(leftbars, rightbars)
例として
            pine

            leftBars = input(2)
rightBars=input(2)
ph = ta.pivothigh(leftBars, rightBars)
plot(ph, style=plot.style_cross, linewidth=3, color= color.red, offset=-rightBars)
返される値
この点の価格は"NaN"です.
パラメータ
source(series int/float) 選択可能なパラメータ。データシリーズの計算値。デフォルト値'High'。leftbars(series int/float) 左の力についてrightbars(series int/float) 右の長さ。
注記
参数 'leftbars' または 'rightbars' が連続である場合, max_bars_back 関数を 'source' 変数として使用する必要があります.
ta.pivotlow
この関数は,軸の低点の値を返します.軸の低点がない場合は,<unk>NaN<unk>を返します.
ta.pivotlow(source, leftbars, rightbars)
ta.pivotlow(leftbars, rightbars)
例として
            pine

            leftBars = input(2)
rightBars=input(2)
pl = ta.pivotlow(close, leftBars, rightBars)
plot(pl, style=plot.style_cross, linewidth=3, color= color.blue, offset=-rightBars)
返される値
この点の価格は"NaN"です.
パラメータ
source(series int/float) 選択可能なパラメータ。データシリーズの計算値。デフォルトは<unk>Low<unk>。leftbars(series int/float) 左の力についてrightbars(series int/float) 右の長さ。
注記
参数 'leftbars' または 'rightbars' が連続である場合, max_bars_back 関数を 'source' 変数として使用する必要があります.
ta.highest
k 行を過ぎた数値の最大値。
ta.highest(source, length)
ta.highest(length)
返される値
シリーズの最高値
パラメータ
source(series int/float) 実行されるシリーズ値length(series int) K 行の数 (長さ)
注記
2つのバージョンの args:sourceビデオは,この記事の1ページに掲載されています.length返されるK線数である.
このビデオは,length返されるK線数である.sourceシリーズ
続きを見る
ta.lowest ta.lowestbars ta.highestbars ta.valuewhen ta.barssince
ta.highestbars
k 線を越えた数値の最大偏移.
ta.highestbars(source, length)
ta.highestbars(length)
返される値
k 線に偏移する.
パラメータ
source(series int/float) 実行されるシリーズ値length(series int) K 行の数 (長さ)
注記
2つのバージョンの args:sourceビデオは,この記事の1ページに掲載されています.length返されるK線数である.
このビデオは,length返されるK線数である.sourceシリーズ
続きを見る
ta.lowest ta.highest ta.lowestbars ta.barssince ta.valuewhen
ta.stoch
ランダム指標。計算方程式:100 * (close - lowest(low, length)) / (highest(high, length) - lowest(low, length))。
ta.stoch(source, high, low, length)
返される値
ランダム
パラメータ
source(series int/float) ソースシリーズ。high(series int/float) 高シリーズlow(series int/float) 低シリーズlength(series int) 長さ (k 行の数)
続きを見る
ta.cog
ta.supertrend
超トレンド指数 超トレンド指数は,トレンドをたどる指数である.
ta.supertrend(factor, atrPeriod)
例として
            pine

            //@version=5
indicator("Pine Script™ Supertrend")

[supertrend, direction] = ta.supertrend(3, 10)
plot(direction < 0 ? supertrend : na, "Up direction", color = color.green, style=plot.style_linebr)
plot(direction > 0 ? supertrend : na, "Down direction", color = color.red, style=plot.style_linebr)

// The same on Pine Script™
pine_supertrend(factor, atrPeriod) =>
  src = hl2
  atr = ta.atr(atrPeriod)
  upperBand = src + factor * atr
  lowerBand = src - factor * atr
  prevLowerBand = nz(lowerBand[1])
  prevUpperBand = nz(upperBand[1])

  lowerBand := lowerBand > prevLowerBand or close[1] < prevLowerBand ? lowerBand : prevLowerBand
  upperBand := upperBand < prevUpperBand or close[1] > prevUpperBand ? upperBand : prevUpperBand
  int direction = na
  float superTrend = na
  prevSuperTrend = superTrend[1]
  if na(atr[1])
    direction := 1
  else if prevSuperTrend == prevUpperBand
    direction := close > upperBand ? -1 : 1
  else
    direction := close < lowerBand ? 1 : -1
  superTrend := direction == -1 ? lowerBand : upperBand
  [superTrend, direction]

[pineSupertrend, pineDirection] = pine_supertrend(3, 10)
plot(pineDirection < 0 ? pineSupertrend : na, "Up direction", color = color.green, style=plot.style_linebr)
plot(pineDirection > 0 ? pineSupertrend : na, "Down direction", color = color.red, style=plot.style_linebr)
返される値
2つの超トレンドシリーズの元組:超トレンドラインとトレンド方向.可能な値は1 (下向き) と-1 (上向き) である.
パラメータ
factor(series int/float) ATRは乗算される乗数である。atrPeriod(simple int) 平均真波長
続きを見る
ta.macd
ta.lowest
k 行を過ぎた数値の最小値
ta.lowest(source, length)
ta.lowest(length)
返される値
シリーズ内の最小値
パラメータ
source(series int/float) 実行されるシリーズ値length(series int) K 行の数 (長さ)
注記
2つのバージョンの args:sourceビデオは,この記事の1ページに掲載されています.length返されるK線数である.
このビデオは,length返されるK線数である.sourceシリーズ
続きを見る
ta.highest ta.lowestbars ta.highestbars ta.valuewhen ta.barssince
ta.lowestbars
k 線を越えた数値の最小偏移.
ta.lowestbars(source, length)
ta.lowestbars(length)
返される値
偏差が最小のk線に
パラメータ
source(series int/float) 実行されるシリーズ値length(series int) は K 線数 を返します.
注記
2つのバージョンの args:sourceビデオは,この記事の1ページに掲載されています.length返されるK線数である.
このビデオは,length返されるK線数である.sourceシリーズ
続きを見る
ta.lowest ta.highest ta.highestbars ta.barssince ta.valuewhen
ta.valuewhen
<unk>condition<unk>のn回目最近出現がtrueであるK行の<unk>source<unk>系列値を返します
ta.valuewhen(condition, source, occurrence)
例として
            pine

            slow = ta.sma(close, 7)
fast = ta.sma(close, 14)
// Get value of `close` on second most recent cross
plot(ta.valuewhen(ta.cross(slow, fast), close, 1))
パラメータ
condition(series bool) 検索する条件source(series int/float/bool/color) 条件を満たした K 線から返される値occurrence(simple int) 条件の出現。番号は0から始まり,時間的に遡るので,<unk>0<unk>は最近出現した<unk>condition<unk>であり,<unk>1<unk>は次に最近出現した<unk>であり,そのように推論。整数>=0。でなければならない.
注記
この機能は,各 K 線で実行する必要があります. for または while のループ構造では,その動作が予想外であるため,使用することは推奨されません. この機能を使用すると,指標の再描画を引き起こす可能性があります.
続きを見る
ta.lowestbars ta.highestbars ta.barssince ta.highest ta.lowest
ta.vwap
取引量加重平均価格
ta.vwap(source)
返される値
取引量加重平均
パラメータ
source(series int/float) ソースシリーズ。
続きを見る
ta.vwap
ta.vwma
vwma関数が返されます.lengthKラインのsource交付量加重移動平均の△は:sma ((source * volume, length) / sma ((volume, length) に等しい.
ta.vwma(source, length)
例として
            pine

            plot(ta.vwma(close, 15))

// same on pine, but less efficient
pine_vwma(x, y) =>
    ta.sma(x * volume, y) / ta.sma(volume, y)
plot(pine_vwma(close, 15))
返される値
length返されるsource取引量加重移動平均
パラメータ
source(series int/float) 実行されるシリーズ値length(series int) K 行の数 (長さ)
続きを見る
ta.sma ta.ema ta.rma ta.wma ta.swma ta.alma
ta.wpr
ウィリアムズ指数 (Williams %R。。) 振動指数は,現在の閉盘価格と過去<unk>の期間中の<unk>の高/低価格との関係を示している。。
ta.wpr(length)
例として
            pine

            plot(ta.wpr(14), title="%R", color=color.new(#ff6d00, 0))
返される値
Williams %R。
パラメータ
length(series int) Kのライン数
plot
plot
グラフに一連のデータを描画します.
plot(series, title, color, linewidth, style, trackprice, histbase, offset, join, editable, show_last, display)
例として
            pine

            plot(high+low, title='Title', color=color.new(#00ffaa, 70), linewidth=2, style=plot.style_area, offset=15, trackprice=true)

// You may fill the background between any two plots with a fill() function:
p1 = plot(open)
p2 = plot(close)
fill(p1, p2, color=color.new(color.green, 90))
返される値
fillの描画オブジェクトを使用できます.
パラメータ
series(series int/float) 描画するデータシリーズの。必要パラメータ。title(const string) 図のタイトルcolor(series color) 描画された色。 'color = red'または'color =#ff001a'のような常数,そして 'color = close >= open ? green: red'のような複雑な式を使うことができます。 任意のパラメータ。linewidth(input int) 描画ラインの幅。 既定値は 1。 すべてのスタイルには適用されない。style(plot_style) plot タイプ。可能な値は:plot.style_line、plot.style_stepline、plot.style_stepline_diamond、plot.style_histogram、plot.style_cross、plot.style_area、plot.style_columns、plot.style_circles、plot.style_linebr、plot.style_areabr。デフォルト値はplot.style_line。trackprice(input bool) trueなら,水平価格線は最後の指標値のレベルで表示されます. 既定はfalse.histbase(input int/float) plot.style_histogram,plot.style_columns,またはplot.style_areaのスタイルで図を描くとき,参照レベルの値として使用する。 既定値は0.0。offset(series int) 特定の数のk行上で左または右に移動する図. 既定値は0。join(input bool) もし true ならば,描画点は線と接続され,plot.style_cross と plot.style_circles のスタイルのみに適用されます. 既定値は false になります.editable(const bool) true ならば,図形のスタイルはフォーマットダイアログで編集できます。 既定値は true。show_last(input int) 設定されている場合は,図に描かれたk行の数を定義します (最後のk行から過去に戻ります) 。display(plot_display) コントロールは,図の位置を表示する.可能な値は:display.none、display.all。デフォルト値はdisplay.all。overlay(const bool) FMZプラットフォームの拡張のパラメータ,現在の関数を設定するために使用される. 主図 ((設定true) または副図 ((設定false) に描画図で表示される. 既定値はfalseである. このパラメータを指定しない場合は,次の通りstrategyまたはindicatorでoverlay参数設定についてstrategyまたはindicator設定されていません.overlay参数については,デフォルトの参数に従って処理します.
続きを見る
plotshape plotchar bgcolor
plotshape
グラフに視覚的な形状を描く.
plotshape(series, title, style, location, color, offset, text, textcolor, editable, size, show_last, display)
例として
            pine

            data = close >= open
plotshape(data, style=shape.xcross)
パラメータ
series(series bool) 形状として描かれた一連のデータ. location.absoluteを除くすべての位置値の bool 値の一連の集合として扱われる. 必要なパラメータ.title(const string) 図のタイトルstyle(input string) 図形のタイプ。可能な値は:shape.xcross,shape.cross,shape.triangleup,shape.triangledown,shape.flag,shape.circle,shape.arrowup,shape.arrowdown,shape.labelup,shape.labeldown,shape.square,shape.diamond。 既定値はshape.xcross。location(input string) 形はグラフ上の位置。可能な値は: location.abovebar,location.belowbar,location.top,location.bottom,location.absolute。デフォルト値は location.abovebar。color(series color) の形状の色。 'color = red'または'color =#ff001a'のような常数,そして 'color = close >= open ? green: red'のような複雑な式を使用できます。 任意のパラメータ。offset(series int) 特定の数のk行上で左へまたは右へ移動する形状。 既定値は0。text(const string) 文字は形状で表示する。 文字を複数行で,行間を '\n' 変換序列で区切る。 例: 'line one\nline two'。textcolor(series color) 文字の色。 'textcolor=red'または'textcolor=#ff001a'のような常数,そして'textcolor = close >= open ? green: red'のような複雑な式を使用できます。 任意のパラメータ。editable(const bool) true ならば,plotshape スタイルはフォーマットダイアログで編集できます。 標準値は true。show_last(input int) 設定されている場合は,図に描かれた形の数を定義します (最後のk行から過去に戻ります) 。size(const string) グラフ上の文字のサイズ。可能な値は: size.auto, size.tiny, size.small, size.normal, size.large, size.huge。デフォルト値はsize.auto。display(plot_display) コントロールは,図の位置を表示する.可能な値は:display.none、display.all。デフォルト値はdisplay.all。overlay(const bool) FMZプラットフォームの拡張のパラメータ,現在の関数を設定するために使用される. 主図 ((設定true) または副図 ((設定false) に描画図で表示される. 既定値はfalseである. このパラメータを指定しない場合は,次の通りstrategyまたはindicatorでoverlay参数設定についてstrategyまたはindicator設定されていません.overlay参数については,デフォルトの参数に従って処理します.
plotchar
グラフに与えられたUnicode文字を使って視覚的な形を描く。
plotchar(series, title, char, location, color, offset, text, textcolor, editable, size, show_last, display)
例として
            pine

            data = close >= open
plotchar(data, char='❄')
パラメータ
series(series bool) 形状として描かれた一連のデータ. location.absoluteを除くすべての位置値の bool 値の一連の集合として扱われる. 必要なパラメータ.title(const string) 図のタイトルchar(input string) 視覚形として使用される文字location(input string) 形はグラフ上の位置。可能な値は: location.abovebar,location.belowbar,location.top,location.bottom,location.absolute。デフォルト値は location.abovebar。color(series color) の形状の色。 'color = red'または'color =#ff001a'のような常数,そして 'color = close >= open ? green: red'のような複雑な式を使用できます。 任意のパラメータ。offset(series int) 特定の数のk行上で左へまたは右へ移動する形状。 既定値は0。text(const string) 文字は形状で表示する。 文字を複数行で,行間を '\n' 変換序列で区切る。 例: 'line one\nline two'。textcolor(series color) 文字の色。 'textcolor=red'または'textcolor=#ff001a'のような常数,そして'textcolor = close >= open ? green: red'のような複雑な式を使用できます。 任意のパラメータ。editable(const bool) trueであれば,plotcharスタイルはフォーマットダイアログで編集できます。 既定値はtrue。show_last(input int) 設定されている場合は,図面に描画される図数の定義 ((最後のk行から過去に戻る) 。size(const string) グラフ上の文字のサイズ。 可能な値は:size.auto,size.tiny,size.small,size.normal,size.large,size.huge。 既定値はsize.auto。display(plot_display) コントロールは,図の位置を表示する.可能な値は:display.none、display.all。デフォルト値はdisplay.all。overlay(const bool) FMZプラットフォームの拡張のパラメータ,現在の関数を設定するために使用される. 主図 ((設定true) または副図 ((設定false) に描画図で表示される. 既定値はfalseである. このパラメータを指定しない場合は,次の通りstrategyまたはindicatorでoverlay参数設定についてstrategyまたはindicator設定されていません.overlay参数については,デフォルトの参数に従って処理します.
plotcandle
グラフに<unk>を描いてください.
plotcandle(open, high, low, close, title, color, wickcolor, editable, show_last, bordercolor, display)
例として
            pine

            indicator("plotcandle example", overlay=true)
plotcandle(open, high, low, close, title='Title', color = open < close ? color.green : color.red, wickcolor=color.black)
パラメータ
open(series int/float) データの開いたシリーズを<unk>開いた値として使う。必要参数。high(series int/float) ハイシリーズのデータとして<unk>の高値。必要参数。low(series int/float) 低シリーズのデータは<unk>の低値として使用される. 必要パラメータ.close(series int/float) 閉じるk行の値としてシリーズデータを閉じる. 必要パラメータ.title(const string) plotcandleのタイトル。選択可能なパラメータ。color(series color) <unk>の色。 'color = red'または 'color =#ff001a'のような常数,そして 'color = close >= open ? green: red'のような複雑な表現を使用できます。 任意のパラメータ。wickcolor(series color) <unk>灯芯の色。1つの選択可能なパラメータ。editable(const bool) trueであれば,plotcandleのスタイルはフォーマットダイアログで編集できます。 既定値はtrue。show_last(input int) が設定されている場合は,図に描かれた<unk>数を定義します.bordercolor(series color) <unk>の枠の色。 任意のパラメータ。display(plot_display) コントロールは,図の位置を表示する.可能な値は:display.none、display.all。デフォルト値はdisplay.all。overlay(const bool) FMZプラットフォームの拡張のパラメータ,現在の関数を設定するために使用される. 主図 ((設定true) または副図 ((設定false) に描画図で表示される. 既定値はfalseである. このパラメータを指定しない場合は,次の通りstrategyまたはindicatorでoverlay参数設定についてstrategyまたはindicator設定されていません.overlay参数については,デフォルトの参数に従って処理します.
注記
<unk>値がNaNである場合,K線は表示される必要はありません.
オープン,ハイ,ロー,クローズの最大値は <unk>高<unk>,最小値は <unk>低<unk>に設定されます.
続きを見る
plotbar
plotarrow
グラフに上下に矢印を描画する.上向き矢印は,各正値指数に,下向き矢印は,各負値に描画する.指数がnaを返せば矢印は描画しない.矢印は異なる高さがあり,指数の絶対値が大きいほど,矢印は長くなっている.
plotarrow(series, title, colorup, colordown, offset, minheight, maxheight, editable, show_last, display)
例として
            codiff = close - open
plotarrow(codiff, colorup=color.new(color.teal,40), colordown=color.new(color.orange, 40), overlay=true)
パラメータ
series(series int/float) 矢印に描画するデータシリーズの。必要パラメータ。title(const string) 図のタイトルcolorup(series color) 上の矢印の色。オプションのパラメータ。colordown(series color) 下の矢印の色。オプションのパラメータ。offset(series int) 特定の数の K 線上で左または右に矢印を移動する。 既定値は 0。minheight(input int) ピクセル単位で最小可能な矢印の高さ。 既定値は5。maxheight(input int) 可能な最大矢印の高度をピクセル単位で. 既定値は100editable(const bool) trueであれば,plotarrowスタイルはフォーマットダイアログで編集できます。 既定値はtrue。show_last(input int) 設定されている場合は,図に描かれた矢印の数を定義します (最終k行から過去に戻る) 。display(plot_display) コントロールは,図の位置を表示する.可能な値は:display.none、display.all。デフォルト値はdisplay.all。overlay(const bool) FMZプラットフォームの拡張のパラメータ,現在の関数を設定するために使用される. 主図 ((設定true) または副図 ((設定false) に描画図で表示される. 既定値はfalseである. このパラメータを指定しない場合は,次の通りstrategyまたはindicatorでoverlay参数設定についてstrategyまたはindicator設定されていません.overlay参数については,デフォルトの参数に従って処理します.
続きを見る
plot plotshape plotchar barcolor bgcolor
array
array.pop
この関数は,配列から最後の要素を削除し,その値を返します.
array.pop(id)
例として
            pine

            // array.pop example
a = array.new_float(5,high)
removedEl = array.pop(a)
plot(array.size(a))
plot(removedEl)
返される値
削除された要素の値
パラメータ
id(any array type) アレイオブジェクト
続きを見る
array.new_float array.set array.push array.remove array.insert array.shift
array.shift
この関数は,配列の最初の要素を削除し,その値を返します.
array.shift(id)
例として
            pine

            // array.shift example
a = array.new_float(5,high)
removedEl = array.shift(a)
plot(array.size(a))
plot(removedEl)
返される値
削除された要素の値
パラメータ
id(any array type) アレイオブジェクト
続きを見る
array.unshift array.set array.push array.remove array.includes
array.unshift
この関数は,配列の初期位置に値を挿入します.
array.unshift(id, value)
例として
            pine

            // array.unshift example
a = array.new_float(5, 0)
array.unshift(a, open)
plot(array.get(a, 0))
パラメータ
id(any array type) アレイオブジェクトvalue(series <type of the array's elements>) は,配列の初期位置の値に追加されます.
続きを見る
array.shift array.set array.insert array.remove array.indexof
array.size
この関数は,配列内の要素の数を返します.
array.size(id)
例として
            pine

            // array.size example
a = array.new_float(0)
for i = 0 to 9
    array.push(a, close[i])
// note that changes in slice also modify original array
slice = array.slice(a, 0, 5)
array.push(slice, open)
// size was changed in slice and in original array
plot(array.size(a))
plot(array.size(slice))
返される値
配列の要素の数
パラメータ
id(any array type) アレイオブジェクト
続きを見る
array.new_float array.sum array.slice array.sort
array.slice
この関数は,既存の配列から分片を作成します. 分片内のオブジェクトが変更された場合,その変更は,新しい配列と元の配列に同時に適用されます.
array.slice(id, index_from, index_to)
例として
            pine

            // array.slice example
a = array.new_float(0)
for i = 0 to 9
    array.push(a, close[i])
// take elements from 0 to 4
// *note that changes in slice also modify original array
slice = array.slice(a, 0, 5)
plot(array.sum(a) / 10)
plot(array.sum(slice) / 5)
返される値
配列の断片の浅いコピー
パラメータ
id(any array type) アレイオブジェクトindex_from(series int) ゼロから始まるインデックスから抽出を開始する.index_to(series int) ゼロから始まるインデックスは,抽出が完了する前に. この関数は,このインデックス前の要素を抽出する.
続きを見る
array.new_float array.get array.sort
array.abs
元の配列の各要素の絶対値を含む配列を返します.
array.abs(id)
パラメータ
id(int[]/float[]) 配列オブジェクト
続きを見る
array.new_float array.insert array.slice array.reverse order.ascending order.descending
array.binary_search
この関数は値のインデックスを返し,その値が見つからない場合は -1 を返します. 検索する配列は昇進順序で排列する必要があります.
array.binary_search(id, val)
例として
            pine

            // array.binary_search
a = array.from(5, -2, 0, 9, 1)
array.sort(a) // [-2, 0, 1, 5, 9]
position = array.binary_search(a, 0) // 1
plot(position)
パラメータ
id(int[]/float[]) 配列オブジェクトval(series int/float) 配列で検索する値
注記
バイナリ検索は,昇進順序で事前に排列された配列に適用されます。まずは,配列の中間にある要素を目標値と比較します。もし要素が目標値と一致すれば,その位置を配列に返します。もし要素の値が目標値より大きいなら,配列の下半部で検索を続ける。もし要素の値が目標値より小さいなら,配列の上半部で検索を続ける。この操作をリケージ的に実行することで,このアルゴリズムは,配列の目標値が置けない小さな部分を徐々に排除します。
続きを見る
array.new_float array.insert array.slice array.reverse order.ascending order.descending
array.binary_search_leftmost
値が見つかったら,その値のインデックスを返します. 値が見つからなかったら,次の最小の要素のインデックスを返します. もしそれが配列にあるなら,その値の位置の左側にあります. 検索する配列は,上昇順序で排列する必要があります.
array.binary_search_leftmost(id, val)
例として
            pine

            // array.binary_search_leftmost
a = array.from(5, -2, 0, 9, 1)
array.sort(a) // [-2, 0, 1, 5, 9]
position = array.binary_search_leftmost(a, 3) // 2
plot(position)
パラメータ
id(int[]/float[]) 配列オブジェクトval(series int/float) 配列で検索する値
注記
バイナリ検索は,昇進順序で事前に排列された配列に適用されます。まずは,配列の中間にある要素を目標値と比較します。もし要素が目標値と一致すれば,その位置を配列に返します。もし要素の値が目標値より大きいなら,配列の下半部で検索を続ける。もし要素の値が目標値より小さいなら,配列の上半部で検索を続ける。この操作をリケージ的に実行することで,このアルゴリズムは,配列の目標値が置けない小さな部分を徐々に排除します。
続きを見る
array.new_float array.insert array.slice array.reverse order.ascending order.descending
array.binary_search_rightmost
値が見つかったら,その値のインデックスを返します. 値が見つからなかったら,その値が配列の位置の右側にある要素のインデックスを返します. 配列は昇進順序で並べなければなりません.
array.binary_search_rightmost(id, val)
例として
            pine

            // array.binary_search_rightmost
a = array.from(5, -2, 0, 9, 1)
array.sort(a) // [-2, 0, 1, 5, 9]
position = array.binary_search_rightmost(a, 3) // 3
plot(position)
パラメータ
id(int[]/float[]) 配列オブジェクトval(series int/float) 配列で検索する値
注記
バイナリ検索は,並べられた配列を昇進順で動作する. まず,配列の中間にある要素をターゲット値と比較する. 要素がターゲット値と一致すれば,その位置を配列に返します. 要素の値がターゲット値より大きい場合は,配列の下半部で検索を続ける. 要素の値がターゲット値より小さい場合は,配列の上半部で検索を続ける. 繰り返してこの操作を実行することで,このアルゴリズムは,配列のターゲット値が置かれない小さな部分を徐々に排除する.
続きを見る
array.new_float array.insert array.slice array.reverse order.ascending order.descending
array.sort
この関数は,配列の要素を並べ替えます.
array.sort(id, order)
例として
            pine

            // array.sort example
a = array.new_float(0,0)
for i = 0 to 5
    array.push(a, high[i])
array.sort(a, order.descending)
if barstate.islast
    runtime.log(str.tostring(a))
パラメータ
id(int[]/float[]/string[]) 配列オブジェクトorder(sort_order) 排列順序:order.ascending (デフォルト) またはorder.descending。
続きを見る
array.new_float array.insert array.slice array.reverse order.ascending order.descending
array.sort_indices
インデックスされた配列を返し,原配列をインデックスするために使用すると,その順序順にその要素にアクセスする.それは原配列を修正しない.
array.sort_indices(id, order)
例として
            pine

            // array.sort_indices
a = array.from(5, -2, 0, 9, 1)
sortedIndices = array.sort_indices(a) // [1, 2, 4, 0, 3]
indexOfSmallestValue = array.get(sortedIndices, 0) // 1
smallestValue = array.get(a, indexOfSmallestValue) // -2
plot(smallestValue)
パラメータ
id(int[]/float[]/string[]) 配列オブジェクトorder(sort_order) 順序順序:order.ascendingまたは order.descending。選択可。デフォルトは order.ascending。
続きを見る
array.new_float array.insert array.slice array.reverse order.ascending order.descending
array.clear
この関数は,配列からすべての要素を削除します.
array.clear(id)
例として
            pine

            // array.clear example
a = array.new_float(5,high)
array.clear(a)
array.push(a, close)
plot(array.get(a,0))
plot(array.size(a))
パラメータ
id(any array type) アレイオブジェクト
続きを見る
array.new_float array.insert array.push array.remove array.pop
array.concat
この関数は,2つの配列を合体するために用いられる.これは,すべての要素を第2の配列から第1の配列に押し,そして第1の配列に戻す.
array.concat(id1, id2)
例として
            pine

            // array.concat example
a = array.new_float(0,0)
b = array.new_float(0,0)
for i = 0 to 4
    array.push(a, high[i])
    array.push(b, low[i])
c = array.concat(a,b)
plot(array.size(a))
plot(array.size(b))
plot(array.size(c))
返される値
最初の配列には,第二の配列からの結合要素がある.
パラメータ
id1(any array type) 最初の配列のオブジェクトid2(any array type) 2番目の配列のオブジェクト
続きを見る
array.new_float array.insert array.slice
array.copy
この関数は,既存の配列のコピーを作成します.
array.copy(id)
例として
            pine

            // array.copy example
length = 5
a = array.new_float(length, close)
b = array.copy(a)
a := array.new_float(length, open)
plot(array.sum(a) / length)
plot(array.sum(b) / length)
返される値
配列のコピー
パラメータ
id(any array type) アレイオブジェクト
続きを見る
array.new_float array.get array.slice array.sort
array.stdev
この関数は,配列要素の標準差を返します.
array.stdev(id, biased)
例として
            pine

            // array.stdev example
a = array.new_float(0)
for i = 0 to 9
    array.push(a, close[i])
plot(array.stdev(a))
返される値
配列の要素の標準は違う.
パラメータ
id(int[]/float[]) 配列オブジェクトbiased(series bool) どの推定値を使うべきかを決定する. 選択する. 既定値は true.
注記
その場合biasedtrueであれば,関数は全体全体に対する偏見のある見積もりを使って計算し,falseであれば,サンプルに対する偏見のない見積もりを使って計算する.
続きを見る
array.new_float array.max array.min array.avg
array.standardize
この関数は,標準化された要素の配列を返します.
array.standardize(id)
例として
            pine

            // array.standardize example
a = array.new_float(0)
for i = 0 to 9
    array.push(a, close[i])
b = array.standardize(a)
plot(array.min(b))
plot(array.max(b))
返される値
標準化要素の配列
パラメータ
id(int[]/float[]) 配列オブジェクト
続きを見る
array.max array.min array.mode array.avg array.variance array.stdev
array.variance
この関数は,配列要素の差分を返します.
array.variance(id, biased)
例として
            pine

            // array.variance example
a = array.new_float(0)
for i = 0 to 9
    array.push(a, close[i])
plot(array.variance(a))
返される値
配列の要素の平方差
パラメータ
id(int[]/float[]) 配列オブジェクトbiased(series bool) どの推定値を使うべきかを決定する. 選択する. 既定値は true.
注記
その場合biasedtrueであれば,関数は全体全体に対する偏見のある見積もりを使って計算し,falseであれば,サンプルに対する偏見のない見積もりを使って計算する.
続きを見る
array.new_float array.stdev array.min array.avg array.covariance
array.covariance
この関数は,2つの配列の協方差を返します.
array.covariance(id1, id2, biased)
例として
            pine

            // array.covariance example
a = array.new_float(0)
b = array.new_float(0)
for i = 0 to 9
    array.push(a, close[i])
    array.push(b, open[i])
plot(array.covariance(a, b))
返される値
この2つの配列の対方差は
パラメータ
id1(int[]/float[]) 配列オブジェクトid2(int[]/float[]) 配列オブジェクトbiased(series bool) どの推定値を使うべきかを決定する. 選択する. 既定値は true.
注記
その場合biasedtrueであれば,関数は全体全体に対する偏見のある見積もりを使って計算し,falseであれば,サンプルに対する偏見のない見積もりを使って計算する.
続きを見る
array.new_float array.max array.stdev array.avg array.variance
array.fill
この関数は,配列の要素を単一の値に設定する。インデックスが指定されていない場合は,すべての要素を設定する。初期インデックスのみが提供されている場合 (デフォルトは0),そのインデックスから始まる要素を設定する。同時に2つのインデックスパラメータを使用している場合は,開始からインデックスされるものの,終了インデックスを含まない要素を設定する (デフォルトはna).
array.fill(id, value, index_from, index_to)
例として
            pine

            // array.fill example
a = array.new_float(10)
array.fill(a, close)
plot(array.sum(a))
パラメータ
id(any array type) アレイオブジェクトvalue(series <type of the array's elements>) は,配列を埋めることに用いられる値である.index_from(series int) 初期インデックス,デフォルトは0。index_to(series int) 終了インデックス,デフォルトはna。 設定する最後の要素のインデックスより大きくなければならない。
続きを見る
array.new_float array.set array.slice
array.includes
この関数は,配列でこの値が見つかった場合,true を返し,そうでない場合は,false を返します.
array.includes(id, value)
例として
            pine

            // array.includes example
a = array.new_float(5,high)
p = close
if array.includes(a, high)
    p := open
plot(p)
返される値
配列でこの値が見つかった場合,true,そうでない場合は,false。
パラメータ
id(any array type) アレイオブジェクトvalue(series <type of the array's elements>) 配列で検索する値
続きを見る
array.new_float array.indexof array.shift array.remove array.insert
array.insert
この関数は,適切な位置に新しい要素を追加することで,配列の内容を変更します.
array.insert(id, index, value)
例として
            pine

            // array.insert example
a = array.new_float(5, close)
array.insert(a, 0, open)
plot(array.get(a, 5))
パラメータ
id(any array type) アレイオブジェクトindex(series int) 挿入値のインデックスvalue(series <type of the array's elements>) 配列に追加する値
続きを見る
array.new_float array.set array.push array.remove array.pop array.unshift
array.join
この関数は,指定された分離符の文字列で区切られた,配列のすべての要素を接続して新しい文字列を構築し,返します.
array.join(id, separator)
例として
            pine

            // array.join example
a = array.new_float(5, 5)
runtime.log(array.join(a, ","))
パラメータ
id(int[]/float[]/string[]) 配列オブジェクトseparator(series string) 配列の各要素を分離する文字列.
続きを見る
array.new_float array.set array.insert array.remove array.pop array.unshift
array.lastindexof
この関数は,値が最後に出現したインデックスを返します. 値が見つからない場合は, -1 を返します.
array.lastindexof(id, value)
例として
            pine

            // array.lastindexof example
a = array.new_float(5,high)
index = array.lastindexof(a, high)
plot(index)
返される値
元素のインデックス
パラメータ
id(any array type) アレイオブジェクトvalue(series <type of the array's elements>) 配列で検索する値
続きを見る
array.new_float array.set array.push array.remove array.insert
array.max
この関数は,最大値,または,与えられた配列のn番目の最大値を返します.
array.max(id, nth)
例として
            pine

            // array.max
a = array.from(5, -2, 0, 9, 1)
secondHighest = array.max(a, 2) // 1
plot(secondHighest)
返される値
配列の最大値またはn番目の最大値
パラメータ
id(int[]/float[]) 配列オブジェクトnth(series int) の最大値のn番目の値が返され,その最大値は0である. 任意. 既定は0である.
続きを見る
array.new_float array.min array.sum
array.min
この関数は,最小値,または与えられた序列のn番目の最小値を返します.
array.min(id, nth)
例として
            pine

            // array.min
a = array.from(5, -2, 0, 9, 1)
secondLowest = array.min(a, 1) // 0
plot(secondLowest)
返される値
配列の最小値またはn番目の最小値である。
パラメータ
id(int[]/float[]) 配列オブジェクトnth(series int) 返されるn番目の最小値で,0は最小値である。選択する。0はデフォルトである。
続きを見る
array.new_float array.max array.sum
array.median
この関数は,配列の要素の中位数を返します.
array.median(id)
例として
            pine

            // array.median example
a = array.new_float(0)
for i = 0 to 9
    array.push(a, close[i])
plot(array.median(a))
返される値
配列の元素の中位数である.
パラメータ
id(int[]/float[]) 配列オブジェクト
続きを見る
array.avg array.variance array.min
array.mode
この関数は,配列の要素のパターンを返します. 複数の値が同じ周波数を持つ場合は,最小値を返します.
array.mode(id)
例として
            pine

            // array.mode example
a = array.new_float(0)
for i = 0 to 9
    array.push(a, close[i])
plot(array.mode(a))
返される値
配列の要素のパターン
パラメータ
id(int[]/float[]) 配列オブジェクト
続きを見る
array.new_float array.avg array.variance array.min
array.percentile_linear_interpolation
指定された数列値の百分比 (百分位数) がその値より小さいか等しいことを返し,線形挿入値を使用する。
array.percentile_linear_interpolation(id, percentage)
パラメータ
id(int[]/float[]) 配列オブジェクトpercentage(series int/float) 返される値の値のパーセントに等しいか未満でなければならない.
注記
統計学では,パーセントとは,特定のスコアまたは特定のスコア以下に現れるランキング項目の数パーセントである.この測定は,あなたが測定したパーセントの位よりも低い標準周波数分布の百分数の割合を示している.線形間隔値は,2つのランキングの間の値を推定している.
続きを見る
array.new_float array.insert array.slice array.reverse order.ascending order.descending
array.percentile_nearest_rank
最近の順位法を使用して,指定されたパーセントの数列値 ((百分位数) が,その値より小さいまたは等しい値を返します。
array.percentile_nearest_rank(id, percentage)
パラメータ
id(int[]/float[]) 配列オブジェクトpercentage(series int/float) 返される値の値のパーセントに等しいか未満でなければならない.
注記
統計学では,パーセントは,特定の分数または特定の分数以下に現れるランキング項目の数パーセントである.この測定は,あなたが測定しているパーセントランキングの標準周波数分布の百分比を示している.
続きを見る
array.new_float array.insert array.slice array.reverse order.ascending order.descending
array.percentrank
配列の中央値の百分位順を返します.
array.percentrank(id, index)
パラメータ
id(int[]/float[]) 配列オブジェクトindex(series int) は,その百分位順位の値を計算する。
注記
百分位順位は,配列のどれだけの要素が参照値より小さいか,またはそれと同等であるかのパーセントである.
続きを見る
array.new_float array.insert array.slice array.reverse order.ascending order.descending
array.range
この関数は,与えられた配列の最小値と最大値の間の差を返します.
array.range(id)
例として
            pine

            // array.range example
a = array.new_float(0)
for i = 0 to 9
    array.push(a, close[i])
plot(array.range(a))
返される値
配列の最小値と最大値の間の差
パラメータ
id(int[]/float[]) 配列オブジェクト
続きを見る
array.new_float array.min array.max array.sum
array.remove
この関数は,指定されたインデックスを持つ要素を削除することで,配列の内容を変更します.
array.remove(id, index)
例として
            pine

            // array.remove example
a = array.new_float(5,high)
removedEl = array.remove(a, 0)
plot(array.size(a))
plot(removedEl)
返される値
削除された要素の値
パラメータ
id(any array type) アレイオブジェクトindex(series int) 削除する要素のインデックス
続きを見る
array.new_float array.set array.push array.insert array.pop array.shift
array.reverse
この関数は配列を反転する。最初の配列要素が最後の配列要素になり,最後の配列要素が最初の配列要素となる。
array.reverse(id)
例として
            pine

            // array.reverse example
a = array.new_float(0)
for i = 0 to 9
    array.push(a, close[i])
plot(array.get(a, 0))
array.reverse(a)
plot(array.get(a, 0))
パラメータ
id(any array type) アレイオブジェクト
続きを見る
array.new_float array.sort array.push array.set array.avg
array.from
この関数は,int,float,bool,string,line,color,linefill のいずれかのタイプの変数数のパラメータを採用し,対応するタイプの配列を返します.
array.from(arg0, arg1, ...)
例として
            pine

            // array.from_example
arr = array.from("Hello", "World!") // arr (string[]) will contain 2 elements: {Hello}, {World!}.
plot(close)
返される値
配列の要素の値
パラメータ
arg0, arg1, ...(series int/float/bool/color/string/line/linefill) 数列のパラメータについて
array.new
この関数は,新しい<type>エレメント配列オブジェクト。
array.new(size, initial_value)
例として
            pine

            // array.new<string> example
a = array.new<string>(1, "Hello, World!")
runtime.log(array.get(a, 0))
例として
            pine

            // array.new<color> example
a = array.new<color>()
array.push(a, color.red)
array.push(a, color.green)
plot(close, color = array.get(a, close > open ? 1 : 0))
例として
            pine

            // array.new<float> example
length = 5
var a = array.new<float>(length, close)
if array.size(a) == length
  array.remove(a, 0)
  array.push(a, close)
plot(array.sum(a) / length, "SMA")
例として
            pine

            // array.new<line> example
// draw last 15 lines
var a = array.new<line>()
array.push(a, line.new(bar_index - 1, close[1], bar_index, close))
if array.size(a) > 15
    ln = array.shift(a)
    line.delete(ln)
返される値
他の配列と一緒に使用できる配列オブジェクトのID。*() 関数
パラメータ
size(series int) 序列の初期サイズ。選択可能です。デフォルトは0。initial_value(series <type>) すべてのシーケンス要素の初期値。選択可能です。デフォルトは<unk>na<unk>。
注記
配列のインデックスは 0 から始まる.
配列を初期化し,同時にそのすべての要素を指定するには,関数 array.from を使います.
続きを見る
array.from array.push array.get array.size array.remove array.shift array.sum
array.new_bool
この関数は,bool型の要素からなる新しい配列オブジェクトを作成します.
array.new_bool(size, initial_value)
例として
            pine

            // array.new_bool example
length = 5
a = array.new_bool(length, close > open)
plot(array.get(a, 0) ? close : open)
返される値
他の配列と一緒に使用できる配列オブジェクトのID。*() 関数
パラメータ
size(series int) 序列の初期サイズ。選択可能です。デフォルトは0。initial_value(series bool) すべてのシーケンス要素の初期値。可選。デフォルトは<unk>na<unk>。
注記
配列のインデックスは 0 から始まる.
続きを見る
array.new_float array.get array.slice array.sort
array.new_float
この関数は,新しい浮点型の要素配列オブジェクトを作成します.
array.new_float(size, initial_value)
例として
            pine

            // array.new_float example
length = 5
a = array.new_float(length, close)
plot(array.sum(a) / length)
返される値
他の配列と一緒に使用できる配列オブジェクトのID。*() 関数
パラメータ
size(series int) 序列の初期サイズ。選択可能です。デフォルトは0。initial_value(series int/float) すべてのシーケンス要素の初期値。可選。デフォルトは<unk>na<unk>。
注記
配列のインデックスは 0 から始まる.
続きを見る
array.new_bool array.get array.slice array.sort
array.new_int
この関数は,int 型の要素からなる新しい配列オブジェクトを作成します.
array.new_int(size, initial_value)
例として
            pine

            // array.new_int example
length = 5
a = array.new_int(length, int(close))
plot(array.sum(a) / length)
返される値
他の配列と一緒に使用できる配列オブジェクトのID。*() 関数
パラメータ
size(series int) 序列の初期サイズ。選択可能です。デフォルトは0。initial_value(series int) すべてのシーケンスの要素の初期値。可選。デフォルトは<unk>na<unk>。
注記
配列のインデックスは 0 から始まる.
続きを見る
array.new_float array.get array.slice array.sort
array.new_string
この関数は,文字列の種類要素の新しい配列オブジェクトを作成します。
array.new_string(size, initial_value)
例として
            pine

            // array.new_string example
length = 5
a = array.new_string(length, "text")
runtime.log(array.get(a, 0))
返される値
他の配列と一緒に使用できる配列オブジェクトのID。*() 関数
パラメータ
size(series int) 序列の初期サイズ。選択可能です。デフォルトは0。initial_value(series string) すべてのシーケンスの要素の初期値。可選。デフォルトは<unk>na<unk>。
注記
配列のインデックスは 0 から始まる.
続きを見る
array.new_float array.get array.slice
array.get
この関数は,指定されたインデックス位置の要素の値を返します.
array.get(id, index)
例として
            pine

            // array.get example
a = array.new_float(0)
for i = 0 to 9
  array.push(a, close[i] - open[i])
plot(array.get(a, 9))
返される値
配列の要素の値
パラメータ
id(any array type) アレイオブジェクトindex(series int) その値の要素のインデックスを返します.
続きを見る
array.new_float array.set array.slice array.sort
array.push
この関数は,配列に1つの値を付加します.
array.push(id, value)
例として
            pine

            // array.push example
a = array.new_float(5, 0)
array.push(a, open)
plot(array.get(a, 5))
パラメータ
id(any array type) アレイオブジェクトvalue(series <type of the array's elements>) は,配列の末尾の要素値に追加されます.
続きを見る
array.new_float array.set array.insert array.remove array.pop array.unshift
array.set
この関数は,要素の値を指定されたインデックスに設定します.
array.set(id, index, value)
例として
            pine

            // array.set example
a = array.new_float(10)
for i = 0 to 9
  array.set(a, i, close[i])
plot(array.sum(a) / 10)
パラメータ
id(any array type) アレイオブジェクトindex(series int) 要素のインデックスを変更する。value(series <type of the array's elements>) 設定する新しい値
続きを見る
array.new_float array.get array.slice
array.sum
この関数は,配列の要素の合計を返します.
array.sum(id)
例として
            pine

            // array.sum example
a = array.new_float(0)
for i = 0 to 9
  array.push(a, close[i])
plot(array.sum(a))
返される値
配列の要素の合計
パラメータ
id(int[]/float[]) 配列オブジェクト
続きを見る
array.new_float array.max array.min
array.avg
この関数は,配列要素の平均値を返します.
array.avg(id)
例として
            pine

            // array.avg example
a = array.new_float(0)
for i = 0 to 9
  array.push(a, close[i])
plot(array.avg(a))
返される値
配列の要素の平均値
パラメータ
id(int[]/float[]) 配列オブジェクト
続きを見る
array.new_float array.max array.min array.stdev
array.indexof
この関数は,値が最初に出現したインデックスを返します. 値が見つからない場合は, -1 を返します.
array.indexof(id, value)
例として
            pine

            // array.indexof example
a = array.new_float(5,high)
index = array.indexof(a, high)
plot(index)
返される値
元素のインデックス
パラメータ
id(any array type) アレイオブジェクトvalue(series <type of the array's elements>) 配列で検索する値
続きを見る
array.lastindexof array.get array.lastindexof array.remove array.insert
strategy
存在するstrategy関連する内置関数では,ストップポイント数,ストップストップポイント数とは,価格の跳躍の倍数として定義される.例えばstrategy.exitこれは,関数でprofit、lossパラメータは,停止,停止,パラメータを表すprofit10に設定すると,価格のジャンプを10で止めて,価格のジャンプは内置変数になります.syminfo.mintick。
strategy
この関数は,複数の策略属性を設定します.
参考文献のみtitle,shorttitle,overlay,pyramiding,default_qty_type,default_qty_valueパラメータ,その他のパラメータはPINE言語のポリシーのインターフェースパラメータで設定できます.
strategy(title, shorttitle, overlay, format, precision, scale, pyramiding, calc_on_order_fills, calc_on_every_tick, max_bars_back, backtest_fill_limits_assumption, default_qty_type, default_qty_value, initial_capital, currency, slippage, commission_type, commission_value, process_orders_on_close, close_entries_rule, margin_long, margin_short, explicit_plot_zorder, max_lines_count, max_labels_count, max_boxes_count, risk_free_rate)
例として
            pine

            strategy("Strategy", overlay = true)

// Enter long by market if current open is greater than previous high.
strategy.entry("Long", strategy.long, 1, when = open > high[1])
// Generate a full exit bracket (profit 10 points, loss 5 points per contract) from the entry named "Long".
strategy.exit("Exit", "Long", profit = 10, loss = 5)
パラメータ
title(const string) 指数/策略のプラグインに表示される指数タイトル 。参数が必要。shorttitle(const string) グラフのイラストで見られる指標の短いタイトル。パラメータは選択できます。overlay(const bool) trueなら,その指標はメインシリーズのオーバーレイとして追加されます. falseなら,それは別々のグラフウィンドウに追加されます. 既定はfalseです.formatprecisionscalepyramiding(const int) 同じ方向で許可される最大数.この値が 0 であれば,同じ方向で 1 つの入口注文しか開けられず,他の入口注文は拒否されます.calc_on_order_fillscalc_on_every_tickmax_bars_backbacktest_fill_limits_assumptiondefault_qty_typeこのコンスト ストリングはqty参数値の値は,strategy.entry または strategy.order 関数で表示される内容である.可能な値は:strategy.fixed は,契約/株式/手数料を表し,strategy.cash は,貨幣の金額を表し,またはstrategy.percent_of_equity は,利用可能な権利利権のパーセントを表します.default_qty_value(const int/float) strategy.entryまたはstrategy.order関数のデフォルトの取引数,その単位は,その'qty'パラメータが定義されていないとき,その'default_qty_type'パラメータと併用されるパラメータによって決定される。currencyslippagecommission_typecommission_valueprocess_orders_on_closeclose_entries_rulemax_lines_countmax_labels_countmax_boxes_countmargin_longmargin_shortexplicit_plot_zorderinitial_capitalrisk_free_rate
注記
戦略スクリプトには, 戦略の呼び出しがなければならない.
パラメータcalc_on_every_tick = trueを使用したPineScriptコードは,履歴とリアルタイムデータに対して異なる計算を行うことができます.
非標準のチャートタイプを戦略の基礎として使用すると,結果が異なることを知っておく必要があります. 注文は,そのチャートの価格で実行されます (例えば,Heikin AshiはHeikin Ashiの価格を使用します.
続きを見る
indicator
strategy.entry
これは,入場命令である。同じIDを持つ注文が既に掛かっている場合,注文を修正することができる。指定IDの注文がない場合,新しい注文が発行される。入場指示を停止するには,命令strategy.cancelまたはstrategy.cancel_allを使うべきである。関数strategy.orderと比較して,strategy.entry機能はピラミッドに影響され,市場位置を正しく逆転することができる。<unk>Limit<unk>と<unk>stop<unk>のパラメータが両方<unk>NaN<unk>である場合,注文タイプは市場注文である。
strategy.entry(id, direction, qty, limit, stop, oca_name, oca_type, comment, when, alert_message)
例として
            pine

            strategy(title = "simple strategy entry example")
strategy.entry("enter long", strategy.long, 1, when = open > high[1]) // enter long by market if current open great then previous high
strategy.entry("enter short", strategy.short, 1, when = open < low[1]) // enter short by market if current open less then previous low
パラメータ
id(series string) 必要パラメータ。 注文識別子。 注文をキャンセルまたは変更するには,その識別子を引用する。direction(strategy_direction) 一つの必須パラメータ. 市場持仓方向: 'strategy.long'は多頭, 'strategy.short'は空頭.qty(series int/float) 選択可能なパラメータ。取引された契約/株数/時間数/単位数。デフォルト値は'NaN'。limit(series int/float) 選択可能なパラメータ。注文の制限価格。指定された場合,注文タイプは"limit"または"stop-limit"。他の注文タイプは"NaN"。stop(series int/float) 選択可能なパラメータ。注文のストップ・コスト。指定された場合,注文タイプは"stop"または"stop-limit"。他の注文タイプは"NaN"。oca_nameoca_typecomment(series string) 選択可能なパラメータ。注文の他の説明。when(series bool) 選択可能なパラメータ。注文の状態。"true"なら注文が置かれる。"false"なら何も起こらない。以前に置かれた同じIDの注文は撤回されない。デフォルト値は"true"。alert_message(series string) アラレットを作成するダイアログのアラレットのメッセージ欄に{{strategy.order.alert_message}}の位置符を使用する際のオプションのパラメータである。
strategy.close
これは指定IDの退出注文の命令である。同じIDの入口注文が複数ある場合,それらは同時に退出する。命令が発動される時に指定IDの開設注文がない場合,命令は効力を生じない。この命令は市場注文を使用する。各入口は別々の市場注文によって閉鎖される。
strategy.close(id, when, comment, qty, qty_percent, alert_message)
例として
            pine

            strategy("closeEntry Demo", overlay=false)
strategy.entry("buy", strategy.long, when = open > close)
strategy.close("buy", when = open < close, qty_percent = 50, comment = "close buy entry for 50%")
plot(strategy.position_size)
パラメータ
id(series string) 必要なパラメータ。 注文識別子。 注文を,その識別子を引用して閉じることができる。when(series bool) 選択可能なパラメータ。コマンドの条件。qty(series int/float) 選択可能なパラメータ。退出取引の契約/株数/時間数/単位数。デフォルト値は'NaN'。qty_percent(series int/float) 平仓のパーセントを定義する ((0-100) 。その優先度が'qty'のパラメータの優先度より低い。選択可能です。デフォルト値は100。comment(series string) 選択可能なパラメータ。注文の他の説明。alert_message(series string) アラレットを作成するダイアログのアラレットのメッセージ欄に{{strategy.order.alert_message}}の位置符を使用する際のオプションのパラメータである。
strategy.close_all
市場を平らにするため,現在の市場ポジションを退出する.
strategy.close_all(when, comment, alert_message)
例として
            pine

            strategy("closeAll Demo", overlay=false)
strategy.entry("buy", strategy.long, when = open > close)
strategy.close_all(when = open < close, comment = "close all entries")
plot(strategy.position_size)
パラメータ
when(series bool) 選択可能なパラメータ。コマンドの条件。comment(series string) 選択可能なパラメータ。注文の他の説明。alert_message(series string) アラレットを作成するダイアログのアラレットのメッセージ欄に{{strategy.order.alert_message}}の位置符を使用する際のオプションのパラメータである。
strategy.exit
これは,エントリー指定または市場全体の地位を退出する命令である.同じIDの注文が既に掛かっている場合,注文を修正することができる.エントリー注文が取引されていないが,退出注文が現れた場合,退出注文は,エントリー注文が取引された後に退出注文が置かれるまで一時的に保留される.退出注文を停止するには,strategy.cancelまたはstrategy.cancel_allの命令を使用する.
strategy.exit(id, from_entry, qty, qty_percent, profit, limit, loss, stop, trail_price, trail_points, trail_offset, oca_name, comment, when, alert_message)
例として
            pine

            strategy(title = "simple strategy exit example")
strategy.entry("long", strategy.long, 1, when = open > high[1]) // enter long by market if current open great then previous high
strategy.exit("exit", "long", profit = 10, loss = 5) // generate full exit bracket (profit 10 points, loss 5 points per contract) from entry with name "long"
パラメータ
id(series string) 必要パラメータ。 注文識別子。 注文をキャンセルまたは変更するには,その識別子を引用する。from_entry(series string) 選択可能なパラメータ。入場指令識別子指定で退出。すべてのポジションを退出するには空の文字列を使用すべきである。空の文字列がデフォルトである。qty(series int/float) 選択可能なパラメータ。退出取引の契約/株数/時間数/単位数。デフォルト値は'NaN'。qty_percent(series int/float) 平仓のパーセントを定義する ((0-100) 。その優先度が'qty'のパラメータの優先度より低い。選択可能です。デフォルト値は100。profit(series int/float) 選択可能なパラメータ。 利益目標 ((ポイントで表示) 。 指定された場合,指定された利益額 ((ポイント) を達成すると,制限価格の注文で市場から退出する。 既定値は<unk>NaN<unk>。limit(series int/float) 選択可能なパラメータ. 利益目標 (価格を指定する) 指定された場合,指定された価格 (またはそれ以上) で退出する. パラメータ'limit'の優先度がパラメータ'profit'の優先度より高い. 値が'NaN'でない場合, 'limit'が'profit'を代わる). 既定値は<unk>NaN<unk>である.loss(series int/float) 選択可能なパラメータ。 ストップ・損失 (ポイントで表示される) ・・・ 指定された場合,指定された損失額 (ポイントで表示される) が達成されたときに,ストップ・損失の1枚で市場から退出する。 既定値は<unk>NaN<unk>。stop(series int/float) 選択可能なパラメータ。止損 (価格を指定する) ・・・指定された場合,指定された価格 (またはそれより劣る) で市場から退出する。パラメータ『止損』の優先度がパラメータ『損失』の優先度より高い。値が'NaN'でない場合, '止損'は'損失'の代わりに). 既定値は<unk>NaN<unk>。trail_price(series int/float) 選択可能なパラメータ。トラッキングストップのアクティベーションレベル。 (価格を指定する必要があります) ・・・指定された場合,指定された価格レベルに達するとトラッキングストップが配置されます。 トラッキングストップの初期価格の偏移を決定するために<unk>trail_offset<unk>パラメータで指定されます。 (ポイントで計上):多頭退出するためにアクティベーションレベルより低いXポイント; 空頭退出するためにアクティベーションレベルより高いXポイント。 空頭退出のためのデフォルト値は<unk>NaN<unk>。trail_points(series int/float) 選択可能なパラメータ. ストップオフのアクティベーションレベルを追跡する. 利潤を点で表示する. 指定された場合,計算された価格レベルに達すると, ストップオフを配置する. ストップオフの初期価格を追跡する偏移を決定するために, <unk>trail_offset<unk>パラメータで指定する.trail_offset(series int/float) 選択可能なパラメータ. 追跡ストップアクティベーションレベル (点で表す). 追跡ストップの初期価格を決定するために,点で表す偏移量:多頭退出のために"trail_price"または"trail_points"より低いXポイント; 空頭退出のために"trail_price"または"trail_points"より高いXポイント. 既定値は<unk>NaN<unk>.oca_namecomment(series string) 選択可能なパラメータ。注文の他の説明。when(series bool) 選択可能なパラメータ。注文の状態。"true"なら注文が置かれる。"false"なら何も起こらない。以前に置かれた同じIDの注文は撤回されない。デフォルト値は"true"。alert_message(series string) アラレットを作成するダイアログのアラレットのメッセージ欄に{{strategy.order.alert_message}}の位置符を使用する際のオプションのパラメータである。
strategy.cancel
これは,引用名の名前で,すべての予約リストをキャンセル/無効にするコマンドで,次の機能によって生成されます:strategy.order, strategy.entry and strategy.exit。
strategy.cancel(id, when)
例として
            pine

            strategy(title = "simple order cancellation example")
conditionForBuy = open > high[1]
strategy.entry("long", strategy.long, 1, limit = low, when = conditionForBuy) // enter long using limit order at low price of current bar if conditionForBuy is true
strategy.cancel("long", when = not conditionForBuy) // cancel the entry order with name "long" if conditionForBuy is false
パラメータ
id(series string) 必須パラメータ。注文のID。注文を撤回するためにこのIDを配置する。when(series bool) 選択可能なパラメータ。 ID に基づいて注文をキャンセル。 "true"であれば,注文はキャンセルされます。 既定値は"true"。
strategy.cancel_all
これは,strategy.order,strategy.entry,およびstrategy.exitによって生成される,すべての予約リストコマンドをキャンセル/停止します.
strategy.cancel_all(when)
例として
            pine

            strategy(title = "simple all orders cancellation example")
conditionForBuy1 = open > high[1]
strategy.entry("long entry 1", strategy.long, 1, limit = low, when = conditionForBuy1) // enter long by limit if conditionForBuy1 is true
conditionForBuy2 = conditionForBuy1 and open[1] > high[2]
strategy.entry("long entry 2", strategy.long, 1, limit = ta.lowest(low, 2), when = conditionForBuy2) // enter long by limit if conditionForBuy2 is true
conditionForStopTrading = open < ta.lowest(low, 2)
strategy.cancel_all(conditionForStopTrading) // cancel both limit orders if the conditon conditionForStopTrading is true
パラメータ
when(series bool) 選択可能なパラメータ。すべての注文の条件をキャンセル。条件が真であれば,すべてのアクティブ注文がキャンセルされます。 既定値は<unk>true<unk>。
strategy.order
これは下位注文の命令である。同じIDの注文が既に掛かっている場合,注文を修正することができる。指定IDの注文がない場合,新しい注文が発行される。注文を停止するには,命令strategy.cancelまたはstrategy.cancel_allを使用する。関数strategy.entryと比べて,関数strategy.orderはピラミッド形式の影響を受けない。<unk>制限<unk>と<unk>停止<unk>のパラメータが両方<unk>NaN<unk>である場合,注文タイプは市場注文である。
strategy.order(id, direction, qty, limit, stop, oca_name, oca_type, comment, when, alert_message)
例として
            strategy(title = "simple strategy order example")
strategy.order("buy", strategy.long, 1, when = open > high[1]) // buy by market if current open great then previous high
strategy.order("sell", strategy.short, 1, when = open < low[1]) // sell by market if current open less then previous low
パラメータ
id(series string) 必要パラメータ。 注文識別子。 注文をキャンセルまたは変更するには,その識別子を引用する。direction(strategy_direction) 一つの必須パラメータ. 注文方向: 購入にはstrategy.long,販売にはstrategy.short.qty(series int/float) 選択可能なパラメータ。取引された契約/株数/時間数/単位数。デフォルト値は'NaN'。limit(series int/float) 選択可能なパラメータ。注文の制限価格。指定された場合,注文タイプは"limit"または"stop-limit"。他の注文タイプは"NaN"。stop(series int/float) 選択可能なパラメータ。注文のストップ・コスト。指定された場合,注文タイプは"stop"または"stop-limit"。他の注文タイプは"NaN"。oca_nameoca_typecomment(series string) 選択可能なパラメータ。注文の他の説明。when(series bool) 選択可能なパラメータ。注文の状態。"true"なら注文が置かれる。"false"なら何も起こらない。以前に置かれた同じIDの注文は撤回されない。デフォルト値は"true"。alert_message(series string) アラレットを作成するダイアログのアラレットのメッセージ欄に{{strategy.order.alert_message}}の位置符を使用する際のオプションのパラメータである。
strategy.opentrades.entry_bar_index
bar_index は,未平衡の取引入場を返します.
strategy.opentrades.entry_bar_index(trade_num)
10K線を待って平定する
例として
            pine

            strategy("`strategy.opentrades.entry_bar_index` Example")

barsSinceLastEntry() =>
    strategy.opentrades > 0 ? bar_index - strategy.opentrades.entry_bar_index(strategy.opentrades - 1) : na

// Enter a long position if there are no open positions.
if strategy.opentrades == 0
    strategy.entry("Long",  strategy.long)

// Close the long position after 10 bars.
if barsSinceLastEntry() >= 10
    strategy.close("Long")
パラメータ
trade_num(series int) 未平仓取引の取引番号。最初の取引の番号はゼロ。
続きを見る
strategy.closedtrades.entry_bar_index strategy.closedtrades.exit_bar_index
strategy.opentrades.entry_id
返却したIDは,未定の取引のエントリーです.
strategy.opentrades.entry_id(trade_num)
例として
            pine

            strategy("`strategy.opentrades.entry_id` Example", overlay = true)

// We enter a long position when 14 period sma crosses over 28 period sma.
// We enter a short position when 14 period sma crosses under 28 period sma.
longCondition = ta.crossover(ta.sma(close, 14), ta.sma(close, 28))
shortCondition = ta.crossunder(ta.sma(close, 14), ta.sma(close, 28))

// Strategy calls to enter a long or short position when the corresponding condition is met.
if longCondition
    strategy.entry("Long entry at bar #" + str.tostring(bar_index), strategy.long)
if shortCondition
    strategy.entry("Short entry at bar #" + str.tostring(bar_index), strategy.short)

// Display ID of the latest open position.
if barstate.islastconfirmedhistory
    runtime.log("Last opened position is " + strategy.opentrades.entry_id(strategy.opentrades - 1))
返される値
返却したIDは,未定の取引のエントリーです.
パラメータ
trade_num(series int) 未平仓取引の取引番号。最初の取引の番号はゼロ。
注記
trade_num が範囲外である場合,この関数は na:0 を strategy.opentrades-1 に返します.
続きを見る
strategy.opentrades.entry_bar_index strategy.opentrades.entry_time
strategy.opentrades.entry_price
返還未平衡取引の入場価格
strategy.opentrades.entry_price(trade_num)
例として
            pine

            strategy("strategy.closedtrades.entry_price Example 1")

// Strategy calls to enter long trades every 15 bars and exit long trades every 20 bars.
if bar_index % 15 == 0
    strategy.entry("Long", strategy.long)
if bar_index % 20 == 0
    strategy.close("Long")

// Return the entry price for the latest closed trade.
entryPrice = strategy.closedtrades.entry_price(strategy.closedtrades - 1)

plot(entryPrice, "Long entry price")
平均未定価格を計算する
例として
            pine

            strategy("strategy.opentrades.entry_price Example 2", pyramiding = 2)

// Strategy calls to enter long trades every 15 bars and exit long trades every 20 bars.
if bar_index % 15 == 0
    strategy.entry("Long", strategy.long)
if bar_index % 20 == 0
    strategy.close("Long")

// Calculate average open position price.
avgOpenPositionPrice() =>
    sumOpenPositionPrice = 0.0
    for tradeNo = 0 to strategy.opentrades - 1
        sumOpenPositionPrice += strategy.opentrades.entry_price(tradeNo) * strategy.opentrades.size(tradeNo) / strategy.position_size
    result = nz(sumOpenPositionPrice / strategy.opentrades)

plot(avgOpenPositionPrice())
パラメータ
trade_num(series int) 未平仓取引の取引番号。最初の取引の番号はゼロ。
続きを見る
strategy.closedtrades.exit_price
strategy.opentrades.entry_time
UNIX時間に戻る
strategy.opentrades.entry_time(trade_num)
例として
            pine

            strategy("strategy.opentrades.entry_time Example")

// Strategy calls to enter long trades every 15 bars and exit long trades every 20 bars.
if bar_index % 15 == 0
    strategy.entry("Long", strategy.long)
if bar_index % 20 == 0
    strategy.close("Long")

// Calculates duration in milliseconds since the last position was opened.
timeSinceLastEntry()=>
    strategy.opentrades > 0 ? (time - strategy.opentrades.entry_time(strategy.opentrades - 1)) : na

plot(timeSinceLastEntry() / 1000 * 60 * 60 * 24, "Days since last entry")
パラメータ
trade_num(series int) 未平仓取引の取引番号。最初の取引の番号はゼロ。
続きを見る
strategy.closedtrades.entry_time strategy.closedtrades.exit_time
strategy.opentrades.profit
返還未平衡の取引の<unk>損.損失は負の値として表されます.
strategy.opentrades.profit(trade_num)
最後の取引から得られた利益に戻る
例として
            pine

            strategy("`strategy.opentrades.profit` Example 1", commission_type = strategy.commission.percent, commission_value = 0.1)

// Strategy calls to enter long trades every 15 bars and exit long trades every 20 bars.
if bar_index % 15 == 0
    strategy.entry("Long", strategy.long)
if bar_index % 20 == 0
    strategy.close("Long")

plot(strategy.opentrades.profit(strategy.opentrades - 1), "Profit of the latest open trade")
すべての未平衡取引の利潤を計算する
例として
            pine

            strategy("`strategy.opentrades.profit` Example 2", pyramiding = 5)

// Strategy calls to enter 5 long positions every 2 bars.
if bar_index % 2 == 0
    strategy.entry("Long", strategy.long, qty = 5)

// Calculate open profit or loss for the open positions.
tradeOpenPL() =>
    sumProfit = 0.0
    for tradeNo = 0 to strategy.opentrades - 1
        sumProfit += strategy.opentrades.profit(tradeNo)
    result = sumProfit

plot(tradeOpenPL(), "Profit of all open trades")
パラメータ
trade_num(series int) 未平仓取引の取引番号。最初の取引の番号はゼロ。
続きを見る
strategy.closedtrades.profit strategy.openprofit strategy.netprofit strategy.grossprofit
strategy.opentrades.size
未平衡の取引における取引方向と契約数を返します.この値>0であれば,市場ポジションは多頭になります.この値<0であれば,市場ポジションは空頭になります.
strategy.opentrades.size(trade_num)
例として
            pine

            strategy("`strategy.opentrades.size` Example 1")

// We calculate the max amt of shares we can buy.
amtShares = math.floor(strategy.equity / close)
// Strategy calls to enter long trades every 15 bars and exit long trades every 20 bars
if bar_index % 15 == 0
    strategy.entry("Long", strategy.long, qty = amtShares)
if bar_index % 20 == 0
    strategy.close("Long")

// Plot the number of contracts in the latest open trade.
plot(strategy.opentrades.size(strategy.opentrades - 1), "Amount of contracts in latest open trade")
平均利潤の割合を計算する
例として
            pine

            strategy("`strategy.opentrades.size` Example 2")

// Strategy calls to enter long trades every 15 bars and exit long trades every 20 bars.
if bar_index % 15 == 0
    strategy.entry("Long", strategy.long)
if bar_index % 20 == 0
    strategy.close("Long")

// Calculate profit for all open trades.
profitPct = 0.0
for tradeNo = 0 to strategy.opentrades - 1
    entryP = strategy.opentrades.entry_price(tradeNo)
    exitP = close
    profitPct += (exitP - entryP) / entryP * strategy.opentrades.size(tradeNo) * 100

// Calculate average profit percent for all open trades.
avgProfitPct = nz(profitPct / strategy.opentrades)
パラメータ
trade_num(series int) 未平仓取引の取引番号。最初の取引の番号はゼロ。
続きを見る
strategy.closedtrades.size strategy.position_size strategy.opentrades strategy.closedtrades
strategy.closedtrades.entry_bar_index
bar_index は,平仓取引のエントリーに戻します.
strategy.closedtrades.entry_bar_index(trade_num)
例として
            pine

            strategy("strategy.closedtrades.entry_bar_index Example")
// Enter long trades on three rising bars; exit on two falling bars.
if ta.rising(close, 3)
    strategy.entry("Long", strategy.long)
if ta.falling(close, 2)
    strategy.close("Long")
// Function that calculates the average amount of bars in a trade.
avgBarsPerTrade() =>
    sumBarsPerTrade = 0
    for tradeNo = 0 to strategy.closedtrades - 1
        // Loop through all closed trades, starting with the oldest.
        sumBarsPerTrade += strategy.closedtrades.exit_bar_index(tradeNo) - strategy.closedtrades.entry_bar_index(tradeNo) + 1
    result = nz(sumBarsPerTrade / strategy.closedtrades)
plot(avgBarsPerTrade())
パラメータ
trade_num(series int) 平仓取引の取引番号。最初の取引の番号はゼロ。
続きを見る
strategy.closedtrades.exit_bar_index strategy.opentrades.entry_bar_index
strategy.closedtrades.exit_price
返済済の出場価格に戻す
strategy.closedtrades.exit_price(trade_num)
例として
            pine

            strategy("strategy.closedtrades.exit_price Example 1")

// We are creating a long trade every 5 bars
if bar_index % 5 == 0
    strategy.entry("Long",  strategy.long)
strategy.close("Long")

// Return the exit price from the latest closed trade.
exitPrice = strategy.closedtrades.exit_price(strategy.closedtrades - 1)

plot(exitPrice, "Long exit price")
すべての平成取引の平均利潤のパーセントを計算します.
例として
            pine

            strategy("strategy.closedtrades.exit_price Example 2")

// Strategy calls to create single short and long trades.
if bar_index == last_bar_index - 15
    strategy.entry("Long Entry",  strategy.long)
else if bar_index == last_bar_index - 10
    strategy.close("Long Entry")
    strategy.entry("Short", strategy.short)
else if bar_index == last_bar_index - 5
    strategy.close("Short")

// Calculate profit for both closed trades.
profitPct = 0.0
for tradeNo = 0 to strategy.closedtrades - 1
    entryP = strategy.closedtrades.entry_price(tradeNo)
    exitP = strategy.closedtrades.exit_price(tradeNo)
    profitPct += (exitP - entryP) / entryP * strategy.closedtrades.size(tradeNo) * 100

// Calculate average profit percent for both closed trades.
avgProfitPct = nz(profitPct / strategy.closedtrades)

plot(avgProfitPct)
パラメータ
trade_num(series int) 平仓取引の取引番号。最初の取引の番号はゼロ。
続きを見る
strategy.closedtrades.entry_price
strategy.closedtrades.exit_bar_index
bar_indexは,平仓の取引から退出した状態に戻ります.
strategy.closedtrades.exit_bar_index(trade_num)
例として
            pine

            strategy("strategy.closedtrades.exit_bar_index Example 1")

// Strategy calls to place a single short trade. We enter the trade at the first bar and exit the trade at 10 bars before the last chart bar.
if bar_index == 0
    strategy.entry("Short",  strategy.short)
if bar_index == last_bar_index - 10
    strategy.close("Short")

// Calculate the amount of bars since the last closed trade.
barsSinceClosed = strategy.closedtrades > 0 ? bar_index - strategy.closedtrades.exit_bar_index(strategy.closedtrades - 1) : na

plot(barsSinceClosed, "Bars since last closed trade")
取引ごとに平均K線の数を計算する.
例として
            pine

            strategy("strategy.closedtrades.exit_bar_index Example 2")

// Enter long trades on three rising bars; exit on two falling bars.
if ta.rising(close, 3)
    strategy.entry("Long", strategy.long)
if ta.falling(close, 2)
    strategy.close("Long")

// Function that calculates the average amount of bars per trade.
avgBarsPerTrade() =>
    sumBarsPerTrade = 0
    for tradeNo = 0 to strategy.closedtrades - 1
        // Loop through all closed trades, starting with the oldest.
        sumBarsPerTrade += strategy.closedtrades.exit_bar_index(tradeNo) - strategy.closedtrades.entry_bar_index(tradeNo) + 1
    result = nz(sumBarsPerTrade / strategy.closedtrades)

plot(avgBarsPerTrade())
パラメータ
trade_num(series int) 平仓取引の取引番号。最初の取引の番号はゼロ。
続きを見る
bar_index
strategy.closedtrades.entry_id
返された入場ID について.
strategy.closedtrades.entry_id(trade_num)
例として
            pine

            strategy("strategy.closedtrades.entry_id Example", overlay = true)
var isOpen = false
var openIndex = -1
// Enter a short position and close at the previous to last bar.
if not barstate.ishistory and not isOpen
    strategy.entry("Short at bar #" + str.tostring(bar_index), strategy.short)
    isOpen := true
    openIndex := bar_index
if openIndex != -1 and bar_index > openIndex + 100
    strategy.close_all()

// Display ID of the last entry position.
if barstate.islastconfirmedhistory
    runtime.log("Last Entry ID is: " + strategy.closedtrades.entry_id(strategy.closedtrades - 1))
返される値
返された入場ID について.
パラメータ
trade_num(series int) 平仓取引の取引番号。最初の取引の番号はゼロ。
注記
trade_num が範囲外である場合,この関数は na:0 を strategy.closedtrades-1 に返します.
続きを見る
strategy.closedtrades.entry_bar_index strategy.closedtrades.entry_time
strategy.closedtrades.entry_price
返済された取引の入場価格.
strategy.closedtrades.entry_price(trade_num)
例として
            pine

            strategy("strategy.closedtrades.entry_price Example 1")

// Strategy calls to enter long trades every 15 bars and exit long trades every 20 bars.
if bar_index % 15 == 0
    strategy.entry("Long", strategy.long)
if bar_index % 20 == 0
    strategy.close("Long")

// Return the entry price for the latest  entry.
entryPrice = strategy.closedtrades.entry_price(strategy.closedtrades - 1)

plot(entryPrice, "Long entry price")
すべての平成取引の平均利潤のパーセントを計算します.
例として
            pine

            strategy("strategy.closedtrades.entry_price Example 2")

// Strategy calls to create single short and long trades
if bar_index == last_bar_index - 15
    strategy.entry("Long Entry",  strategy.long)
else if bar_index == last_bar_index - 10
    strategy.close("Long Entry")
    strategy.entry("Short", strategy.short)
else if bar_index == last_bar_index - 5
    strategy.close("Short")

// Calculate profit for both closed trades.
profitPct = 0.0
for tradeNo = 0 to strategy.closedtrades - 1
    entryP = strategy.closedtrades.entry_price(tradeNo)
    exitP = strategy.closedtrades.exit_price(tradeNo)
    profitPct += (exitP - entryP) / entryP * strategy.closedtrades.size(tradeNo) * 100

// Calculate average profit percent for both closed trades.
avgProfitPct = nz(profitPct / strategy.closedtrades)

plot(avgProfitPct)
パラメータ
trade_num(series int) 平仓取引の取引番号。最初の取引の番号はゼロ。
続きを見る
strategy.closedtrades.exit_price strategy.closedtrades.size strategy.closedtrades
strategy.closedtrades.entry_time
UNIX時間に戻る.
strategy.closedtrades.entry_time(trade_num)
例として
            pine

            strategy("strategy.closedtrades.entry_time Example", overlay = true)

// Enter long trades on three rising bars; exit on two falling bars.
if ta.rising(close, 3)
    strategy.entry("Long", strategy.long)
if ta.falling(close, 2)
    strategy.close("Long")

// Calculate the average trade duration
avgTradeDuration() =>
    sumTradeDuration = 0
    for i = 0 to strategy.closedtrades - 1
        sumTradeDuration += strategy.closedtrades.exit_time(i) - strategy.closedtrades.entry_time(i)
    result = nz(sumTradeDuration / strategy.closedtrades)

// Display average duration converted to seconds and formatted using 2 decimal points
if barstate.islastconfirmedhistory
    runtime.log(str.tostring(avgTradeDuration() / 1000, "#.##") + " seconds")
パラメータ
trade_num(series int) 平仓取引の取引番号。最初の取引の番号はゼロ。
続きを見る
strategy.opentrades.entry_time strategy.closedtrades.exit_time time
strategy.closedtrades.profit
負の値で表される損失.
strategy.closedtrades.profit(trade_num)
例として
            pine

            strategy("`strategy.closedtrades.profit` Example")

// Strategy calls to enter long trades every 15 bars and exit long trades every 20 bars.
if bar_index % 15 == 0
    strategy.entry("Long", strategy.long)
if bar_index % 20 == 0
    strategy.close("Long")

// Calculate average gross profit by adding the difference between gross profit and commission.
avgGrossProfit() =>
    sumGrossProfit = 0.0
    for tradeNo = 0 to strategy.closedtrades - 1
        sumGrossProfit += strategy.closedtrades.profit(tradeNo) - strategy.closedtrades.commission(tradeNo)
    result = nz(sumGrossProfit / strategy.closedtrades)

plot(avgGrossProfit(), "Average gross profit")
パラメータ
trade_num(series int) 平仓取引の取引番号。最初の取引の番号はゼロ。
続きを見る
strategy.opentrades.profit strategy.closedtrades.commission
strategy.closedtrades.size
取引の方向と取引数で平定された取引を返します. この値>0なら,市場ポジションは多頭です. この値<0なら,市場ポジションは空頭です.
strategy.closedtrades.size(trade_num)
例として
pine
strategy("`strategy.closedtrades.size` Example 1")
// We calculate the max amt of shares we can buy.
amtShares = math.floor(strategy.equity / close)
// Strategy calls to enter long trades every 15 bars and exit long trades every 20 bars
if bar_index % 15 == 0
strategy.entry("Long", strategy.long, qty = amtShares)
if bar_index % 20 == 0
strategy.close("Long")
// Plot the number of contracts traded in the last closed trade.
plot(strategy.closedtrades.size(strategy.closedtrades - 1), "Number of contracts traded")
平均利潤の割合を平仓取引で計算する
例として
pine
strategy("`strategy.closedtrades.size` Example 2")
// Strategy calls to enter long trades every 15 bars and exit long trades every 20 bars.
if bar_index % 15 == 0
strategy.entry("Long", strategy.long)
if bar_index % 20 == 0
strategy.close("Long")
// Calculate profit for both closed trades.
profitPct = 0.0
for tradeNo = 0 to strategy.closedtrades - 1
entryP = strategy.closedtrades.entry_price(tradeNo)
exitP = strategy.closedtrades.exit_price(tradeNo)
profitPct += (exitP - entryP) / entryP * strategy.closedtrades.size(tradeNo) * 100
// Calculate average profit percent for both closed trades.
avgProfitPct = nz(profitPct / strategy.closedtrades)
plot(avgProfitPct)
パラメータ
trade_num(series int) 平仓取引の取引番号。最初の取引の番号はゼロ。
続きを見る
strategy.opentrades.size strategy.position_size strategy.closedtrades strategy.opentrades
strategy.closedtrades.exit_time
UNIX時間に戻り,平仓取引を終了した.
strategy.closedtrades.exit_time(trade_num)
例として
pine
strategy("strategy.closedtrades.exit_time Example 1")
// Enter long trades on three rising bars; exit on two falling bars.
if ta.rising(close, 3)
strategy.entry("Long", strategy.long)
if ta.falling(close, 2)
strategy.close("Long")
// Calculate the average trade duration.
avgTradeDuration() =>
sumTradeDuration = 0
for i = 0 to strategy.closedtrades - 1
sumTradeDuration += strategy.closedtrades.exit_time(i) - strategy.closedtrades.entry_time(i)
result = nz(sumTradeDuration / strategy.closedtrades)
// Display average duration converted to seconds and formatted using 2 decimal points.
if barstate.islastconfirmedhistory
label.new(bar_index, high, str.tostring(avgTradeDuration() / 1000, "#.##") + " seconds")
X秒後に取引を再開する
例として
strategy("strategy.closedtrades.exit_time Example 2")
// Strategy calls to emulate a single long trade at the first bar.
if bar_index == 0
strategy.entry("Long", strategy.long)
reopenPositionAfter(timeSec) =>
if strategy.closedtrades > 0
if time - strategy.closedtrades.exit_time(strategy.closedtrades - 1) >= timeSec * 1000
strategy.entry("Long", strategy.long)
// Reopen last closed position after 120 sec.
reopenPositionAfter(120)
if ta.change(strategy.opentrades)
strategy.exit("Long", stop = low * 0.9, profit = high * 2.5)
パラメータ
trade_num(series int) 平仓取引の取引番号。最初の取引の番号はゼロ。
続きを見る
strategy.closedtrades.entry_time
strategy.risk.allow_entry_in
この関数は,strategy.entry関数がどの市場方向にポジションを開くことを許可するかを指定するために使用できます.
strategy.risk.allow_entry_in(value)
例として
pine
strategy("strategy.risk.allow_entry_in")
strategy.risk.allow_entry_in(strategy.direction.long)
strategy.entry("Long", strategy.long, when = open > close)
// Instead of opening a short position with 10 contracts, this command will close long entries.
strategy.entry("Short", strategy.short, when = open < close, qty = 10)
パラメータ
value(simple string) 許容する方向。可能な値:strategy.direction.all、strategy.direction.long、strategy.direction.short
strategy.risk.max_position_size
このルールの目的は,市場ポジションの最大値を決定することです. このルールは以下の機能に影響します.strategy.entry┃ <unk>エントリー<unk>の数は ((もし必要なら) 契約/株/手/単位数に減らされるので,ポジションの総額は'strategy.risk.max_position_size'で指定された値を超えない。 最低数が規則に反するとしても,オーダーは置かれない。
strategy.risk.max_position_size(contracts)
例として
pine
strategy("risk.max_position_size Demo", default_qty_value = 100)
strategy.risk.max_position_size(10)
strategy.entry("buy", strategy.long, when = open > close)
plot(strategy.position_size) // max plot value will be 10
パラメータ
contracts(simple int/float) 必要なパラメータ。ポジションの契約/株/手/ユニットの最大数。
math
math.abs
もしnumber >= 0,number絶対値は でした.numberそうでない場合は -number。
math.abs(number)
返される値
number絶対値について
math.acos
acos関数は, cos ((acos ((y)) = y が y の範囲内にあるように,数字の反余弦 (((を弧で表す) を返します.[-1, 1]。
math.acos(angle)
返される値
逆余弦値. y が範囲外である場合[-1,1] で,戻り角度は[0,Pi]またはnaの範囲内
math.random
偽ランダム値を返します。この関数は,実行される各スクリプトに対して異なる値のシーケンスを生成します。選択可能なseedパラメータに対して同じ値を使用すると,重複可能なシーケンスが生成されます。
math.random(min, max, seed)
返される値
ランダムな値である
パラメータ
min(series int/float) ランダム値の範囲の下限。この値は範囲に含まれません。デフォルト値は0。max(series int/float) ランダム値の範囲の上限。この値は範囲に含まれません。デフォルト値は1。seed(input int) 選択可能なパラメータ。同じseedを使用すると,この関数を連続的に呼び出すことを許可して,一組の重複可能な値を生成する。
math.asin
asin関数は数値の反正弦を返します (→ 弧で表す),正弦 (→ asin (→ y)) = y の範囲で y[-1, 1]。
math.asin(angle)
返される値
逆正弦値。yが範囲外である場合[-1,1] で,戻り角度は[-Pi / 2,Pi / 2]またはnaの範囲内
math.atan
atan関数は,数字の正切線 ((を弧で表す),tan ((atan ((y)) =任意のyのy。を返します.
math.atan(angle)
返される値
逆切開値; 回帰角度は[-Pi / 2,Pi / 2]の範囲で
math.ceil
上から整数関数は,参数より大きいまたは等しい最小の ((最接近マイナス無限) 整数 を返します。
math.ceil(number)
返される値
与えられた数値の最小整数より小さいまたは等しい
続きを見る
math.floor math.round
math.cos
cos関数が返される角の三角弦
math.cos(angle)
返される値
角の三角弦
パラメータ
angle角度 (series int/float) で,弧度で
math.exp
numberこれは,eのxp関数です.number次方, e がオーラ数である.
math.exp(number)
返される値
これは,eの値です.numberありがとうございました.
続きを見る
math.pow
math.floor
math.floor(number)
返される値
与えられた数字の最大整数より小さいか等しい.
続きを見る
math.ceil math.round
math.log
どれかnumberyの自然対数は, yの自然対数で, yの自然対数は, yの自然対数で,number。
math.log(number)
返される値
numberについて考える.
続きを見る
math.log10
math.log10
number常用 ((または10を基に) の対数とは,10を上げなければ得られない<unk>である.number。10^y = number。
math.log10(number)
返される値
number10の底にある対数。
続きを見る
math.log
math.pow
数学<unk>関数
math.pow(base, exponent)
例として
pine
// math.pow
plot(math.pow(close, 2))
返される値
base増加しました.exponent<unk> <unk>base列は,元素によって計算されます.
パラメータ
base(series int/float) 使用する基盤を指定する。exponent(series int/float) インデックスを指定する。
math.sign
<unk>数<unk>が0である場合,<unk>数<unk>の記号は0であり,<unk>数<unk>が0より大きい場合は1.0であり,<unk>数<unk>が0より小さい場合は-1.0。
math.sign(number)
返される値
パラメータの標識
math.sin
正弦関数は,三角形の正弦を返します.
math.sin(angle)
返される値
角の三角正弦
パラメータ
angle角度 (series int/float) で,弧度で
math.sqrt
どれかnumberyの2乗は,yの2乗は,yの2乗は,yの2乗は,yの2乗は,yの2乗は,yの2乗は,yの2乗は,yの2乗は,yの2乗は,yの2乗は,yの2乗はnumber。
math.sqrt(number)
返される値
number平方根は
続きを見る
math.pow
math.tan
tan関数が返される角の三角形正切
math.tan(angle)
返される値
角の三角は正角である.
パラメータ
angle角度 (series int/float) で,弧度で
math.round
戻ったnumber整数と整数と整数と整数と整数と整数と整数precision参数で,小数点に4回5回入りの浮点値を返します.
math.round(number)
math.round(number, precision)
返される値
number値の四辺を五入して,最も近い整数に,または精度に応じて.
パラメータ
number(series int/float) 囲い込みの値を求めている.precision(series int) 選択可能なパラメータ。number小数点を四辺五入する.パラメータが提供されていない場合,四辺五入を近隣の整数にする.
注記
注意: 'na' の値に対して,関数は 'na' を返します.
続きを見る
math.ceil math.floor
math.max
複数の値の最大を返します.
math.max(number0, number1, ...)
例として
pine
// math.max
plot(math.max(close, open))
plot(math.max(close, math.max(open, 42)))
返される値
複数の与えられた値の最大である。
続きを見る
math.min
math.min
複数の値のうち最小の 1 を返します
math.min(number0, number1, ...)
例として
pine
// math.min
plot(math.min(close, open))
plot(math.min(close, math.min(open, 42)))
返される値
複数の与えられた値の最小値である。
続きを見る
math.max
math.avg
すべてのシリーズの平均値 ((対応要素) を計算する.
math.avg(number0, number1, ...)
返される値
平均して
math.round_to_mintick
商品に囲まれたmintickの値を返します.つまり,syminfo.mintickの最も近い値で割り切れます.余分な数はありません.そして上向きに囲みます.
math.round_to_mintick(number)
返される値
numberティックまで正確に4回5回
パラメータ
number(series int/float) 囲い込みの値を求めている.
続きを見る
math.ceil math.floor
math.sum
sum関数は,xの最後のy値の滑り込み合成を返します.
math.sum(source, length)
返される値
length返されるsource総計
パラメータ
source(series int/float) 実行されるシリーズ値length(series int) K 行の数 (長さ)
math.todegrees
弧度単位で角度から,度単位で近似等価角度に戻る。
math.todegrees(radians)
返される値
測定単位における角値.
パラメータ
radians(series int/float) 弧度単位での角度。
math.toradians
度単位の角度から,弧度単位の近似等価角度に戻る。
math.toradians(degrees)
返される値
弧度単位での角値
パラメータ
degrees(series int/float) 単位で測定した角度。
others
fixnan
与えられたシリーズに対して,NaN値を前の非NaN値に置き換える.
fixnan(source)
返される値
連続した作品.
パラメータ
source(series int/float/bool/color)
nz
NaN値の代わりに,一連のゼロ ((または指定数) を入れ替える.
nz(source, replacement)
nz(source)
例として
pine
// nz
plot(nz(ta.sma(close, 100)))
返される値
source値が,それではない場合na│ │sourceこの式は,na1 を使った場合は 0 を返します.replacementパラメータ
パラメータ
source(series int/float/bool/color) 実行されるシリーズ値replacement(series int/float/bool/color) は,<unk>source<unk>のシリーズ内のすべての<unk>na<unk>値の値を置換する。
na
NaNの場合,テスト値は。
na(x)
返される値
x が有効数字でない場合は true (x は NaN) で,そうでない場合は false ( NaN) である.
int
n に変換するか,float を int に切断する.
int(x)
返される値
int の後の参数値に変換する.
float
float に na を設定する.
float(x)
返される値
float の後のパラメータ値に変換する.
alert
リアルタイム K ラインで呼び出し時に警報イベントをトリガーし,以前は,警報機能のイベントに基づく警報を,警報を作成するダイアログを,指標または策として,<unk>で作成した.
alert(message, freq)
例として
pine
// alert() example
ma = ta.sma(close, 14)
xUp = ta.crossover(close, ma)
if xUp
// Trigger the alert the first time a cross occurs during the real-time bar.
alert("Price (" + str.tostring(close) + ") crossed over MA (" + str.tostring(ma) + ").", alert.freq_once_per_bar)
plot(ma)
plotchar(xUp, "xUp", "▲", location.top, size = size.tiny)
パラメータ
message(series string) アラームが起動した時に送信されるメッセージ 必須パラメータ ≫freq(input string) トリップする頻度。可能な値は:alert.freq_all (すべての関数呼び出しでトリップアラート),alert.freq_once_per_bar (K行の最初の関数呼び出しでトリップアラート),alert.freq_once_per_bar_close (関数呼び出しがリアルタイムK行の最後のスクリプトのイカレーション中にのみ発生すると,閉じる時にトリップアラート) 既定値はalert.freq_once_per_bar。
注記
このページでは,このようなアラートを作成する方法について説明します.
alertconditionとは異なり,alert呼び出しは追加図としてカウントされません.
函数呼び出しは,全局および局所的な範囲内で行うことができます.
グラフには関数呼び出しが表示されない.
<unk>freq<unk>のパラメータは,この関数を使用した呼び出しのトリガの頻度のみに影響する.
続きを見る
alertcondition
alertcondition
警告条件の作成は,警告の作成のダイアログで利用できます. 注意してください,alertconditionは警告を作成しません. 警告の作成のダイアログで,より多くのオプションを提供します. さらに,alertconditionの効果はグラフに表示されません.
alertcondition(condition, title, message)
例として
pine
// alertcondition
alertcondition(close >= open, title='Alert on Green Bar', message='Green Bar!')
パラメータ
condition(series bool) 警報の一連の bool 値. True値は警報の発生を表し,falseは警報の発生を表し,必要パラメータである.title(const string) 警告条件のヘッダー。 選択可能なパラメータ。message(const string) アラームが起動したときにメッセージを表示する。可選参数。
注記
Pine v4では,警告条件の呼び出しが追加図を作成することをご注意ください. 各スクリプトの出力シリーズの数を計算するときに,これらの呼び出しをすべて考慮します.
続きを見る
alert
indicator
互換性のためにTrading View戦略コードは,実際に呼び出す必要がありません.
続きを見る
strategy
time
time関数は,指定された時間帯と取引時間の現在のK行のUNIX時間を返し,タイムポイントが取引時間に含まれていない場合はNaNを返します. 注意:FMZはサポートされていません.sessionパラメータ
time(timeframe, session, timezone)
time(timeframe, session)
time(timeframe)
例として
pine
timeinrange(res, sess) => not na(time(res, sess, "America/New_York")) ? 1 : 0
plot(timeinrange("1", "1300-1400"), color=color.red)
// This plots 1.0 at every start of 10 minute bar on a 1 minute chart:
newbar(res) => ta.change(time(res)) == 0 ? 0 : 1
plot(newbar("10"))
セッションを設定する際には,時間や分だけでなく,週間の日付も指定できます.
日付が指定されていない場合,取引時間設定は日曜日 (1) から土曜日 (7) であると考えます.つまり,<unk>1100-2000<unk>は<unk>1100-1200:1234567<unk>と同じです.
例えば,週7日,24時間取引する商品については,次のスクリプトは土曜日と日曜日には色付けされません.
例として
pine
// Time
t1 = time(timeframe.period, "0000-0000:23456")
bgcolor(t1 ? color.new(color.blue, 90) : na)
1つsessionパラメータには,異なる取引時間帯が複数あり,その間を逗留符で区切ることができます.例えば,以下のスクリプトは,10:00~11:00と14:00~15:00 (週日限定) のK線図を突出します.
例として
pine
// Time
t1 = time(timeframe.period, "1000-1100,1400-1500:23456")
bgcolor(t1 ? color.new(color.blue, 90) : na)
返される値
ユニックスタイム
パラメータ
timeframe(simple string) 時間周期。空の文字列はグラフの現在の時間周期として解釈されます。sessiontimezone(simple string)sessionパラメータのタイムゾーン。 指定した<unk>セッション<unk>のみで使用できます。 選択できます。 既定値はsyminfo.timezone。 GMT表示法 ((例えば<unk>GMT-5<unk>) または IANAタイムゾーンデータベース名 ((例えば<unk>America/New_York<unk>)) で指定できます。
注記
UNIX 時間は,1970年1月1日 UTC 00:00:00 から過ぎた数ミリ秒である.
year
year(time)
year(time, timezone)
返される値
UNIX時間の提供年 ((交換時間帯) 。
パラメータ
time(series int) は,ミリ秒単位でのユニックス時間である。timezone(series string) 選択可能なパラメータ。時間帯。
注記
UNIX 時間は,1970年1月1日 UTC 00:00:00 以降のミリ秒数である。 既定の時間帯は,syminfo.timezoneである。 可能な値をタイムスタンプで確認できます。
この関数は,K線の開いた時間に基づいて年数を返します. 夜間の取引時間 ((例えば,EURUSDの月曜日の取引時間は,日曜日の17:00 UTC-4から始まる) に対して,この値は,取引日の年数より低い1。
続きを見る
year time month dayofmonth dayofweek hour minute second
month
month(time)
month(time, timezone)
返される値
UNIX 時間を提供する月 ((交換時間帯) 。
パラメータ
time(series int) は,ミリ秒単位でのユニックス時間である。timezone(series string) 選択可能なパラメータ。時間帯。
注記
UNIX 時間は,1970年1月1日 UTC 00:00:00 以降のミリ秒数である。 既定の時間帯は,syminfo.timezoneである。 可能な値をタイムスタンプで確認できます。
この関数は,K線の開いた時間に応じて月を返します. 夜間の取引時間 (例えば,EURUSDの月曜日の取引時間は,日曜日の17:00 UTC-4から始まる) に対して,この値は,取引日の月よりも1低い値になります.
続きを見る
month time year dayofmonth dayofweek hour minute second
hour
hour(time)
hour(time, timezone)
返される値
UNIX時間の提供時間 ((交換時間帯) 。
パラメータ
time(series int) は,ミリ秒単位でのユニックス時間である。timezone(series string) 選択可能なパラメータ。時間帯。
注記
UNIX 時間は,1970年1月1日 UTC 00:00:00 以降のミリ秒数である。 既定の時間帯は,syminfo.timezoneである。 可能な値をタイムスタンプで確認できます。
続きを見る
hour time year month dayofmonth dayofweek minute second
minute
minute(time)
minute(time, timezone)
返される値
UNIX時間の提供分 ((交換時間帯) 。
パラメータ
time(series int) は,ミリ秒単位でのユニックス時間である。timezone(series string) 選択可能なパラメータ。時間帯。
注記
UNIX 時間は,1970年1月1日 UTC 00:00:00 以降のミリ秒数である。 既定の時間帯は,syminfo.timezoneである。 可能な値をタイムスタンプで確認できます。
続きを見る
minute time year month dayofmonth dayofweek hour second
second
second(time)
second(time, timezone)
返される値
UNIX時間の秒数 ((交換時間帯)) を提供する.
パラメータ
time(series int) は,ミリ秒単位でのユニックス時間である。timezone(series string) 選択可能なパラメータ。時間帯。
注記
UNIX 時間は,1970年1月1日 UTC 00:00:00 以降のミリ秒数である。 既定の時間帯は,syminfo.timezoneである。 可能な値をタイムスタンプで確認できます。
続きを見る
second time year month dayofmonth dayofweek hour minute
weekofyear
weekofyear(time)
weekofyear(time, timezone)
返される値
UNIX時間の周期 ((交換時間帯)) を提供する.
パラメータ
time(series int) は,ミリ秒単位でのユニックス時間である。timezone(series string) 選択可能なパラメータ。時間帯。
注記
UNIX 時間は,1970年1月1日 UTC 00:00:00 以降のミリ秒数である。 既定の時間帯は,syminfo.timezoneである。 可能な値をタイムスタンプで確認できます。
この関数は,K線の開いた時間に基づいて週を返します. 夜間取引時間 (例えば,EURUSDの月曜日の取引時間は日曜日の17:00から始まります) の場合,この値は取引日の週より低い値になります.
続きを見る
weekofyear time year month dayofmonth dayofweek hour minute second
dayofweek
dayofweek(time)
dayofweek(time, timezone)
返される値
UNIX時間の週日 ((交換時間帯) を提供する.
パラメータ
time(series int) は,ミリ秒単位でのユニックス時間である。timezone(series string) 選択可能なパラメータ。時間帯。
注記
この関数は,K線の開いた時間に応じて日付を返します. 夜間の取引時間 (例えば,EURUSDの月曜日の取引時間は日曜日の17:00から始まります) については,この値は取引日の日付より低い可能性があります.
UNIX 時間は,1970年1月1日 UTC 00:00:00 以降のミリ秒数である。 既定の時間帯は,syminfo.timezoneである。 可能な値をタイムスタンプで確認できます。
続きを見る
time dayofmonth
dayofmonth
dayofmonth(time)
dayofmonth(time, timezone)
返される値
UNIX時間の月日 ((交換時間帯) を提供する.
パラメータ
time(series int) は,ミリ秒単位でのユニックス時間である。timezone(series string) 選択可能なパラメータ。時間帯。
注記
UNIX 時間は,1970年1月1日 UTC 00:00:00 以降のミリ秒数である。 既定の時間帯は,syminfo.timezoneである。 可能な値をタイムスタンプで確認できます。
この関数は,K線の開いた時間に応じて日付を返します. 夜間の取引時間 ((例えば,EURUSDの月曜日の取引時間は,日曜日の17:00 UTC-4から始まります) については,この値は取引日の日付より低い1。
timestamp
タイム<unk>機能は,UNIX時間の指定された日付と時間を返します.
timestamp(dateString)
timestamp(year, month, day, hour, minute, second)
timestamp(timezone, year, month, day, hour, minute, second)
例として
pine
// timestamp
plot(timestamp(2016, 01, 19, 09, 30), linewidth=3, color=color.green)
plot(timestamp(syminfo.timezone, 2016, 01, 19, 09, 30), color=color.blue)
plot(timestamp(2016, 01, 19, 09, 30), color=color.yellow)
plot(timestamp("GMT+6", 2016, 01, 19, 09, 30))
plot(timestamp(2019, 06, 19, 09, 30, 15), color=color.lime)
plot(timestamp("GMT+3", 2019, 06, 19, 09, 30, 15), color=color.fuchsia)
plot(timestamp("Feb 01 2020 22:10:05"))
plot(timestamp("2011-10-10T14:48:00"))
plot(timestamp("04 Dec 1995 00:12:00 GMT+5"))
返される値
ユニックスタイム
パラメータ
timezone(series string) タイムゾーン。可選。デフォルトはsyminfo.timezone。GMT表示法 ((例えば<unk>GMT-5<unk>) またはIANAタイムゾーンデータベース名 ((例えば<unk>America/New_York<unk>)) で指定できます。year(series int) 年month(series int) 月 についてday(series int) 日。hour(series int) (選択可能なパラメータ) 時間。 既定値は0。minute(series int) (選択可能なパラメータ) 分. 既定値は0。second(series int) (選択可能なパラメータ) Second。 既定値は0。dateString(const string) 日付と選択可能な時間と時間帯を含む文字列である。その形式はIETF RFC 2822またはISO 8601規格に準拠しなければならない。<unk>DD MMM YYYY hh:mm:ss±hhmm<unk>または<unk>YYYY-MM-DDThh:mm:ss±hh:mm<unk>,したがって<unk>20 Feb 2020<unk>または<unk>2020-02-20<unk>である。時間を提供されていない場合は<unk>00:00<unk>を使用する。時間帯を提供されていない場合はGMT+0を使用する。注意,これは関数の通常の動作とは異なり,交易所が所在する時間帯の時間を返します。
注記
UNIX 時間は,1970年1月1日 UTC 00:00:00 から過ぎた数ミリ秒である.
続きを見る
time timenow syminfo.timezone
fill
提供された色を使用して,二つの図面またはhlineの間の背景を埋めます.
fill(hline1, hline2, color, title, editable, fillgaps, display)
fill(plot1, plot2, color, title, editable, show_last, fillgaps, display)
例として
pine
h1 = hline(20)
h2 = hline(10)
fill(h1, h2, color=color.new(color.blue, 90))
p1 = plot(open)
p2 = plot(close)
fill(p1, p2, color=color.new(color.green, 90))
パラメータ
hline1(hline) 最初のhlineオブジェクト. 必要なパラメータ.hline2(hline) 2番目のhlineオブジェクト 必要なパラメータplot1(plot) 最初の描画オブジェクト. 必須パラメータ.plot2(plot) 2番目の描画オブジェクト 必要なパラメータcolor(series color) 描画された色。 'color = red'または'color =#ff001a'のような常数,そして 'color = close >= open ? green: red'のような複雑な式を使うことができます。 任意のパラメータ。title(const string) オブジェクトのタイトルを埋めている. 選択可能なパラメータ.editable(const bool) true ならば,記入スタイルはフォーマットダイアログで編集できます。 既定値は true。show_last(input int) 設定されている場合,グラフを埋めているk行数を定義します.fillgaps(const bool) 空白の連続的な埋込みを制御する,つまり,plot ((() の呼び出しの一つがna値を返すと. trueに設定すると,最後の埋込みは空白を埋めるままになります. 既定はfalse。display(plot_display) 埋められた表示位置を制御する.可能な値は:display.none、display.all。デフォルトはdisplay.all。
続きを見る
plot barcolor bgcolor hline
hline
与えられた固定価格レベルで水平線を表示する.
hline(price, title, color, linestyle, linewidth, editable, display)
例として
pine
// input.hline
hline(3.14, title='Pi', color=color.blue, linestyle=hline.style_dotted, linewidth=2)
// You may fill the background between any two hlines with a fill() function:
h1 = hline(20)
h2 = hline(10)
fill(h1, h2, color=color.new(color.green, 90))
返される値
fill のhline オブジェクトについて
パラメータ
price(input int/float) オブジェクトが表示する値 〔必要パラメータ〕title(const string) オブジェクトのタイトルcolor(input color) 染色線の色。一定常数 (非表現式) 。可選参数。linestyle(hline_style) 染色ラインのスタイル。 可能な値は:solid,dotted,dotted。 選択可能なパラメータ。linewidth(input int) レンダリングラインの幅。 既定値は 1。editable(const bool) trueであれば,hlineスタイルはフォーマットダイアログで編集できます。 既定値はtrue。display(plot_display) コントロールラインの表示位置。可能な値は:display.none、display.all。デフォルトはdisplay.all。overlay(const bool) FMZプラットフォームの拡張のパラメータ,現在の関数を設定するために使用される. 主図 ((設定true) または副図 ((設定false) に描画図で表示される. 既定値はfalseである. このパラメータを指定しない場合は,次の通りstrategyまたはindicatorでoverlay参数設定についてstrategyまたはindicator設定されていません.overlay参数については,デフォルトの参数に従って処理します.
bgcolor
指定した色でK線の背景を埋めます.
bgcolor(color, offset, editable, show_last, title, display, overlay)
例として
pine
// bgcolor example
bgcolor(close < open ? color.new(color.red,70) : color.new(color.green, 70))
パラメータ
color(series color) 背景の色を満たす。 <unk>red<unk>または<unk>#ff001a<unk>などの常数,そして 'close >= open ? green: red'のような複雑な表現を使用できます。 必要なパラメータ。offset(series int) 特定の数のk行に左または右に移動する色列。 既定値は0。editable(const bool) true であれば,bgcolor スタイルはフォーマットダイアログで編集できます。 既定値は true。show_last(input int) 設定されている場合,グラフを埋めているk行数を定義します.title(const string) bgcolorのタイトル。 選択可能なパラメータ。display(plot_display) bgcolorの表示位置を制御する.可能な値は:display.none、display.all。デフォルトはdisplay.all。overlay(const bool) FMZプラットフォームの拡張のパラメータ,現在の関数を設定するために使用される. 主図 ((設定true) または副図 ((設定false) に描画図で表示される. 既定値はfalseである. このパラメータを指定しない場合は,次の通りstrategyまたはindicatorでoverlay参数設定についてstrategyまたはindicator設定されていません.overlay参数については,デフォルトの参数に従って処理します.
続きを見る
plot
barcolor
Kラインの色を設定します.
barcolor(color, offset, editable, show_last, title, display)
例として
pine
barcolor(close < open ? color.black : color.white)
パラメータ
color(series color) K線色。 <unk>red<unk>または<unk>#ff001a<unk>などの常数,そして 'close >= open ? green : red'のような複雑な式を使用できます。 必要なパラメータ。offset(series int) 特定の数のk行に左または右に移動する色列。 既定値は0。editable(const bool) true であれば,barcolor スタイルはフォーマットダイアログで編集できます。 既定値は true。show_last(input int) 設定されている場合,グラフを埋めているk行数を定義します.title(const string) Barcolor ヘッティング 〔選択可能なパラメータ〕display(plot_display) K線色の表示位置を制御する.可能な値は:display.none、display.all。デフォルトはdisplay.all。
error
対応するPINE v4のバージョンerror機能とruntime.error合意する.
組み込み変数
order
order.ascending
配列の最小から最大までの順序を決定する
タイプ
sort_order
続きを見る
array.new_float array.sort
order.descending
配列の最大から最小の順序を決定する.
タイプ
sort_order
続きを見る
array.new_float array.sort
timeframe
timeframe.isdaily
返されるのは,現在の解像度が,毎日の解像度である場合は,true,そうでない場合は,falseです.
タイプ
simple bool
続きを見る
timeframe.isdwm timeframe.isintraday timeframe.isminutes timeframe.isseconds timeframe.isweekly timeframe.ismonthly
timeframe.isdwm
返されるのは,現在の解像度が毎日,毎週,または毎月の解像度である場合は,trueを返し,そうでなければ,falseを返します.
タイプ
simple bool
続きを見る
timeframe.isintraday timeframe.isminutes timeframe.isseconds timeframe.isdaily timeframe.isweekly timeframe.ismonthly
timeframe.isintraday
現在の周期が日 (分または秒) の周期である場合は true を返し,そうでない場合は false を返します.
タイプ
simple bool
続きを見る
timeframe.isminutes timeframe.isseconds timeframe.isdwm timeframe.isdaily timeframe.isweekly timeframe.ismonthly
timeframe.isminutes
周期が分周期である場合は true を返し,そうでない場合は false を返します.
タイプ
simple bool
続きを見る
timeframe.isdwm timeframe.isintraday timeframe.isseconds timeframe.isdaily timeframe.isweekly timeframe.ismonthly
timeframe.ismonthly
返されるのは,現在の解像度が毎月の解像度である場合は,true,そうでない場合は,falseです.
タイプ
simple bool
続きを見る
timeframe.isdwm timeframe.isintraday timeframe.isminutes timeframe.isseconds timeframe.isdaily timeframe.isweekly
timeframe.isseconds
周期が秒である場合は true を返し,そうでない場合は false を返します.
タイプ
simple bool
続きを見る
timeframe.isdwm timeframe.isintraday timeframe.isminutes timeframe.isdaily timeframe.isweekly timeframe.ismonthly
timeframe.isweekly
返されるのは,現在の解像度が毎週解像度である場合は,true,そうでない場合は,falseです.
タイプ
simple bool
続きを見る
timeframe.isdwm timeframe.isintraday timeframe.isminutes timeframe.isseconds timeframe.isdaily timeframe.ismonthly
timeframe.multiplier
時間周期の倍数,例えば'60' - 60,'D' - 1,'5D' - 5,'12M' - 12。
タイプ
simple int
続きを見る
syminfo.ticker syminfo.tickerid timeframe.period
timeframe.period
時間周期: 60分,D日,W週間,M月,D5日,12M1年,3M1四半期
タイプ
simple string
続きを見る
syminfo.ticker syminfo.tickerid timeframe.multiplier
display
display.none
命名常数で,図の表示位置を指定する。どこにも表示されない。警告テンプレートメッセージで利用できる。
タイプ
plot_display
display.all
地図の位置を指定する命名常数.
タイプ
plot_display
続きを見る
plot plotshape plotchar plotarrow plotbar plotcandle
shape
shape.xcross
plotshape機能の形状スタイル
タイプ
const string
続きを見る
plotshape
shape.cross
plotshape機能の形状スタイル
タイプ
const string
続きを見る
plotshape
shape.triangleup
plotshape機能の形状スタイル
タイプ
const string
続きを見る
plotshape
shape.triangledown
plotshape機能の形状スタイル
タイプ
const string
続きを見る
plotshape
shape.flag
plotshape機能の形状スタイル
タイプ
const string
続きを見る
plotshape
shape.circle
plotshape機能の形状スタイル
タイプ
const string
続きを見る
plotshape
shape.arrowup
plotshape機能の形状スタイル
タイプ
const string
続きを見る
plotshape
shape.arrowdown
plotshape機能の形状スタイル
タイプ
const string
続きを見る
plotshape
shape.labelup
plotshape機能の形状スタイル
タイプ
const string
続きを見る
plotshape
shape.labeldown
plotshape機能の形状スタイル
タイプ
const string
続きを見る
plotshape
shape.square
plotshape機能の形状スタイル
タイプ
const string
続きを見る
plotshape
shape.diamond
plotshape機能の形状スタイル
タイプ
const string
続きを見る
plotshape
color
color.aqua
#00BCD4の色名の定数である。
タイプ
const color
color.black
#363A45色の命名定数である.
タイプ
const color
color.blue
#2962ffの色名の定数である。
タイプ
const color
color.fuchsia
#E040FBの色名の定数である。
タイプ
const color
color.gray
#787B86色の命名定数である。
タイプ
const color
color.green
#4CAF50の色名の定数である。
タイプ
const color
color.lime
#00E676の色名の定数である.
タイプ
const color
color.maroon
#880E4F色として命名常数。
タイプ
const color
color.navy
#311B92の色の命名定数である.
タイプ
const color
color.olive
#808000の色の命名常数である。
タイプ
const color
color.orange
#FF9800の色名の定数である。
タイプ
const color
color.purple
#9C27B0色の命名定数である.
タイプ
const color
color.red
#FF5252の色名の定数である。
タイプ
const color
color.silver
#B2B5BE色として命名常数。
タイプ
const color
color.teal
color.teal
#00897B色の命名定数である。
タイプ
const color
color.white
#FFFFFFの色名の定数である。
タイプ
const color
color.yellow
#FFEB3Bの色名の定数である.
タイプ
const color
plot
plot.style_line
'Line'型の命名常数,plot関数で使用するstyle参数に対する参数.
タイプ
plot_style
続きを見る
plot plot.style_linebr plot.style_stepline plot.style_stepline_diamond plot.style_histogram plot.style_cross plot.style_area plot.style_areabr plot.style_columns plot.style_circles
plot.style_linebr
'Line With Breaks' 式の命名常数,プロット関数として使用style参数の参数。 plot.style_line に似ていますが,データ内の空白は埋まっていません。
タイプ
plot_style
続きを見る
plot plot.style_line plot.style_stepline plot.style_stepline_diamond plot.style_histogram plot.style_cross plot.style_area plot.style_areabr plot.style_columns plot.style_circles
plot.style_histogram
'Histogram'型の命名常数,plot関数で使用するstyle参数に対する参数.
タイプ
plot_style
続きを見る
plot plot.style_line plot.style_linebr plot.style_stepline plot.style_stepline_diamond plot.style_cross plot.style_area plot.style_areabr plot.style_columns plot.style_circles
plot.style_columns
'Columns' 形式の命名常数で,plot 関数に用いられるstyle参数に対する参数.
タイプ
plot_style
続きを見る
plot plot.style_line plot.style_linebr plot.style_stepline plot.style_stepline_diamond plot.style_histogram plot.style_cross plot.style_area plot.style_areabr plot.style_circles
plot.style_circles
'Circles' 式の命名常数で,plot 関数に用いられる.style参数に対する参数.
タイプ
plot_style
続きを見る
plot plot.style_line plot.style_linebr plot.style_stepline plot.style_stepline_diamond plot.style_histogram plot.style_cross plot.style_area plot.style_areabr plot.style_columns
plot.style_area
'Area'型の命名常数,plot関数で用いられるstyle参数に対する参数.
タイプ
plot_style
続きを見る
plot plot.style_line plot.style_linebr plot.style_stepline plot.style_stepline_diamond plot.style_histogram plot.style_areabr plot.style_cross plot.style_columns plot.style_circles
plot.style_areabr
'Area With Breaks' 式の命名常数,プロット関数として使用styleパラメータのパラメータ. plot.style_area に似ていますが,データ内の空白は埋まっていません.
タイプ
plot_style
続きを見る
plot plot.style_line plot.style_linebr plot.style_stepline plot.style_stepline_diamond plot.style_histogram plot.style_cross plot.style_area plot.style_columns plot.style_circles
plot.style_cross
'Cross' 式の命名常数で,plot 関数として使用されるstyle参数に対する参数.
タイプ
plot_style
続きを見る
plot plot.style_line plot.style_linebr plot.style_stepline plot.style_stepline_diamond plot.style_histogram plot.style_area plot.style_areabr plot.style_columns plot.style_circles
plot.style_stepline
'Step Line' スタイルの命名常数,プロット関数として使用style参数に対する参数.
タイプ
plot_style
続きを見る
plot plot.style_stepline_diamond plot.style_linebr plot.style_histogram plot.style_cross plot.style_area plot.style_areabr plot.style_columns plot.style_circles
plot.style_stepline_diamond
'Step Line With Diamonds' のような命名常数で,plot関数として使われます.style参数の参数。 plot.style_steplineに似ており,データ変化以外にも<unk>形でマークされている。
タイプ
plot_style
続きを見る
plot plot.style_line plot.style_linebr plot.style_histogram plot.style_cross plot.style_area plot.style_areabr plot.style_columns plot.style_circles
location
location.abovebar
location.abovebar
plotshape,plotchar機能の位置値。 形状は,メインシリーズ k 線上に描かれます。
タイプ
const string
続きを見る
plotshape plotchar location.belowbar location.top location.bottom location.absolute
location.belowbar
plotshape,plotchar機能の位置値。形状は,メインシリーズ k の線の下に描画されます。
タイプ
const string
続きを見る
plotshape plotchar location.abovebar location.top location.bottom location.absolute
location.top
plotshape,plotchar機能の位置値。形状は上部図の境界付近に描画される。
タイプ
const string
続きを見る
plotshape plotchar location.abovebar location.belowbar location.bottom location.absolute
location.bottom
plotshape,plotchar機能の位置値。 形状はグラフの底辺の近くに描かれます。
タイプ
const string
続きを見る
plotshape plotchar location.abovebar location.belowbar location.top location.absolute
location.absolute
plotshape,plotchar機能の位置値。形状はグラフに描かれ,指標値が価格座標として使用される。
タイプ
const string
続きを見る
plotshape plotchar location.abovebar location.belowbar location.top location.bottom
size
size.auto
size.auto
plotshape,plotchar機能の大きさの値。 形状の大きさは自動的にk線の大きさに適応する。
タイプ
const string
続きを見る
plotshape plotchar size.tiny size.small size.normal size.large size.huge
size.tiny
plotshape,plotchar機能のサイズ. 形状のサイズは微小.
タイプ
const string
続きを見る
plotshape plotchar size.auto size.small size.normal size.large size.huge
size.small
plotshape,plotchar機能のサイズ. 形状のサイズが小さい.
タイプ
const string
続きを見る
plotshape plotchar size.auto size.tiny size.normal size.large size.huge
size.normal
plotshape,plotchar機能の大きさの値。 形状のサイズは普通。
タイプ
const string
続きを見る
plotshape plotchar size.auto size.tiny size.small size.large size.huge
size.large
plotshape,plotchar機能のサイズ. 形状のサイズは大きい.
タイプ
const string
続きを見る
plotshape plotchar size.auto size.tiny size.small size.normal size.huge
size.huge
plotshape,plotchar機能の大きさの値。 形状のサイズは巨大。
タイプ
const string
続きを見る
plotshape plotchar size.auto size.tiny size.small size.normal size.large
alert
alert.freq_once_per_bar
alert() 関数の 'freq' 参数とともに使用される命名常数.
K行の最初の関数呼び出しがアラームを誘発する.
タイプ
const string
続きを見る
alert
alert.freq_all
alert() 関数の 'freq' 参数とともに使用される命名常数.
すべての関数呼び出しがアラームを誘発する.
タイプ
const string
続きを見る
alert
alert.freq_once_per_bar_close
alert() 関数の 'freq' 参数とともに使用される命名常数.
この関数の呼び出しは,リアルタイムKラインの最後のスクリプトのエピデーション中にのみ発生し,シャットダウン時にアラームを誘発する.
タイプ
const string
続きを見る
alert
format
format.inherit
命名定数である.
タイプ
const string
続きを見る
format.price format.volume
format.price
命名定数である.
タイプ
const string
注記
formatがformat.priceである場合は,デフォルトの精度値を設定します. 指数関数のprecisionパラメータを使用して精度値を変更できます.
続きを見る
format.inherit format.volume
format.volume
命名定数である.
タイプ
const string
続きを見る
format.inherit format.price
syminfo
syminfo.ticker
取引所前<unk>のない商品コード,例えば'MSFT'。
タイプ
simple string
続きを見る
syminfo.tickerid timeframe.period timeframe.multiplier
syminfo.tickerid
取引所の前文字を持つ商品コード,例えばBATS:MSFT<unk>,NASDAQ:MSFT<unk>。
タイプ
simple string
続きを見る
syminfo.ticker timeframe.period timeframe.multiplier
syminfo.basecurrency
商品のベース通貨.商品コード<unk> BTCUSD<unk>,返却<unk> BTC<unk>.
タイプ
simple string
続きを見る
syminfo.currency syminfo.ticker
syminfo.currency
現在の商品の通貨 返品通貨コード: <unk> USD<unk>, <unk> EUR<unk>等 <unk>
タイプ
simple string
続きを見る
syminfo.basecurrency syminfo.ticker
syminfo.type
現在の商品コードのタイプ。可能な値は,stock, futures, index, forex, crypto, fund, dr。
タイプ
simple string
続きを見る
syminfo.ticker
syminfo.mintick
現在の品種の最小刻度値.FMZ上で,リールディスク/反測インターフェース上の"Pine言語取引クラスデータベース"のテンプレートパラメータ価格設定通貨精度この値は制御できます.価格設定通貨精度設定2は,取引時の価格が小数点2位まで正確で,このとき価格の最小変動単位は0.01。syminfo.mintickの値は0.01。である.
タイプ
simple float
続きを見る
syminfo.pointvalue
syminfo.pointvalue
現在の商品のポイント値
タイプ
simple float
続きを見る
syminfo.mintick
syminfo.timezone
グラフの主なシリーズの交換時間帯。可能な値については,timestamp。を参照してください.
タイプ
simple string
続きを見る
timestamp
barstate
barstate.islastconfirmedhistory
市場が閉店する時に,スクリプトがデータセットの最後の K 線で実行されている場合,またはスクリプトがリアルK線前の K 線で実行されている場合,市場がオープンしている場合は,true を返します.
タイプ
series bool
注記
この変数のPineScriptコードを使用すると,履歴とリアルタイムのデータに対して異なる計算を行うことができます.
この変数/関数を使用すると,指標が再描画される可能性があります.
続きを見る
barstate.isfirst barstate.islast barstate.ishistory barstate.isrealtime barstate.isnew
barstate.isnew
脚本が現在新しいk行で計算している場合は true を返し,そうでない場合は false を返します.
タイプ
series bool
注記
この変数のPineScriptコードを使用すると,履歴とリアルタイムのデータに対して異なる計算を行うことができます.
この変数/関数を使用すると,指標が再描画される可能性があります.
続きを見る
barstate.isfirst barstate.islast barstate.ishistory barstate.isrealtime barstate.isconfirmed barstate.islastconfirmedhistory
barstate.isfirst
もし,現在の k 線が k 線群の最初の k 線であれば,true を返し,そうでない場合は,false を返します.
タイプ
series bool
注記
この変数のPineScriptコードを使用すると,履歴とリアルタイムのデータに対して異なる計算を行うことができます.
この変数/関数を使用すると,指標が再描画される可能性があります.
続きを見る
barstate.islast barstate.ishistory barstate.isrealtime barstate.isnew barstate.isconfirmed barstate.islastconfirmedhistory
barstate.islast
現在のk行がk行群の最後のk行である場合は,trueを返し,そうでない場合は,falseを返します.
タイプ
series bool
注記
この変数のPineScriptコードを使用すると,履歴とリアルタイムのデータに対して異なる計算を行うことができます.
この変数/関数を使用すると,指標が再描画される可能性があります.
続きを見る
barstate.isfirst barstate.ishistory barstate.isrealtime barstate.isnew barstate.isconfirmed barstate.islastconfirmedhistory
barstate.ishistory
現在k線が過去k線である場合,true を返し,そうでない場合は,false を返します.
タイプ
series bool
注記
この変数のPineScriptコードを使用すると,履歴とリアルタイムのデータに対して異なる計算を行うことができます.
この変数/関数を使用すると,指標が再描画される可能性があります.
続きを見る
barstate.isfirst barstate.islast barstate.isrealtime barstate.isnew barstate.isconfirmed barstate.islastconfirmedhistory
barstate.isconfirmed
もし,スクリプトが現在の k 行の最後の () 閉じる) 更新を計算しているなら,true を返します. 次のスクリプトは新しい K 行のデータで計算されます.
タイプ
series bool
注記
この変数のPineScriptコードを使用すると,履歴とリアルタイムのデータに対して異なる計算を行うことができます.
request.securityの式でbarstate.isconfirmedを使用することは推奨されません.これは,request.securityからのリクエストの値が予測できないからです.
この変数/関数を使用すると,指標が再描画される可能性があります.
続きを見る
barstate.isfirst barstate.islast barstate.ishistory barstate.isrealtime barstate.isnew barstate.islastconfirmedhistory
barstate.isrealtime
現在のk線がリアルタイムk線であれば,trueを返し,そうでない場合は,falseを返します.
タイプ
series bool
注記
この変数のPineScriptコードを使用すると,履歴とリアルタイムのデータに対して異なる計算を行うことができます.
この変数/関数を使用すると,指標が再描画される可能性があります.
続きを見る
barstate.isfirst barstate.islast barstate.ishistory barstate.isnew barstate.isconfirmed barstate.islastconfirmedhistory
barstate.time
暫定的に
ta
ta.accdist
累積/分布インデックス
タイプ
series float
ta.iii
円盤の強度指数
タイプ
series float
例として
pine
// Intraday Intensity Index
plot(ta.iii, color=color.yellow)
// the same on pine
f_iii() =>
(2 * close - high - low) / ((high - low) * volume)
plot(f_iii())
ta.nvi
負の体重指数
タイプ
series float
例として
pine
// Negative Volume Index
plot(ta.nvi, color=color.yellow)
// the same on pine
f_nvi() =>
float ta_nvi = 1.0
float prevNvi = (nz(ta_nvi[1], 0.0) == 0.0) ? 1.0: ta_nvi[1]
if nz(close, 0.0) == 0.0 or nz(close[1], 0.0) == 0.0
ta_nvi := prevNvi
else
ta_nvi := (volume < nz(volume[1], 0.0)) ? prevNvi + ((close - close[1]) / close[1]) * prevNvi : prevNvi
result = ta_nvi
plot(f_nvi())
ta.pvi
正量指数
タイプ
series float
例として
pine
// Positive Volume Index
plot(ta.pvi, color=color.yellow)
// the same on pine
f_pvi() =>
float ta_pvi = 1.0
float prevPvi = (nz(ta_pvi[1], 0.0) == 0.0) ? 1.0: ta_pvi[1]
if nz(close, 0.0) == 0.0 or nz(close[1], 0.0) == 0.0
ta_pvi := prevPvi
else
ta_pvi := (volume > nz(volume[1], 0.0)) ? prevPvi + ((close - close[1]) / close[1]) * prevPvi : prevPvi
result = ta_pvi
plot(f_pvi())
ta.obv
潮の指数
タイプ
series float
例として
pine
// On Balance Volume
plot(ta.obv, color=color.yellow)
// the same on pine
f_obv() =>
ta.cum(math.sign(ta.change(close)) * volume)
plot(f_obv())
ta.pvt
価格トレンド指数
タイプ
series float
例として
pine
// Price-Volume Trend
plot(ta.pvt, color=color.yellow)
// the same on pine
f_pvt() =>
ta.cum((ta.change(close) / close[1]) * volume)
plot(f_pvt())
ta.wad
ウィリアム・ドー・エアフォースライン
タイプ
series float
例として
pine
// Williams Accumulation/Distribution
plot(ta.wad, color=color.yellow)
// the same on pine
f_wad() =>
trueHigh = math.max(high, close[1])
trueLow = math.min(low, close[1])
mom = ta.change(close)
gain = (mom > 0) ? close - trueLow : (mom < 0) ? close - trueHigh : 0
ta.cum(gain)
plot(f_wad())
ta.wvad
ウィリアム変異の散離量
タイプ
series float
例として
pine
// Williams Variable Accumulation/Distribution
plot(ta.wvad, color=color.yellow)
// the same on pine
f_wvad() =>
(close - open) / (high - low) * volume
plot(f_wvad())
math
math.e
オーラ数の名乗定数である。それは2.7182818284590452に等しい。
タイプ
const float
続きを見る
math.phi math.pi math.rphi
math.phi
黄金分割の命名常数である。1.6180339887498948に等しい。
タイプ
const float
続きを見る
math.e math.pi math.rphi
math.pi
アキメド定数の名乗定数である。これは3.1415926535897932に等しい。
タイプ
const float
続きを見る
math.e math.phi math.rphi
math.rphi
黄金分割率の名乗定数である。これは0.6180339887498948に等しい。
タイプ
const float
strategy
strategy.equity
現在の権利権益 ((strategy.initial_capital + strategy.netprofit + strategy.openprofit))
タイプ
series float
続きを見る
strategy.netprofit strategy.openprofit strategy.position_size
strategy.position_size
現在の市場ポジションの方向と規模.値>0なら市場ポジションが長い.値<0なら市場ポジションが短い.絶対値は取引中の契約/株/手/単位数 (ポジションサイズ) である.
タイプ
series float
続きを見る
strategy.position_avg_price
strategy.position_avg_price
現在の市場位置は平均入場価格である。市場位置が平らな場合,<unk>NaN<unk>は退場する。
例示する
FMZ PINE Scriptの平均価格は,手数料を含む価格である。例えば:下場価格は8000,販売方向,数量1枚 (一枚),取引後の平均価格は8000,以下 (手数料を含む費用) である。
タイプ
series float
続きを見る
strategy.position_size
strategy.long
複数の方向へ
タイプ
strategy_direction
続きを見る
strategy.entry strategy.exit
strategy.short
空飛ぶ方向へ
タイプ
strategy_direction
続きを見る
strategy.entry strategy.exit
strategy.closedtrades
全体の取引間隔で閉鎖された取引の数
タイプ
series int
続きを見る
strategy.position_size strategy.opentrades
strategy.opentrades
取引数: 取引数: 取引数: 取引数: 取引数: 取引数: 取引数: 取引数:
タイプ
series int
続きを見る
strategy.position_size
strategy.netprofit
すべての取引の総通貨価値
タイプ
series float
続きを見る
strategy.openprofit strategy.position_size strategy.grossprofit
strategy.grossprofit
完成したすべての利益取引の総通貨価値
タイプ
series float
続きを見る
strategy.netprofit
strategy.openprofit
現在未開封のポジションの未実現損失.
タイプ
series float
続きを見る
strategy.netprofit strategy.position_size
strategy.direction.long
戦略を練り上げれば
タイプ
const string
続きを見る
strategy.risk.allow_entry_in
strategy.direction.short
戦略は空白です
タイプ
const string
続きを見る
strategy.risk.allow_entry_in
strategy.direction.all
余分な仕事と余分な空き時間の両方を可能にする戦略
タイプ
const string
続きを見る
strategy.risk.allow_entry_in
dayofweek
dayofweek
交換時間帯の現在のk線時間の週
タイプ
series int
注記
この変数は,K線の開いた時間に応じて日返します. 夜間の取引時間 (例えば,EURUSDは,その月曜日の取引時間は日曜日の17:00から始まります) の場合,この値は取引日の1日より低いことができます.
あなたは,dayofweek.sunday,dayofweek.monday,dayofweek.tuesday,dayofweek.wednesday,dayofweek.thursday,dayofweek.friday,およびdayofweek.saturdayの変数を使用して比較することができます.
続きを見る
time dayofmonth
dayofweek.sunday
dayofweek関数の返される値とdayofweek変数の値の命名常数である.
タイプ
const int
続きを見る
dayofweek.monday dayofweek.tuesday dayofweek.wednesday dayofweek.thursday dayofweek.friday dayofweek.saturday
dayofweek.monday
dayofweek関数の返される値とdayofweek変数の値の命名常数である.
タイプ
const int
続きを見る
dayofweek.sunday dayofweek.tuesday dayofweek.wednesday dayofweek.thursday dayofweek.friday dayofweek.saturday
dayofweek.tuesday
dayofweek関数の返される値とdayofweek変数の値の命名常数である.
タイプ
const int
続きを見る
dayofweek.sunday dayofweek.monday dayofweek.wednesday dayofweek.thursday dayofweek.friday dayofweek.saturday
dayofweek.wednesday
dayofweek関数の返される値とdayofweek変数の値の命名常数である.
タイプ
const int
続きを見る
dayofweek.sunday dayofweek.monday dayofweek.tuesday dayofweek.thursday dayofweek.friday dayofweek.saturday
dayofweek.thursday
dayofweek関数の返される値とdayofweek変数の値の命名常数である.
タイプ
const int
続きを見る
dayofweek.sunday dayofweek.monday dayofweek.tuesday dayofweek.wednesday dayofweek.friday dayofweek.saturday
dayofweek.friday
dayofweek関数の返される値とdayofweek変数の値の命名常数である.
タイプ
const int
続きを見る
dayofweek.sunday dayofweek.monday dayofweek.tuesday dayofweek.wednesday dayofweek.thursday dayofweek.saturday
dayofweek.saturday
dayofweek関数の返される値とdayofweek変数の値の命名常数である.
タイプ
const int
続きを見る
dayofweek.sunday dayofweek.monday dayofweek.tuesday dayofweek.wednesday dayofweek.thursday dayofweek.friday
hline
hline.style_dashed
Hline関数の点線形式の命名定数である。
タイプ
hline_style
続きを見る
hline.style_solid hline.style_dotted
hline.style_dotted
hline.style_dotted
Hline関数の点虚線形の命名定数である。
タイプ
hline_style
続きを見る
hline.style_solid hline.style_dashed
hline.style_solid
Hline関数の真心線型の命名定数である。
タイプ
hline_style
続きを見る
hline.style_dotted hline.style_dashed
barmerge
barmerge.gaps_on
要求されたデータ結合策を指定する. データを可能な差値 ((na値) と結合する.
タイプ
barmerge_gaps
続きを見る
request.security barmerge.gaps_off
barmerge.gaps_off
合併が要求するデータの策略. データは連続的に統合され,すべてのギャップは,前回の最近の現有値で埋められます.
タイプ
barmerge_gaps
続きを見る
request.security barmerge.gaps_on
barmerge.lookahead_on
合併が要求するデータ位置の策略。要求された条形図は,現在の条形図とk行開き時間に従って合併。この合併策は,未来<unk>からデータを取得する計算履歴に悪影響を及ぼす可能性がある。これは,逆行テスト策略では受け入れられないが,指標では使用できる。
タイプ
barmerge_lookahead
続きを見る
request.security barmerge.lookahead_off
barmerge.lookahead_off
合併されたデータ位置の要求策. 要求された条形図と現在の条形図は,k線閉塞時間に従って合併された. この合併策は,未来<unk>からデータ取得の計算歴史の影響を禁止した.
タイプ
barmerge_lookahead
続きを見る
request.security barmerge.lookahead_on
others
hl2
値の2分の2のショートキーです.
タイプ
series float
続きを見る
open high low close volume time hlc3 hlcc4 ohlc4
hlc3
この式は,この式を入力します.
タイプ
series float
続きを見る
open high low close volume time hl2 hlcc4 ohlc4
hlcc4
ショートキーが4で
タイプ
series float
続きを見る
open high low close volume time hl2 hlc3 ohlc4
ohlc4
これは,[開設価格 + 最高価格 + 最低価格 + 閉店価格]/4のショートキーです.
タイプ
series float
続きを見る
open high low close volume time hl2 hlc3 hlcc4
na
Double.NaN値 (非数字) について.
タイプ
simple na
例として
pine
// na
plot(bar_index < 10 ? na : close) // CORRECT
plot(close == na ? close[1] : close) // INCORRECT!
plot(na(close) ? close[1] : close) // CORRECT
注記
返される値のみ. 比較はしないでください. 特定の値がNaNかどうかを確認するには,内置関数na。を使用してください.
続きを見る
na
bar_index
現在の物価棒指数。番号は0から始まり,最初の項のインデックスは0。
タイプ
series int
例として
pine
// bar_index
plot(bar_index)
plot(bar_index > 5000 ? close : 0)
注記
bar_indexはバージョン4のnの変数を置き換えたことに注意してください.
注意してください,K索引は,最初の歴史K線から0。と算出されます.
この変数/関数を使用すると,指標が再描画される可能性があります.
続きを見る
barstate.isfirst barstate.islast barstate.isrealtime
last_bar_index
最後のグラフのK線のインデックス。K線は,最初のK線をゼロで開始。
タイプ
series int
例として
strategy("Mark Last X Bars For Backtesting", overlay = true, calc_on_every_tick = true)
lastBarsFilterInput = input.int(100, "Bars Count:")
// Here, we store the 'last_bar_index' value that is known from the beginning of the script's calculation.
// The 'last_bar_index' will change when new real-time bars appear, so we declare 'lastbar' with the 'var' keyword.
var lastbar = last_bar_index
// Check if the current bar_index is 'lastBarsFilterInput' removed from the last bar on the chart, or the chart is traded in real-time.
allowedToTrade = (lastbar - bar_index <= lastBarsFilterInput) or barstate.isrealtime
bgcolor(allowedToTrade ? color.new(color.green, 80) : na)
返される値
閉盤の最終歴史K指数,または開盤のリアルタイムK指数.
注記
この変数を使用すると,指標が再描画される可能性があります.
続きを見る
bar_index last_bar_time barstate.ishistory barstate.isrealtime
time
UNIX形式の現在のk行時間。 これは,1970年1月1日00:00:00 UTC以来のミリ秒数。
timenow
UNIX形式の現在の時間。 これは,1970年1月1日00:00:00 UTC以来のミリ秒数。
タイプ
series int
注記
この変数/関数を使用すると,指標が再描画される可能性があります.
続きを見る
timestamp time dayofmonth dayofweek
タイプ
series int
注記
この変数は,K線が開いている時間に応じて時間<unk>を返すことに注意してください. したがって,夜間取引の時間 (例えば,EURUSD,その月曜日の時間帯は日曜日の17:00から始まる) の場合,この変数は,取引日の指定日前の時間<unk>を返すことができます.例えば,EURUSDでは,dayofmonth (時間) <unk>は,取引日の日付より低い1になる可能性があります.なぜなら,現在の日付のK線は,実際には前日開いているからです.
続きを見る
time dayofmonth dayofweek
year
交換時間帯の現在の年k線。
タイプ
series int
注記
この変数は,K線の開いた時間に応じて年数を返すことに注意してください. 夜間の取引時間 ((例えば,EURUSDは,その月曜日の取引時間は日曜日の17:00から始まる) の場合,この値は取引日の年数より低い1。
続きを見る
year time month weekofyear dayofmonth dayofweek hour minute second
month
取引所の時間帯の現在の月線k。
タイプ
series int
注記
この変数は,K線の開いた時間に応じて月を返します. 夜間の取引時間 ((例えば,EURUSD,その月曜日の取引時間は日曜日の17:00から始まります) については,取引日の月より1〜低い値になります.
続きを見る
month time year weekofyear dayofmonth dayofweek hour minute second
hour
エクスチェンジタイムゾーンの現在の時間k線。
タイプ
series int
続きを見る
hour time year month weekofyear dayofmonth dayofweek minute second
minute
エクスチェンジタイムゾーンの現在の分 k線
タイプ
series int
続きを見る
minute time year month weekofyear dayofmonth dayofweek hour second
second
エクスチェンジ・タイムゾーンの現在のk秒線。
タイプ
series int
続きを見る
second time year month weekofyear dayofmonth dayofweek hour minute
open
公開価格:
タイプ
series float
注記
平方括弧演算子を使用できます.[前の値にアクセスします. たとえば, open[1],open[2]。
続きを見る
high low close volume time hl2 hlc3 hlcc4 ohlc4
high
現在最高価格
タイプ
series float
注記
平方括弧演算子を使用できます.[前の値,例えば △ high にアクセスします.[1],high[2]。
続きを見る
open low close volume time hl2 hlc3 hlcc4 ohlc4
low
価格の変更は,
タイプ
series float
注記
平方括弧演算子を使用できます.[前の値,例えば △ low にアクセスします.[1],low[2]。
続きを見る
open high close volume time hl2 hlc3 hlcc4 ohlc4
close
現行のK線が閉鎖された時の終了価格,または未完成のリアルK線の最終取引価格.
タイプ
series float
注記
平方括弧演算子を使用できます.[前の値,例えば close をアクセスする.[1],close[2]。
続きを見る
open high low volume time hl2 hlc3 hlcc4 ohlc4
volume
現在K線の運行量
タイプ
series float
注記
平方括弧演算子を使用できます.[前の値 (例えば,volume) にアクセスします.[1],volume[2]。
続きを見る
open high low close time hl2 hlc3 hlcc4 ohlc4
weekofyear
交換時間帯の現在のk線時間段の週数。
タイプ
series int
注記
この変数は,K線の開いた時間に基づいて週を返します. 夜間取引の時間 (例えば,EURUSDの月曜の取引時間は日曜日の17:00から始まります) の場合,この値は取引日の週より低い値になります.
続きを見る
weekofyear time year month dayofmonth dayofweek hour minute second
dayofmonth
交換時間帯の現在のk線時間の日付.
タイプ
series int
注記
この変数は,K線の開いた時間に応じて日返します. 夜間の取引時間 (例えば,EURUSDは,その月曜日の取引時間は日曜日の17:00から始まります) の場合,この値は取引日の1日より低いことができます.


- 1