RSIと移動平均に基づくマルチタイムフレーム取引戦略

1
Follow
1781
Followers
概要
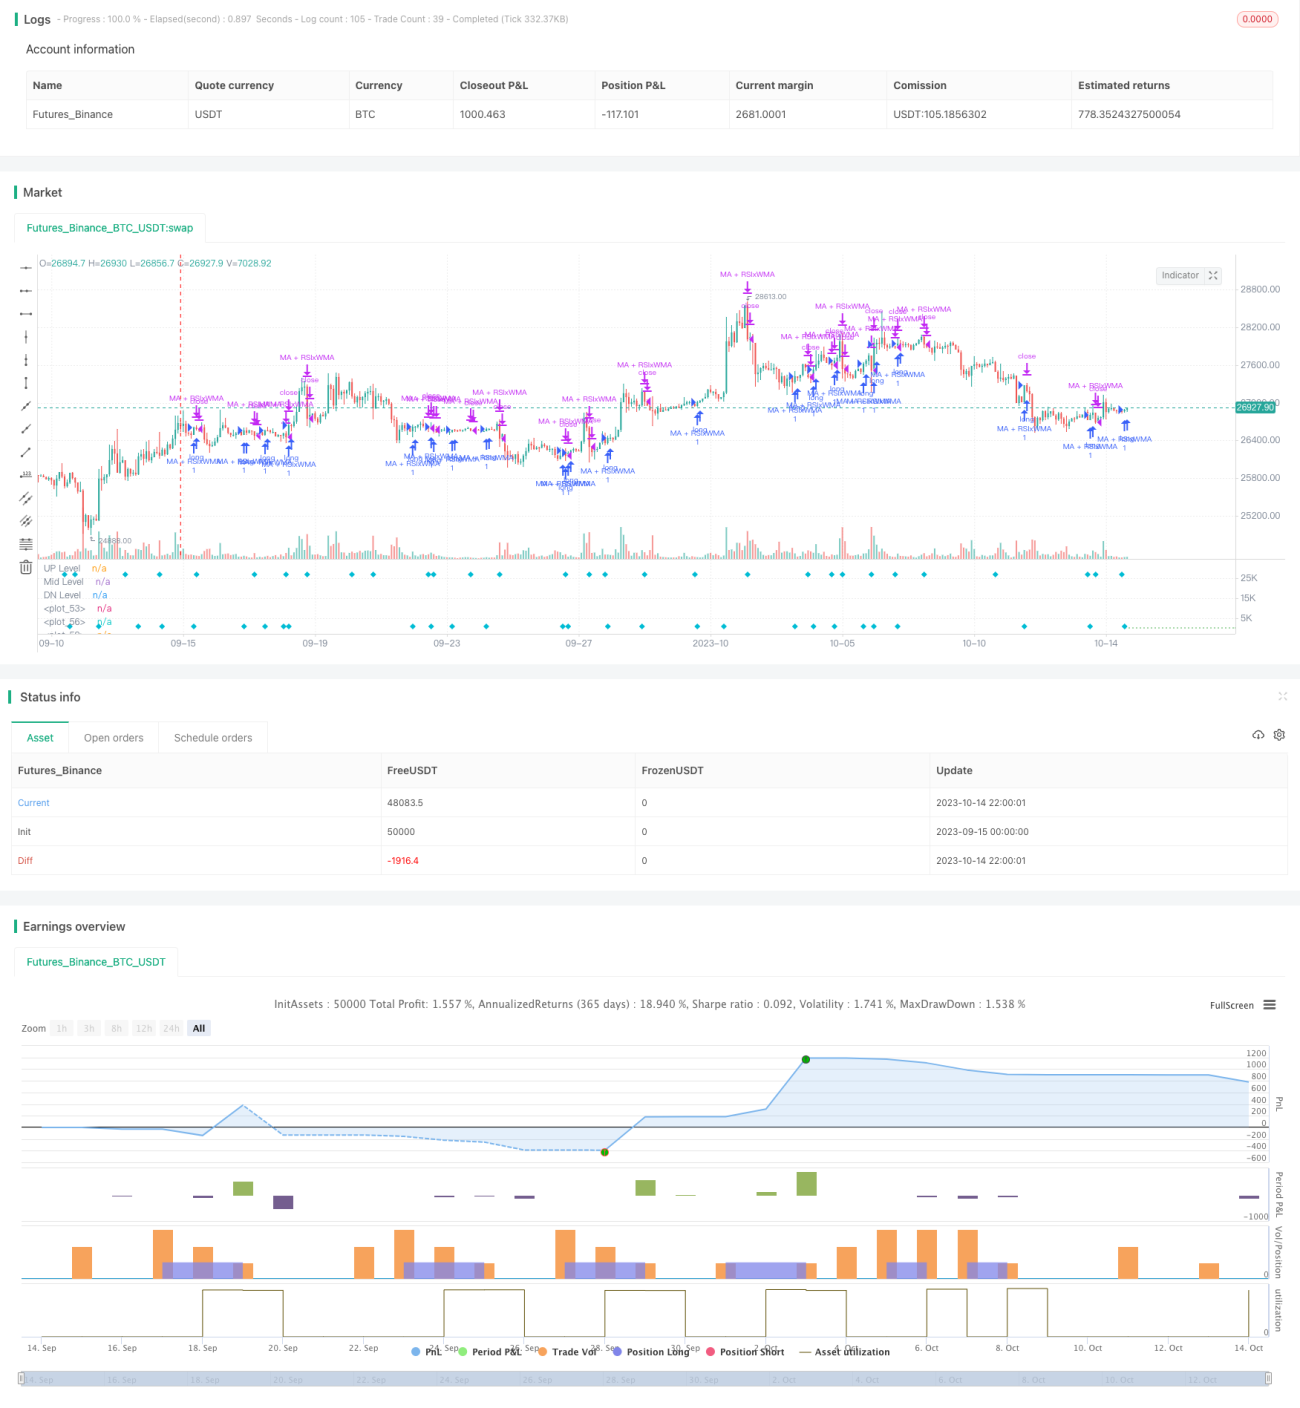
この戦略の核心思想は,比較的強い指数 ((RSI) と異なる時間周期の移動平均を同時に利用してトレンドの逆転点を認識し,中長期トレンドの同時進行でショートライン取引を行うことです.この戦略は,取引の成功率を向上させるために複数の取引信号を統合しています.
戦略原則
- RSI指標を計算し,快線EMAと慢線WMAの移動平均を計算する.
- RSIの指数線がWMA移動平均を突破すると,買入/売却のシグナルが生成されます.
- EMA速線がWMA慢線を突破すると,買/売シグナルが生成されます.
- RSIとEMAが同時にWMAを突破すると,強い買入/売却シグナルが生じます.
- また,価格が補助移動平均を突破すると,主信号が強化されます.
- 停止・停止条件を設定する.
この戦略は,複数の技術指標の突破信号を統合し,異なるパラメータの設定の移動平均によって,異なる周期のトレンドを識別し,戦略の信頼性を高めます. RSI指標は,超買い状態を判断し,EMA快線は,短期トレンドを判断し,WMA慢線は,中間トレンドを判断し,価格と補助平均の突破検証トレンドを判断します.
優位分析
- RSIの反転特性を利用して,超買い超売り区で反転のチャンスを掴むことができます.
- 移動平均をトレンドフィルターとして使用し,偽突破を避ける.
- 複数のタイムサイクルを組み合わせて,長線トレンドを追跡し,短線機会を捉えることができます.
- 複数の指標の信号を統合することで,取引の成功率を向上させることができます.
- ストップ・ストップ・ストップ戦略を設定して,リスクを積極的にコントロールできます.
リスク分析
- RSIは偽信号を発生しやすいため,移動平均のフィルタリングが必要である.
- 大周期的なトレンドの下での反発は,逆転の取引シグナルを誘発する可能性があるので,慎重に扱う必要があります.
- RSI周期長さ,移動平均周期などのパラメータ設定を最適化する必要があります.
- ストップ・ダメージ・ポイントの設定は慎重に設定し, ストップ・ダメージ・ポイントの設定は慎重に設定し, ストップ・ダメージ・ポイントの設定は慎重に設定する.
リスクは,パラメータ最適化,厳格なストップ・ローズ戦略,および大周期的なトレンドを考慮するなどの方法によって軽減できます.
最適化の方向
- RSIパラメータを最適化し,最適な周期長さを求めます.
- 移動平均の組み合わせをテストする
- ATRなどの波動率指標,動的調整ストップ・ローズ・ポジションを追加する.
- 取引量管理モジュールを追加
- 機械学習技術を用いてパラメータ最適化と信号品質評価を行う.
要約する
この戦略は,トレンド追跡と極点逆転取引のアイデアを統合し,複数の時間枠分析と複数の指標の総合利用を加え,取引の勝利率を向上させる目的である.リスクをうまく管理し,パラメータ設定を最適化し,適切な時に大周期トレンドの取引への影響を考慮することが重要です.全体的に,この戦略は,強力な実用性と適合性を持っています.
Source
Pine
Strategy parameters
Related strategies
Comment
All comments (0)
No data
- 1