
この戦略は,主に日線の相対筆体比 ((RB)) の均線交差信号を使用してトレンドを判断し,ストップとストップとで自動取引を行う.戦略の名前の対筆体比上昇幅は,日線対筆体比上昇幅を計算する平均線を指している。
この策略は,日K線の相対筆体比 (RB) の移動平均であるVitelotのRBI指数に基づいています. RBの計算方法は以下の通りです.
公式では,RBは陽線の実長と整形K線の長さの比率に等しく,正値をとる.陰線のRBは負値をとる.RBの取値範囲は-1から1の間である.
RBI指数はRBの移動平均を介してノイズをフィルターし,市場の本質的な特性を捉えます. RBI指数はRBI指数上の信号線を横切るときに買い信号を生じ; RBI指数はRBI指数下の信号線を横切るときに売り信号を生じます.
多頭不確定期における偽信号をフィルターするために,この戦略は,RBI指標の信号線を穿越する際には,閉店価格が13周期EMAの平均線より高いかどうかを判断し,それより高い場合は真の買取信号を生成する多頭戦略を実行する. 同様に,閉店価格が13周期EMAより低い場合にのみ空頭戦略を実行する.
この戦略はまた,リスクを制御し,利益をロックするために,ストップとストップ・ストップの仕組みを設定している.開設後,ストップ・ポイントの設定をトラッキングし,固定ポイントのストップ・ストップを設定している.
RBIの指標は多くのノイズをフィルターし,市場トレンドの特徴を捉え,揺れ動いている市場の偽の信号に惑わされないようにします.
均線フィルターと組み合わせると,多頭不確定期における偽信号を効果的に回避し,空頭損失を減らす.
ストップ・ストップ・キャップの設定は,個々のポジションの損失のリスクを低減し,利益をロックし,全体的な利益率を向上させるのに役立ちます.
この戦略はパラメータが少なく,理解しやすく,自動取引に適しています.
この戦略はRBIの指数のみに基づいているので,指数自体が誤った信号を生むと,全体的な戦略も失敗する.
指数パラメータの不適切な設定は,取引信号の質の低下にもつながる.
特定の市場の状況では,いかなる技術指標も失敗し,損失を完全に回避することはできません.
ストップポイントが小さすぎると,ストップが頻繁になる可能性があり,大きすぎると,単一の損失が拡大する可能性があります.
控えめに撤回すると,口座破綻の危険性があります.
RBI指標のパラメータを最適化するために,さまざまなパラメータの組み合わせをテストできます.
他の補助指標にフィルタリングを加え,信号の質を向上させることができる.
機械学習訓練により,止損停止のパラメータを最適化できます.
資金管理戦略に組み込み,全体のポジションとリスクの穴をコントロールできます.
ポジションを夜中に持てるか,ショートラインで取引するかのような,異なる時間帯の戦略を試すこともできます.
この戦略は,全体として,よりシンプルで直接的なトレンド追跡戦略である.日線対筆体比の均線交差を計算してトレンド方向を判断し,均線フィルターと止損を追加してリスクを制御し,揺れ市場の偽信号を効果的に回避することができる.しかし,いかなる技術指標戦略も,リスクを完全に回避することはできません.
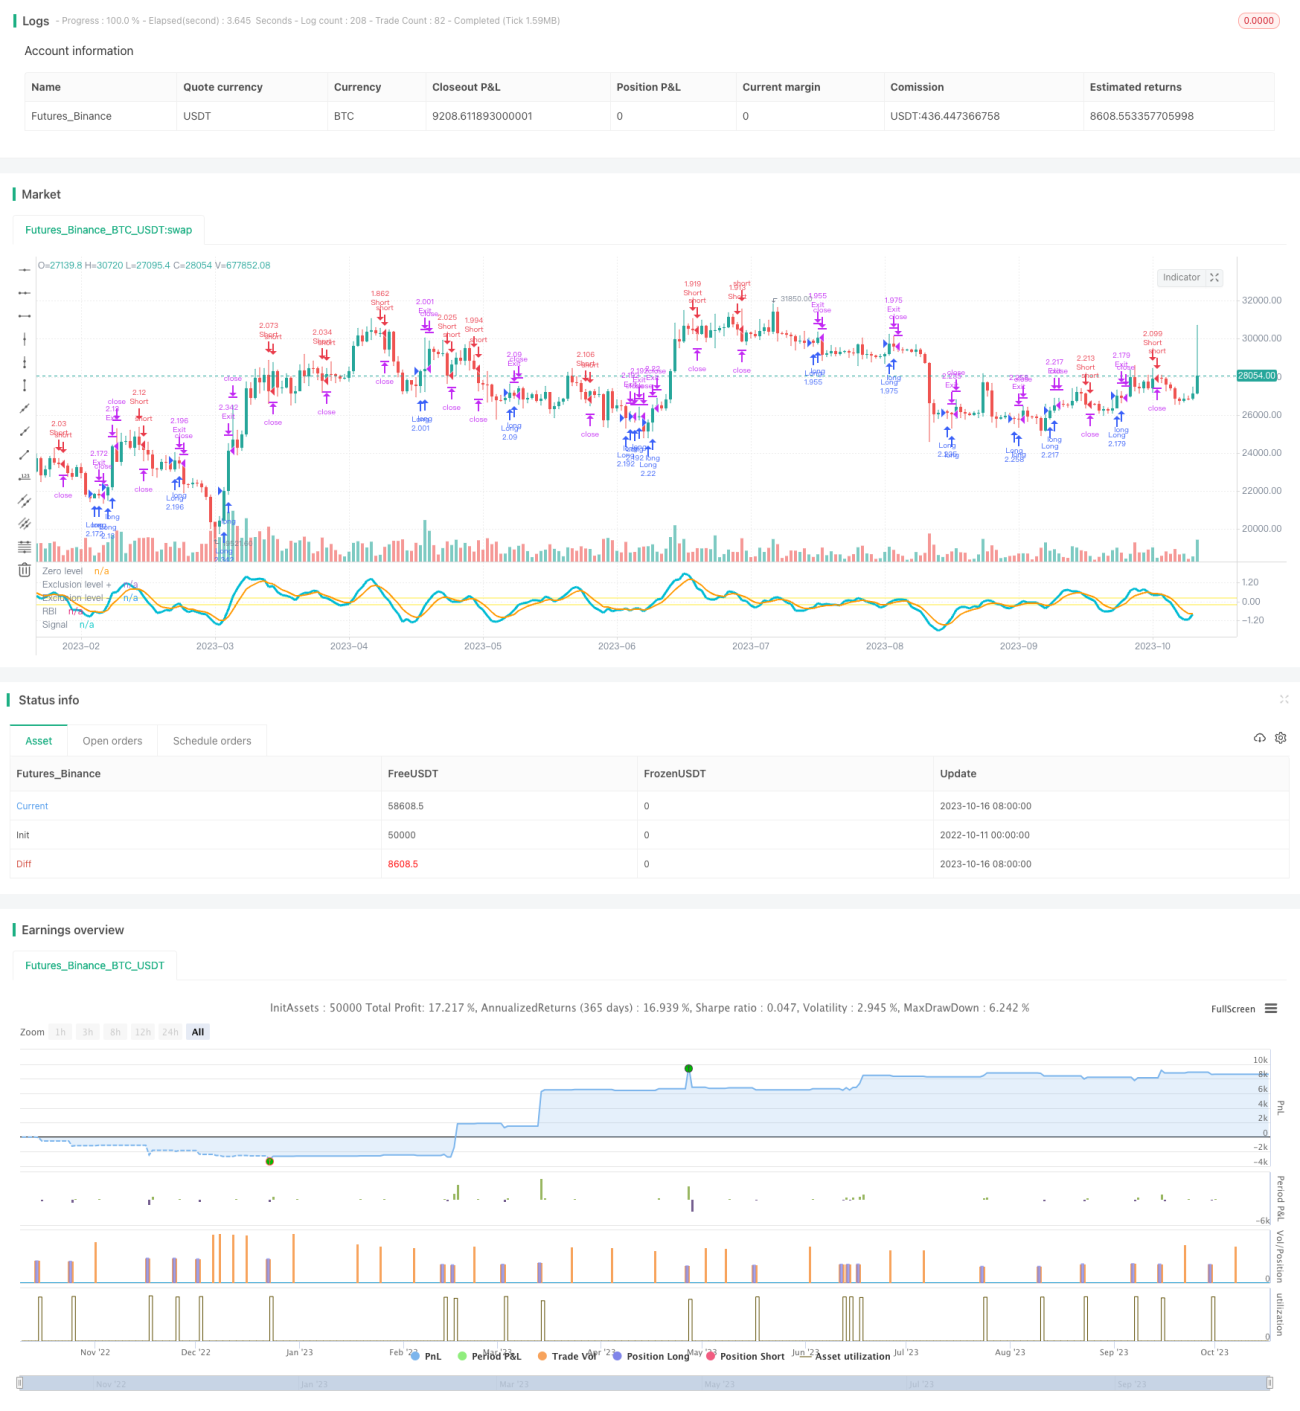
/*backtest
start: 2022-10-11 00:00:00
end: 2023-10-17 00:00:00
period: 1d
basePeriod: 1h
exchanges: [{"eid":"Futures_Binance","currency":"BTC_USDT"}]
*/
//@version=3
strategy("RBI Backtest /w TSSL", shorttitle="RBI Strategy", overlay=false, default_qty_type = strategy.percent_of_equity, default_qty_value = 100, initial_capital = 10000, slippage = 5)
// RBI:
// The EMA of the relative body (RB) of Japanese candles is evaluated.
// The RB of a candle (my definition) is simply the ratio of the body with respect to its full length
// and taken positive for bull candles and negative for bear candles:
// e.g. a bull "marubozo" has RB=1 a bear "marubozo" has RB=-1;
// a "doji" has RB=0.
// This simple indicator grasps the essence of the market by filtering out a great deal of noise.
//
// A flag can be selected to calculate its very basic binary version, where a bull candle counts as a one
// and a bear candle counts as a minus one.
//
// Enter (or exit) the market when the signal line crosses the base line.
// When the market is choppy we have a kind of alternating bear and bull candles so that
// RBI is FLAT and usually close to zero.
// Therefore avoid entering the market when RBI is FLAT and INSIDE the Exclusion level.
// The exclusion level is to be set by hand: go back in history and check when market was choppy; a good
// way to set it is to frame the oscillations of RBI whe price was choppy.
//
// RBI is more effective when an EMA of price is used as filtering. I found EMA(13) to be
// a decent filter: go long when base crosses signal upwards AND closing price is above EMA(13);
// same concept for going short.
//
// As any other indicator, use it with responsibility: THERE CAN'T BE A SINGLE MAGIC INDICATOR winning
// all trades.
//
// Above all, have fun.
//
// Vitelot/Yanez/Vts March 31, 2019
par1 = input(5, title="MA1 Period")
par2 = input(5, title="Signal Period")
exclusion = input(0.2, title="Exclusion level")
useBin = input(false, title="Calculate the binary version")
treshold_long = input(0, title="Treshold Long")
treshold_short = input(0, title="Treshold Short")
fixedSL = input(title="SL Activation", defval=300)
trailSL = input(title="SL Trigger", defval=1)
fixedTP = input(title="TP Activation", defval=120)
trailTP = input(title="TP Trigger", defval=1)
FromMonth = input(defval = 1, title = "From Month", minval = 1, maxval = 12)
FromDay = input(defval = 1, title = "From Day", minval = 1, maxval = 31)
FromYear = input(defval = 2019, title = "From Year", minval = 2017)
ToMonth = input(defval = 6, title = "To Month", minval = 1, maxval = 12)
ToDay = input(defval = 19, title = "To Day", minval = 1, maxval = 31)
ToYear = input(defval = 2020, title = "To Year", minval = 2017)
start = timestamp(FromYear, FromMonth, FromDay, 00, 00) // backtest start window
finish = timestamp(ToYear, ToMonth, ToDay, 23, 59) // backtest finish window
startTimeOk() => true // create function "within window of time" if statement true
ynSimple(t) =>
s = (close>open)? 1: -1
ema(sum(s,t),t)
ynRel(t) =>
s = (close-open)/(high-low)
ema(sum(s,t),t)
yn = useBin? ynSimple(par1): ynRel(par1)
sig = ema(yn,par2)
plot(yn, color=aqua, title="RBI", linewidth=3, transp=0)
plot(sig, color=orange, title="Signal", linewidth=2, transp=0)
hline(0, color=white, title="Zero level", editable=false)
hline(exclusion, color=yellow, title="Exclusion level +", editable=true, linestyle=line)
hline( 0-exclusion, color=yellow, title="Exclusion level -", editable=true, linestyle=line)
long = crossover(yn,sig) and yn < treshold_long
short = crossover(sig,yn) and yn > treshold_short
// === STRATEGY - LONG POSITION EXECUTION ===
strategy.entry("Long", strategy.long, when= long and startTimeOk())
strategy.exit("Exit", qty_percent = 100, loss=fixedSL, trail_offset=trailTP, trail_points=fixedTP)
strategy.exit("Exit", when= short)
// === STRATEGY - SHORT POSITION EXECUTION ===
strategy.entry("Short", strategy.short, when= short and startTimeOk())
strategy.exit("Exit", qty_percent = 100, loss=fixedSL, trail_offset=trailTP, trail_points=fixedTP)
strategy.exit("Exit", when= long)