マルチタイムフレームボトム反転戦略

概要
この戦略は,複数の基礎形状指標の組み合わせを使用して,大幅な逆転のタイミングを識別し,トレンドを追跡するストップ・ロスの戦略を採用し,ストップ・ロスを上回る利益を目標とする.
原則
この戦略は,以下のような指標を基に底部反転を判断します.
-
ノロのBottomSensivity:K線が特定の底形を発現しているかどうかを判断する.
-
確定性意志指数 (CVI):多空心理が変化に直面していると判断する
-
究極の指標 ((UCS): 超落下が平均線から離れている状況を判断する.
-
RSI (リターン・レート・インディケーター): 超売り状況を判断する.
-
形状の組み合わせ:<unk>形,図釘など様々な底形を含む.
この戦略は,複数の底盤指標の組み合わせを使用し,戦略のパラメータの設定された底盤形の数を満たしたときに,買入シグナルを生成する.偽の突破をフィルタリングするために,戦略は,RSI指標の判断も加え,超売りしたときにのみ買入を誘発する.
ユーザは,それぞれの底辺判断指標の使用とパラメータをカスタマイズすることができ,高度な柔軟性を実現します.同時に,戦略はSMA均線フィルターを追加し,トレンドの下ではあまりしないようにします.
利点
-
複数の指標を用いて判断し,確実性を高める
-
各種に合わせてカスタマイズ可能な指標パラメータ
-
SMAは平行フィルターで,頂点を回避します.
-
赤K線での入場のみを設定し,リスクを下げます.
-
リアルタイムで監視できる 弹窗警報
リスク
-
多指数組合せの判断は底を見落としているかもしれない
-
底辺の形は常に逆転しているとは限りません
-
取引量が逆転を支えるか注目すべき
最適化の方向
-
指標パラメータ配置を最適化し,異なる品種に適応する
-
倉庫管理を増やし,倉庫増設でコストを削減する
-
ストップ・トレンドのストップ・トレンドのストップ・トレンドを
要約する
この戦略は,多指標判断を充分活用して,底辺の識別精度を高め,トレンドを追跡してストップ・ロスをロックして,利益を得ることで,リスクを効果的に制御できます。しかし,取引量が反転トレンドを支えるかどうかについては,依然として注意が必要です。ユーザーは,品種特性に応じてパラメータを最適化して,異なる市場環境に対応することができます。
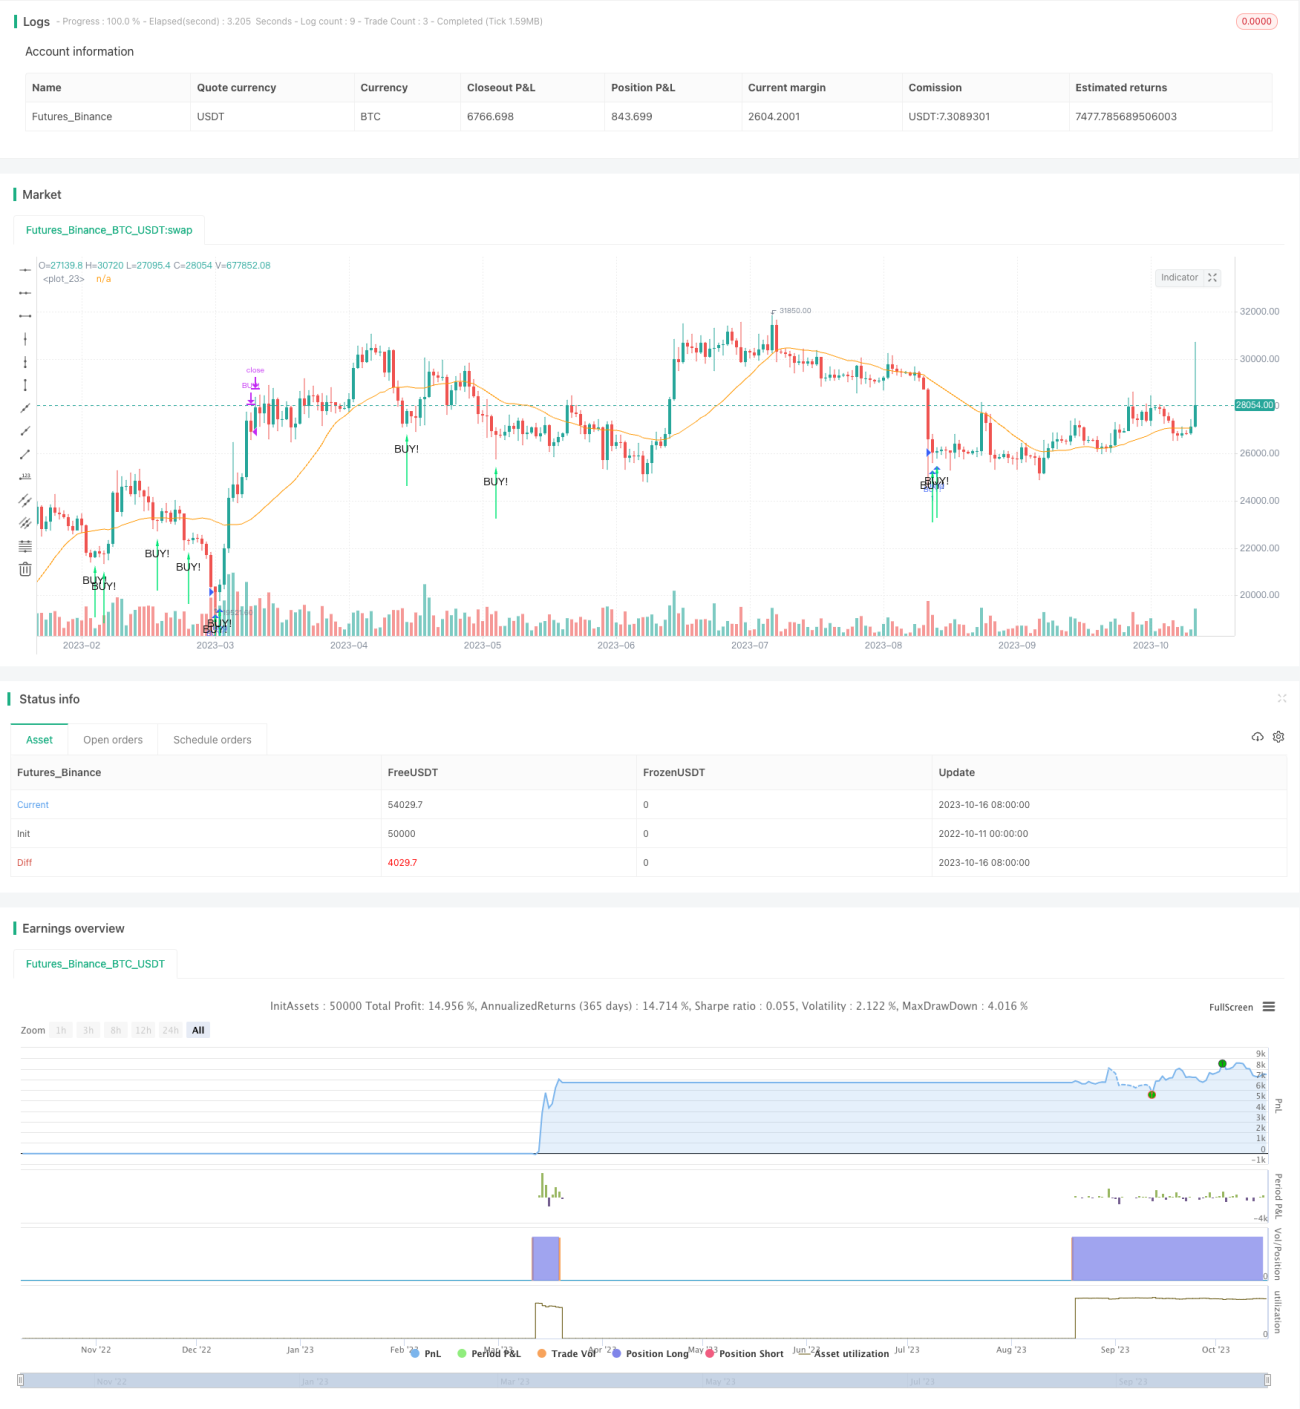
/*backtest
start: 2022-10-11 00:00:00
end: 2023-10-17 00:00:00
period: 1d
basePeriod: 1h
exchanges: [{"eid":"Futures_Binance","currency":"BTC_USDT"}]
*/

// the original indicator is Noro's BottomSensivity v0.6
//@version=4
strategy("Noro's BottomSensivity v0.6 strategy + rsi + Alarm", shorttitle="Bottom 0.6 StRsiAlarm", overlay=true)
- 1