ホール指標とストキャスティクス指標の組み合わせ取引戦略

概要
この戦略は,ホールの指数を使用してトレンドの方向を判断し,ランダムな指数と組み合わせて入場を行う.ホールの中線で下線を突破するときに看板入場,下線を突破するときに空き入場する.また,ランダムな指数K線が超買区の下からD線を突破するときに多し,超売区から空きを突破するときに空きする.
戦略原則
この取引戦略は,主に市場トレンドの方向性を判断するためにホール指数を使用し,ランダムな指数を使用して具体的な入場を行います.
まず,戦略では,ホールの指標の計算方法が定義され,中軌道,上軌道,下軌道の計算式が含まれている.中軌道は,上軌道と下軌道が,それぞれ中軌の偏移である加重移動平均WMAの計算を採用している.
次に,中軌と上下軌の関係によってトレンドの方向を判断する.中軌上下軌を突破する時は,強引な買取を代表し,看板のトレンドである.中軌下軌を突破する時は,強引な売りを代表し,看板のトレンドである.
さらに,策略では,K値とD値の計算公式を含むランダム指標の計算方法も定義されている. K値はRSIのSMA平滑を採用し,D値はK値の再びSMA平滑である.
トレンドの方向を判断した後に,看板であれば,ランダムな指標のK線が超売り区域の下からD線を横切るときに多めに;看板であれば,K線が超買い区域上からD線を横切るときに空にする.
このように,ホール指数のトレンド判断とランダム指数の超買超売判断を組み合わせて,比較的に安定で正確な入場を行うことができる.
優位分析
この戦略の最大の利点は,トレンド判断と超買い超売り判断を組み合わせることで,市場を多次元的に分析でき,入場精度が高いことです.
具体的には,以下のような利点があります.
-
ホール指数は,市場トレンドの方向を判断し,大レベルの定位を行うのに有効である.
-
ランダムな指標で超買いと超売りを判断し,買い手力の変化を把握し,入場のタイミングを把握する.
-
この2つの組み合わせは,それぞれの優位性を発揮し,相互の信号を検証し,偽信号を減らすことができます.
-
パラメータの調整により,異なる品種と時間周期に柔軟に適応し,適用性が高い.
-
中軌道偏移を用いて上下軌道を形成し,潜在的サポートとレジスタンスを見つけることができる.
-
STOP LOSS,EXIT ON TARGETS ポジションをスケールするために使用されるパーセント
-
Use of hull data Dictionary gives multiple asset class flexibility
-
選択された最適化方向は,戦略の安定性と収益性を向上させる
リスク分析
この戦略にはいくつかのリスクがあります.
-
ホール指数は後退しており,トレンドの転換点を逃し,不必要な損失を招く可能性があります.
-
ランダムな指標パラメータの設定が不適切である場合,余分な信号が生成され,K線とD線の交差信号を適切にフィルターする必要があります.
-
ホール指標はランダム指標と組み合わせて使用され,パラメータが正しくマッチングされていない場合,誤信号が発生する可能性があります.
-
上下軌道の幅が大きすぎても小さすぎても取引信号の質に影響し,最適なパラメータを見つけるために注意深くテストする必要があります.
-
最近の状況は不安定で,中長線指標の効果は不良かもしれない.
-
Data mismatches between hull and stoch causing false signals
-
Sharp trend changes not caught by hull can cause losses
-
Testing on more timeframes/symbols needed to verify robustness
これらのリスクに対して,以下のポイントから最適化できます.
-
ホール指標の長さを適切に短縮し,トレンドの変化に対する感受性を高めます.
-
ランダムな指標のパラメータを最適化し,偽信号を減らす.
-
上下軌道のパラメータを調整し,最適な通路幅を探します.
-
MACDなどの他の指標認証信号を追加します.
-
リスク管理のための止損策を追加する.
最適化の方向
この戦略は,以下の点で最適化できます.
-
より多くの品種と時間周期のパラメータをテストし,戦略の安定性を検証する.
-
付加された止損機構. 尾行止損,移動止損など,リスクをより良く制御することができる.
-
入場条件の論理を最適化し,より厳格なフィルタリング条件を設定し,偽信号を減らす.
-
ホール指数チャネルを活用してサポートとレジスタンス点をよりよく決定する方法の研究.
-
他の指標の検証信号を追加するかどうかを調べる.
-
パラメータ最適化.例えば,ホール指数長,ランダム指数K,Dの平滑パラメータ等の最適化.
-
ポジション管理機能を追加. ポジションのサイズを撤回数,連勝数などに合わせて調整する.
-
ストップダストとストップストップのルールが追加されました.
-
Optimize hull length parameter for better trend sensitivity
-
Add additional filters or confirming indicators to improve signal quality
-
Explore using hull bands to identify dynamic support/resistance levels
-
Parameter optimization for stoch RSI lengths, overbought/oversold levels
-
Introduce better position sizing and risk management rules
要約する
全体的に見ると,この戦略はトレンド判断と超買い超売り判断を統合して入場を行うのが有効な考えである.しかし,指標自体が問題があるため,取引シグナルも完全には信頼できないため,さらなる最適化が必要である.最適なパラメータの組み合わせを見つけることができれば,他の検証指標とリスク管理手段で補完されれば,この戦略の効果は期待できる.総じて,パラメータ調整,止損機構,ポジション管理などの面でより多くのテストと最適化が必要になるため,この戦略は安定して信頼でき,現場で利益を得ることができる.
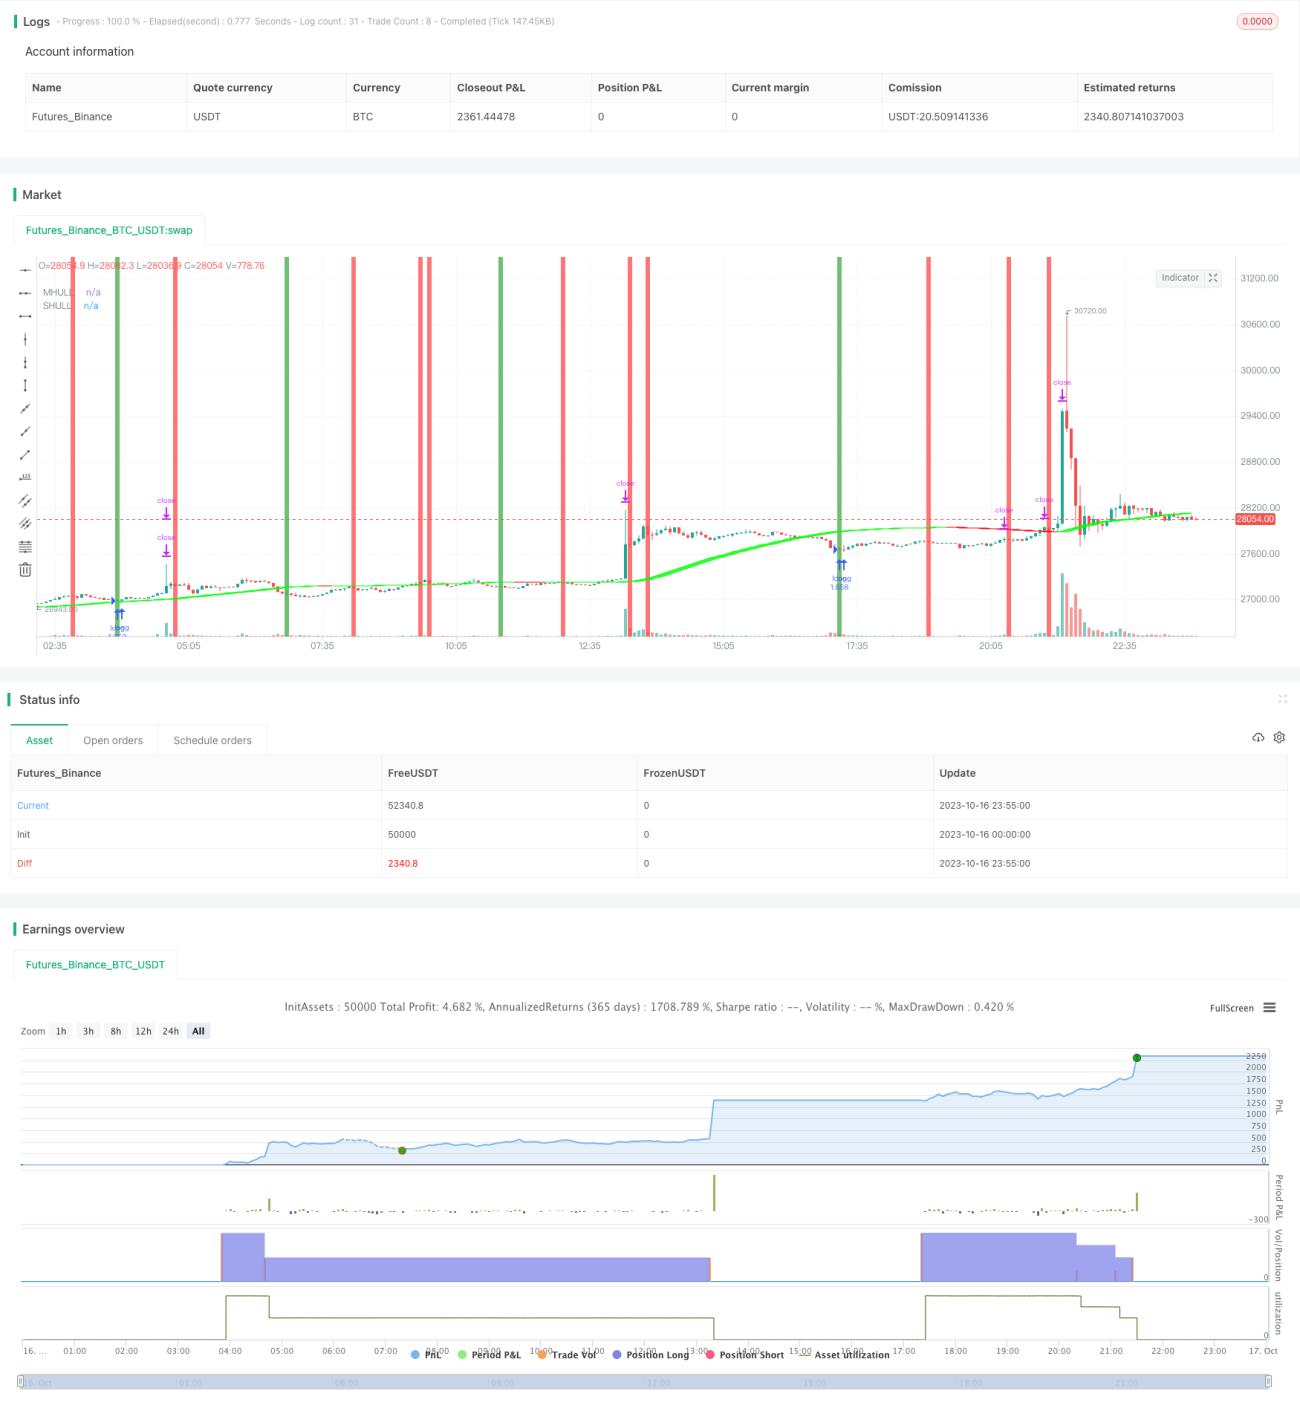
/*backtest
start: 2023-10-16 00:00:00
end: 2023-10-17 00:00:00
period: 5m
basePeriod: 1m
exchanges: [{"eid":"Futures_Binance","currency":"BTC_USDT"}]
*/

//@version=4
//Basic Hull Ma Pack tinkered by InSilico
//Converted to Strategy by DashTrader
strategy("Hull Suite + Stoch RSI Strategy v1.1", overlay=true, pyramiding=1, initial_capital=100, default_qty_type= strategy.percent_of_equity, default_qty_value = 100, calc_on_order_fills=false, slippage=0,commission_type=strategy.commission.percent,commission_value=0.023)- 1