移動平均リトレースメント戦略


作成日: 2023-10-23 15:31:21 最終変更日: 2023-10-23 15:31:21
コピー: 1 クリック数: 647
1
フォロー
1617
フォロワー

移動平均リトレースメント戦略

概要

この戦略は,主に移動平均の法則を用い,株式が短期間の超下落後に反発の機会を探している. 急速移動平均が遅い移動平均の下にあるときは,株式が下落傾向にあることを示している. 価格が急速移動平均を一定幅に下落した後,再び下落する余地が限られているとき,価格が急速移動平均を突破して再び上昇することができれば,株式の下落傾向が終わったことを示している.

戦略原則

  1. 急速移動平均 EMA (例えば8日線) とゆっくり移動平均 SMA (例えば20日線) を設定する.

  2. SMAがEMAより上であるとき,指示は上昇傾向にある.SMAがEMAより下であるとき,指示は下落傾向にある.

  3. 価格がEMAを一定幅 (例えば2-10%) を破った後に,株は超下落領域に入ると,反発する可能性が高い.

  4. 価格が再び上昇してEMAを超えると,それは買取信号である.

  5. ストップラインはEMAの近く,ストップラインは中間の遅い移動平均SMA (例えば50日線) の近く,または一定の割合でストップラインである.

  6. 価格が再びEMAを下回ると,清算停止.

戦略的優位性

  • 移動平均の法則を利用して,比較的信頼性が高い.

  • 急速移動平均と超下幅の条件を用いて,超下幅の反発を決定する確率を高めることができる.

  • ストップ・ローズとストップ・ストップの条件を設定し,リスクを制御します.

  • 異なるリスクの好みに合わせて,柔軟に配置できるポジション比率.

戦略リスク

  • 超下落の条件が加えられているにもかかわらず,反発の失敗の可能性は存在する.

  • 移動平均は,それ自体が後退性があり,局所的な反転に漏れやすい.

  • ストップポイントは速動平均に近いので,波動が大きいときは簡単に打ち出されます.

  • パラメータの構成は人工で,結果に影響は大きい.

  • 株価は,株価と関連性がある.

戦略最適化の方向性

  • トレンド判断の指標を増やして逆操作を避ける

  • 取引量などの指標をフィルターして成功率を上げます.

  • ストップダメージポイントは,動的追跡を考慮して,ストップダメージがヒットする確率を減らすことができます.

  • パーメータ依存性を減らすために最適なパラメータの組み合わせを研究できます.

  • 株式選択の条件を組み合わせて,株式選択の効果を高めることができます.

要約する

この戦略の整体思路は明確で分かりやすいもので,移動平均反転取引戦略の典型的代表である。優点は,比較的安定し,リスクを制御でき,初心者の掌握に適している。しかし,一定確率で反転点を正しく判断できない問題もある。他の指標,動的止損,パラメータ最適化などの手段を組み合わせて改善し,戦略の安定性を高めることができる。全体的には,信頼性の高い短線反転戦略思路であり,学ぶに値する。
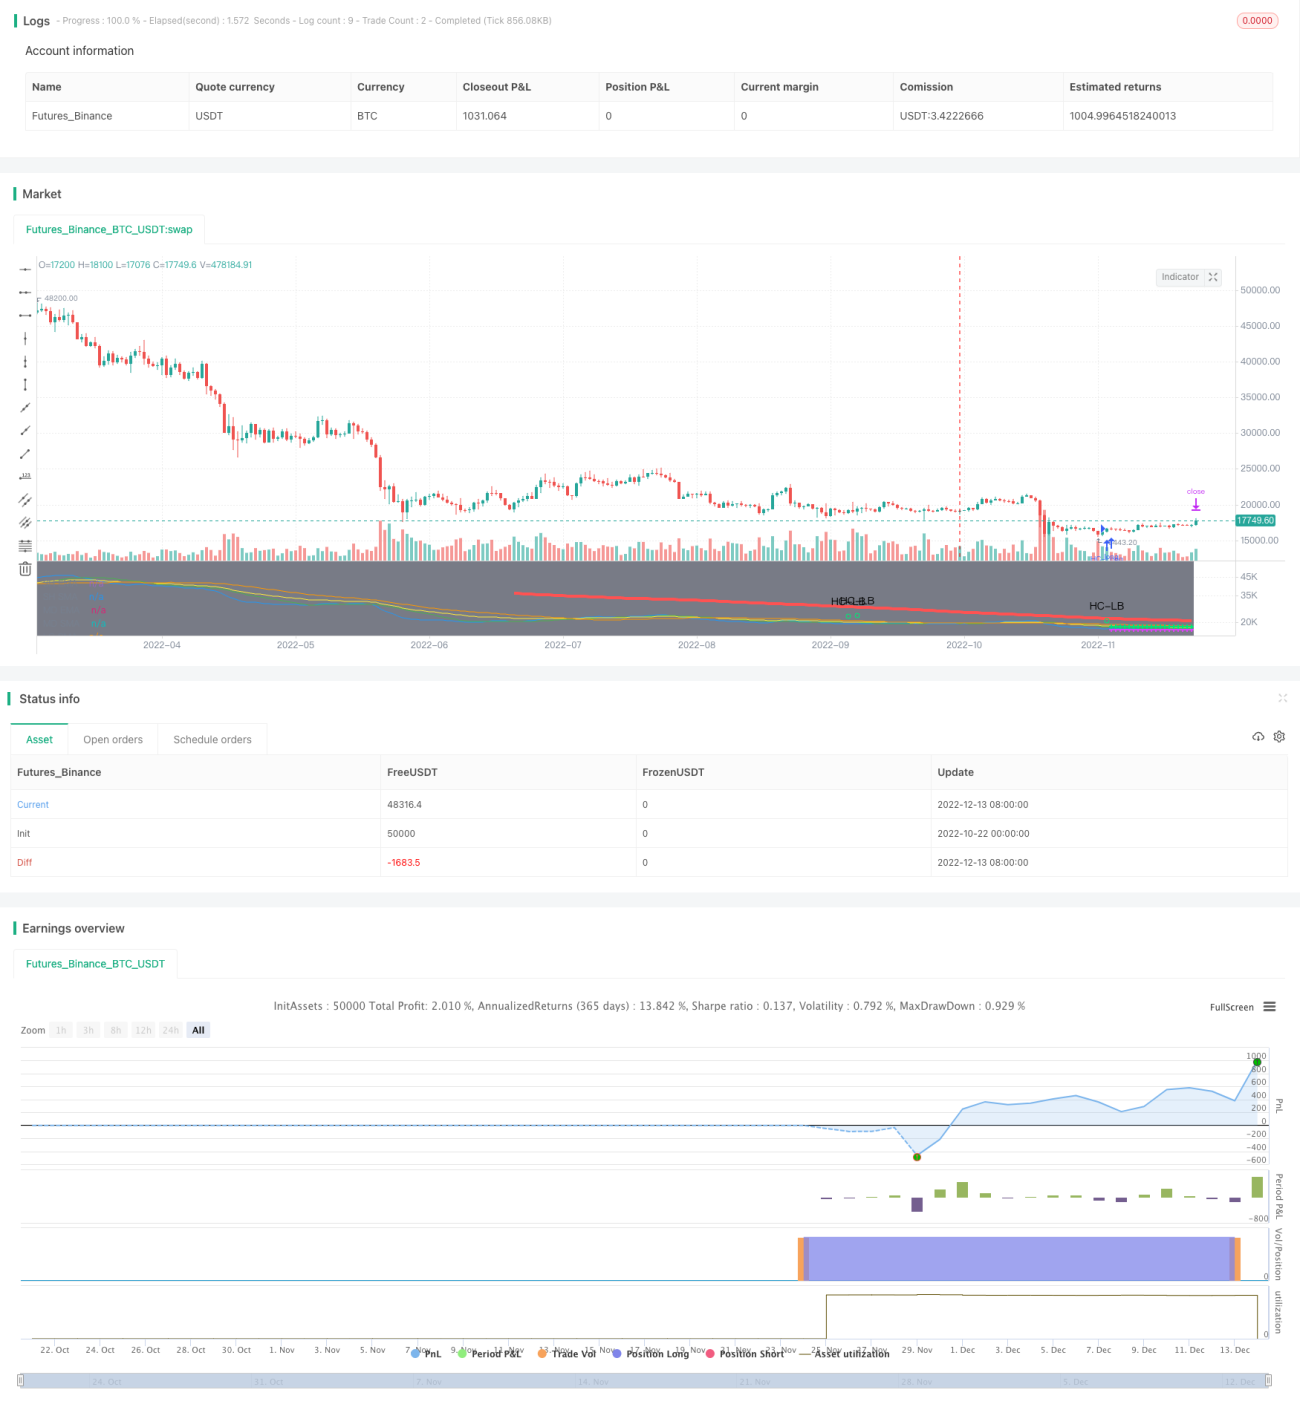
ストラテジーソースコード
/*backtest
start: 2022-10-22 00:00:00
end: 2022-12-14 00:00:00
period: 1d
basePeriod: 1h
exchanges: [{"eid":"Futures_Binance","currency":"BTC_USDT"}]
*/

//@version=4

// This source code is subject to the terms of the Mozilla Public License 2.0 at https://mozilla.org/MPL/2.0/
// © MakeMoneyCoESTB2020


//*********************Notes for continued work***************

//************************************************************

//I. Intro
//This strategy is designed to allow you to catch the bounce or "SNAP Back" of a equity that has been in a downward trend.
//Once the moving averages are in the order of 200SMA > 50 SMA > 34EMA > 20SMA > 8EMA, the strategy is setup.
//Next you wait for a trigger of the closing price crossing over the 8EMA, while there is a desired gap size between the 8EMA and the 20SMA (2-10% of stock value preferred).
//Exit position based on target profit reached (conservative sell half at 34EMA and engage a trailing stop loss for remainder or set static limit) or price crosses 8EMA or stop loss%
//*)This code also allows you to determine your desired backtesting date compliments of alanaster
//This code is the product of many hours of hard work on the part of the greater tradingview community.  The credit goes to everyone in the community who has put code out there for the greater good.
//The idea for the coding came from video I watched on YouTube presented by TradeStation called Snap Back - thank you guys for the inspiration.


//UPDATE: I have coded the other side of the strategy to allow you to take advantage of the same set-up in an uptrend for Short plays.  You can turn the up or downsides on, off, or both.

//Happy Hunting!


//II. Table Of Contents
    // 1. Define Strategy Variables
    // 2. Perform Calculations
    // 3. Display Chart Information
    // 4. Determine Entry Conditions
    // 5. Determine Exit Conditions


// 1. Define Strategy Variables*************************************************************************************************************************************************************************

//Title
// strategy("SNAP BACK 2.0 Strategy", shorttitle="SNAP Back 2.0", default_qty_type=strategy.percent_of_equity, default_qty_value=5, initial_capital=20000,slippage=2, currency=currency.USD, overlay=true)

//Define calculations price source
price = input(title="Price Source", defval=close)

//Define Trade Agression Level
aggro=input(title="Aggressive = 0, Conservative = 1", defval=0, options=[0, 1])

//Define Gap percentage allowed between 8EMA and 20SMA
GAP=input(title="Gap% between 8EMA & 20SMA", defval=2, minval=0, maxval=25, step=1)/100

//Does user want to run the Strategy for Trending Up or Trending Down
RunTrend=input(title="Run Strategy Trending Up, Down, or Both", defval="Up", options=["Up", "Down", "Both"])

//Initialize  8/34EMA  20/50/200/200SMA 
SH_EMA_length= input(title="SH EMA Length", defval=8) //short EMA length
MD_EMA_length= input(title="MD EMA Length", defval=34) //medium EMA length

SH_SMA_length= input(title="SH SMA Length", defval=20) //short SMA length
MD_SMA_length= input(title="LG SMA Length", defval=50) //medium SMA length
LG_SMA_length= input(title="SH SMA Length", defval=200) //long SMA length

SH_EMA=ema(price, SH_EMA_length) //short EMA 
MD_EMA=ema(price, MD_EMA_length) //medium EMA
SH_SMA=sma(price, SH_SMA_length) //short SMA 
MD_SMA=sma(price, MD_SMA_length) //medium SMA
LG_SMA=sma(price, LG_SMA_length) //long SMA

// 2. Perform Calculations*************************************************************************************************************************************************************************

// ************************************ INPUT BACKTEST RANGE ******************************************=== coutesy of alanaster
fromMonth = input(defval = 4,    title = "From Month",      type = input.integer, minval = 1, maxval = 12)
fromDay   = input(defval = 1,    title = "From Day",        type = input.integer, minval = 1, maxval = 31)
fromYear  = input(defval = 2020, title = "From Year",       type = input.integer, minval = 1970)
thruMonth = input(defval = 1,    title = "Thru Month",      type = input.integer, minval = 1, maxval = 12)
thruDay   = input(defval = 1,    title = "Thru Day",        type = input.integer, minval = 1, maxval = 31)
thruYear  = input(defval = 2112, title = "Thru Year",       type = input.integer, minval = 1970)

// === INPUT SHOW PLOT ===
showDate  = input(defval = true, title = "Show Date Range", type = input.bool)

// === FUNCTION EXAMPLE ===
start     = timestamp(fromYear, fromMonth, fromDay, 00, 00)        // backtest start window
finish    = timestamp(thruYear, thruMonth, thruDay, 23, 59)        // backtest finish window
window()  => true       // create function "within window of time"

bgcolor(color = showDate and window() ? color.gray : na, transp = 90) 


// 3. Display Chart Information*************************************************************************************************************************************************************************

//plot EMAs
plot(SH_EMA, title = "SH EMA", color = color.blue)
plot(MD_EMA, title = "MD EMA", color = color.yellow)

//plot SMAs
plot(SH_SMA, title = "SH SMA", color = color.green)
plot(MD_SMA, title = "MD SMA", color = color.orange)
plot(LG_SMA, title = "LG SMA", color = color.red, linewidth = 4, transp = 70)


// 4. Determine Entry Conditions*************************************************************************************************************************************************************************

//Determine if SNAP Back (SB) setup is present: 
SB_RB_Up= false //SB_RB_Up = Snap Back RainBow for an Uptrend Swing
SB_RB_Up:= iff(LG_SMA>MD_SMA and MD_SMA>MD_EMA and MD_EMA>SH_SMA and SH_SMA>SH_EMA, true, false) //is the 200SMA > 50 SMA > 34EMA > 20SMA > 8EMA 
// plotshape(SB_RB, title= "SB_RB", color=color.black, style=shape.cross, text="Rainbow")   //for testing only
SB_RB_DWN= false //SB_RB_DWN = Snap Back RainBow for a Downtrend Swing
SB_RB_DWN:= iff(LG_SMA<MD_SMA and MD_SMA<MD_EMA and MD_EMA<SH_SMA and SH_SMA<SH_EMA, true, false) //is the 200SMA < 50 SMA < 34EMA < 20SMA < 8EMA 


SB_Gap=false
SB_Gap:= iff(abs(SH_SMA-SH_EMA)>(price*GAP), true, false) //is there a greater than "GAP"% of the price gap between the 8EMA and 20SMA

SB_SetUp_Up=false
SB_SetUp_Up:= iff(SB_RB_Up and SB_Gap, true, false)//Uptrend Setup both conditions must be true
//plotshape(SB_SetUp, title= "SB_SetUp", color=color.white, style=shape.diamond, text="Set Up")  //for testing
SB_SetUp_DWN=false
SB_SetUp_DWN:= iff(SB_RB_DWN and SB_Gap, true, false)//Downtrend Setup both conditions must be true

//Determine trigger (TGR) for entry
SB_TGR_Up=false
SB_TGR_Up:= iff(iff(aggro==0, crossover(price, SH_EMA), true) and iff(aggro==1, crossover(price[aggro],SH_EMA) and price>open[aggro], true), true, false) //if the price crosses over the 8EMA that is our entry signal, aggro determines how aggressively we enter the position (wait for a confirmaiton bar or not)
SB_TGR_DWN=false
SB_TGR_DWN:= iff(iff(aggro==0, crossunder(price, SH_EMA), true) and iff(aggro==1, crossunder(price[aggro],SH_EMA) and price<open[aggro], true), true, false) //if the price crosses under the 8EMA that is our entry signal, aggro determines how aggressively we enter the position (wait for a confirmaiton bar or not)

//Determine when to run the strategy based on user input for uptrend or downtrend
RunTrendUp=false //Varibile for running the Strategy in an UpTrend
RunTrendUp:= iff(RunTrend == "Up" or RunTrend == "Both", true, false)

RunTrendDWN=false //Varibile for running the Strategy in a DownTrend
RunTrendDWN:= iff(RunTrend == "Down" or RunTrend == "Both", true, false)

//Determine full buy conditions
MAbuy=false//long entry variable
MAbuy := iff(SB_SetUp_Up and SB_TGR_Up and RunTrendUp, true, false) //when both the setup, the trigger, and RunTrend are true return true
plotshape(MAbuy, title= "HC-LB", color=color.lime, style=shape.circle, text="HC-LB")
strategy.entry("HC-Long", strategy.long, comment="HC-Long", when = MAbuy and window())

MAsell=false//short entry variable
MAsell := iff(SB_SetUp_DWN and SB_TGR_DWN and RunTrendDWN, true, false) //when both the setup, the trigger, and RunTrend are true return true
plotshape(MAsell, title= "HC-SB", color=color.purple, style=shape.circle, text="HC-SB")
strategy.entry("HC-Short", strategy.short, comment="HC-Short", when = MAsell and window())


// 5. Submit Profit and Loss Exit Calculations Orders*************************************************************************************************************************************************************************

//Stop Criteria
StpCri=input(title="Stop Criteria: SL or SH_EMA", defval="SL", options=["SL", "SH_EMA"])
//Profit Criteria
ProCri=input(title="Profit Criteria: TGT% or MD_EMA", defval="TGT%", options=["TGT%", "MD_EMA"])

// User Options to Change Inputs (%)
TrailPerc = input(title="Trail Loss %", type=input.float, minval=0, step=1, defval=6) /100
stopPer = input(4, title='Stop Loss %', type=input.float) / 100
takePer = input(6, title='Take Profit %', type=input.float) / 100

//Percent of SH_EMA to use for StopLoss
SH_EMA_percent = input(96, title="% of SH_EMA for Stop")/100
//Percent of MD_EMA to use for Take Profit
MD_EMA_percent = input(100, title="% of MD_EMA for Profit")/100

//calculate Trail stop price for MD_EMA TGT% condition
longStopPrice=0.0//long side entry stop variable
longStopPrice := if (strategy.position_size > 0)
    stopValue = close * (1 - TrailPerc)  
    max(stopValue, longStopPrice[1])
else
    0
    
shortStopPrice=0.0//short side entry stop variable
shortStopPrice := if (strategy.position_size < 0)
    shortStopValue = close * (1 + TrailPerc)  
    min(shortStopValue, shortStopPrice[1])
else
    999999 
    

// Determine where you've entered and in what direction
longStop = strategy.position_avg_price * (1 - stopPer)
shortStop = strategy.position_avg_price * (1 + stopPer)
shortTake = strategy.position_avg_price * (1 - takePer)
longTake = strategy.position_avg_price * (1 + takePer)


//exit position conditions and orders
if strategy.position_size > 0 //long side exit conditions
    if StpCri=="SL" and ProCri=="TGT%"
        strategy.exit(id="Close Long", when = window(), stop=longStop, limit=longTake)// sell when either the TGT or the SL is hit
    if StpCri=="SL" and ProCri=="MD_EMA"
        strategy.exit(id="Close Long (50%)", when = window(), stop=longStop, limit=MD_EMA_percent*MD_EMA, qty_percent=50)// sell 50% when MD_EMA hit or SL then transition to a trailing stop loss
        strategy.exit(id="Close Long Trailing Stop", when = window(), stop=longStopPrice, qty_percent=100)
    if StpCri=="SH_EMA" and ProCri=="MD_EMA"
        strategy.exit(id="Close Long (50%)", when = window(), stop=SH_EMA*SH_EMA_percent, limit=MD_EMA_percent*MD_EMA, qty_percent=50)// sell 50% when MD_EMA hit or SH_EMA hit then transition to a trailing stop loss
        strategy.exit(id="Close Long Trailing Stop", when = window(), stop=longStopPrice, qty_percent=100)
    if StpCri=="SH_EMA" and ProCri=="TGT%"
        strategy.exit(id="Close Long", when = window(), stop=SH_EMA*SH_EMA_percent, limit=longTake)// sell when either the TGT or the SH_EMA is hit
        
        
if strategy.position_size < 0 //short side exit conditions
    if StpCri=="SL" and ProCri=="TGT%"
        strategy.exit(id="Close Short", when = window(), stop=shortStop, limit=shortTake)// sell when either the TGT or the SL is hit
    if StpCri=="SL" and ProCri=="MD_EMA"
        strategy.exit(id="Close Short (50%)", when = window(), stop=shortStop, limit=(2-MD_EMA_percent)*MD_EMA, qty_percent=50)// sell 50% when MD_EMA hit or SL then transition to a trailing stop loss
        strategy.exit(id="Close Short Trailing Stop", when = window(), stop=shortStopPrice, qty_percent=100)
    if StpCri=="SH_EMA" and ProCri=="MD_EMA"
        strategy.exit(id="Close Short (50%)", when = window(), stop=SH_EMA*(2-SH_EMA_percent), limit=(2-MD_EMA_percent)*MD_EMA, qty_percent=50)// sell 50% when MD_EMA hit or SH_EMA hit then transition to a trailing stop loss
        strategy.exit(id="Close Short Trailing Stop", when = window(), stop=shortStopPrice, qty_percent=100)
    if StpCri=="SH_EMA" and ProCri=="TGT%"
        strategy.exit(id="Close Short", when = window(), stop=SH_EMA*(2-SH_EMA_percent), limit=shortTake)// sell when either the TGT or the SH_EMA is hit


// Plot stop trailing loss values for confirmation
plot(series=(strategy.position_size > 0 and (ProCri == "MD_EMA")) ? longStopPrice : na, color=color.fuchsia, style=plot.style_cross, linewidth=2, title="Long Trail Stop") //plot the trailing stop on the chart for an uptrend
plot(series=(strategy.position_size < 0 and (ProCri == "MD_EMA")) ? shortStopPrice : na, color=color.fuchsia, style=plot.style_cross, linewidth=2, title="Short Trail Stop") //plot the trailing stop on the chart for a downtrend

//plot fixed stop loss value
plot(series=(strategy.position_size > 0 and (StpCri == "SL")) ? longStop : na, color=color.fuchsia, style=plot.style_cross, linewidth=2, title="Long Trail Stop") //plot the stop on the chart for an uptrend
plot(series=(strategy.position_size < 0 and (StpCri == "SL")) ? shortStop : na, color=color.fuchsia, style=plot.style_cross, linewidth=2, title="Short Trail Stop") //plot the stop on the chart for a downtrend

//plot highlight of SH_EMA% used for stop exit condition
plot(series=(strategy.position_size > 0 and (StpCri == "SH_EMA")) ? SH_EMA*SH_EMA_percent : na, color=color.fuchsia, style=plot.style_cross, linewidth=2, title="Short Trail Stop") //plot the SH_EMA based stop on the chart for a uptrend
plot(series=(strategy.position_size < 0 and (StpCri == "SH_EMA")) ? SH_EMA*(2-SH_EMA_percent) : na, color=color.fuchsia, style=plot.style_cross, linewidth=2, title="Short Trail Stop") //plot the SH_EMA based stop on the chart for a downtrend

//plot the TGT profit points
plot(series=(strategy.position_size > 0 and (ProCri == "TGT%")) ? longTake : na, color=color.lime, style=plot.style_cross, linewidth=2, title="Short Trail Stop") //plot the TGT% for long position
plot(series=(strategy.position_size > 0 and (ProCri == "MD_EMA")) ? MD_EMA_percent*MD_EMA : na, color=color.lime, style=plot.style_cross, linewidth=2, title="Short Trail Stop") //plot the MD_EMA % TGT for long position
plot(series=(strategy.position_size < 0 and (ProCri == "TGT%")) ? shortTake : na, color=color.lime, style=plot.style_cross, linewidth=2, title="Short Trail Stop") //plot the TGT% for short position
plot(series=(strategy.position_size < 0 and (ProCri == "MD_EMA")) ? (2-MD_EMA_percent)*MD_EMA : na, color=color.lime, style=plot.style_cross, linewidth=2, title="Short Trail Stop") //plot the MD_EMA % TGT for short position