トリプルモードスイングトレード戦略


作成日: 2023-10-23 17:36:55 最終変更日: 2023-10-23 17:36:55
コピー: 0 クリック数: 711
1
フォロー
1617
フォロワー

トリプルモードスイングトレード戦略

概要

三重モードの振動トレード戦略は,複数の技術指標の組み合わせに基づいたショートライントレード戦略である.この戦略は,超トレンド指標,SSL混合平均線,改善QQE指標を組み合わせて,安定した取引信号を形成する.これは,特に突破期以降に良好なパフォーマンスを発揮するデジタル通貨や株式などの高波動性の取引品種に適用されます.

原則

入口信号

ラングランは,

  • スーパートレンドは空から転がる
  • SSL混合ベースラインを閉店価格で走行
  • QQE改良版は青 ((多頭)

空き倉庫の入場:

  • 超トレンドは多転空
  • SSL混合ベースライン下線を閉店価格で突破する
  • QQE改良版は赤で空頭)

出発信号

超トレンドは多転空

空売り:超トレンドが空売りに逆転

ストップダスト

パーセンテージストップ,ATRストップ,または近期最高最低価格ストップを選択できます.

ストップ

設定可能なストップ回報比率で,ストップ価格を自動的に計算します.

資金管理

資金管理ロジックを使用するかどうかを選択し,ポジションサイズを制御します.

地図

  • 超トレンドラインの描画,SSL混合均等線通路
  • EMA均線を描画するかどうかを選択できます.
  • 多空頭開場,止損,止線を描画する
  • 複数の空頭開設のラベルを描く

利点

  1. 複数の指標の組み合わせにより,安定した取引シグナルが形成されます.

超トレンド,SSL混合平均線,QQE改良版指標を組み合わせて,異なる指標が相互検証し,偽突破をフィルタリングし,高品質の取引信号を形成する.

  1. 波動性のある品種に適した振動取引

戦略は,ショートライン取引方法を採用し,ショートラインの価格変動を捕捉することに焦点を当てている.スーパートレンドは価格トレンドを効果的に追跡し,SSL混合平均線は,サポートのプレッシャーレベルを明確に識別し,両者は,揺れ動いている状況で利益を得ることができる.

  1. 複数の止損方式が選択できる

止損はパーセント,ATR値または近期極限値を選択できます. 止損はリターン比率を設定できます. 資金管理はポジションを制御できます. ユーザーは品種特性とリスク好みに応じて自由に組み合わせることができます.

  1. 明確な地図

戦略図は明瞭で直観的にストロップ・ストップ・ラインを表示する.開設ラインのマークは取引信号を容易に識別する.

リスクと最適化

  1. 小さい損失が発生する可能性があります.

ショートライン取引により,通常の小規模な小規模な損失を完全に回避することは不可能である. 適切な緩解で,資金管理の論理を最適化することができる.

  1. 偽の突破の危険性

価格が偽ブレイクしたときに,誤ったシグナルが形成される可能性がある.偽ブレイクをフィルターするために,異なる周期のEMAをテストしたり,トレンド識別指標パラメータを最適化したりできます.

  1. 監視指標の失敗のリスク

基礎指標が機能しなくなった場合,複数の誤り信号が発生する.指標の有効性を定期的に検証し,問題を発見し,早期に調整する.

  1. 回測サイクルを最適化

現時点の回測周期は固定時間帯で,品種異なる市場周期に対応することはできません.契約主取引時間帯に対応するように最適化することを推奨します.

  1. 品種の適応性を最適化する

異なる品種のデータ特性に合わせて戦略パラメータを微調整し,長期短期ポジションの勝率を向上させる. ステップアップ最適化方法を使用して,異なるパラメータの戦略への影響を比較することを推奨する.

要約する

この戦略は,複数の指標を組み合わせて取引信号を形成し,偽の突破を効果的にフィルターし,波動性の高いデジタル通貨と個別の株式に適しています.同時に,複数のストップ・ストップの選択肢を用意し,使用の柔軟性があります.全体的に,この戦略は,中短線の振動状況で安定した取引信号を形成し,より良い収益を得ることができます.さらなる最適化により,異なる取引品の最適化パラメータを高め,戦略のprofit factorを向上させることができます.この戦略は,深く研究に値する高効率の取引システムです.
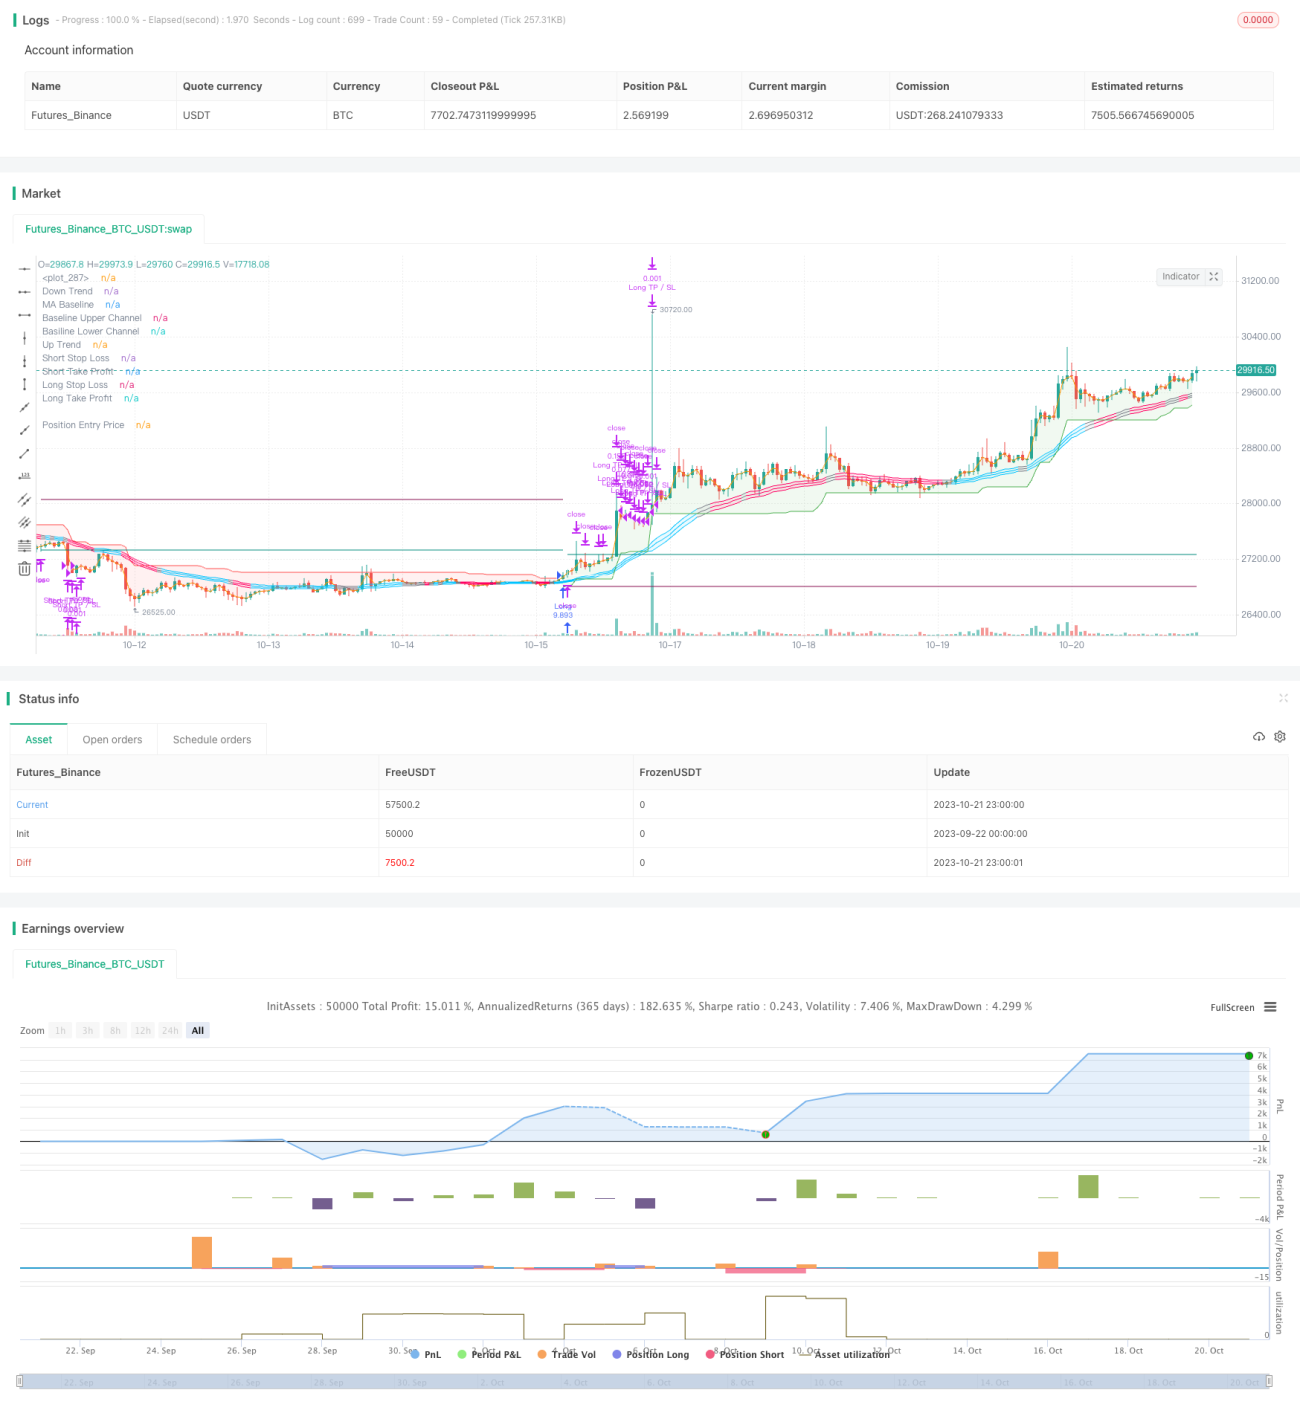
ストラテジーソースコード
/*backtest
start: 2023-09-22 00:00:00
end: 2023-10-22 00:00:00
period: 1h
basePeriod: 15m
exchanges: [{"eid":"Futures_Binance","currency":"BTC_USDT"}]
*/

// This source code is subject to the terms of the Mozilla Public License 2.0 at https://mozilla.org/MPL/2.0/
// © fpemehd
// Thanks to myncrypto, jason5480, kevinmck100
// @version=5
strategy(title          = '[D] SuperTrend + SSL Hybrid + QQE MOD',
      shorttitle        = '[D] SSQ Strategy',
      overlay           = true,
      pyramiding        = 0,
      currency          = currency.USD,
      default_qty_type  = strategy.percent_of_equity,
      default_qty_value = 100,
      commission_value  = 0.1,
      initial_capital   = 100000,
      max_bars_back     = 500,
      max_lines_count   = 150,
      max_labels_count  = 300)

// ░░░░░░░░░░░░░░░░░░░░░░░░░░░░░░░░░░░░░░░░░░░░░░░░░░░░░░░░░░░░░░░░░░░░░░░░░░░░░░░░░░░░░░░░░░░░░░░░░░░░░░░░░░░░░░░░░░░░░░░░░░░░░░░░░░░░░░░░░░░░░░░░░░
//                      Time, Direction, Etc - Basic Settings Inputs
// ░░░░░░░░░░░░░░░░░░░░░░░░░░░░░░░░░░░░░░░░░░░░░░░░░░░░░░░░░░░░░░░░░░░░░░░░░░░░░░░░░░░░░░░░░░░░░░░░░░░░░░░░░░░░░░░░░░░░░░░░░░░░░░░░░░░░░░░░░░░░░░░░░░
// 1. Time: Based on UTC +09:00
i_start                 = input (defval = timestamp("20 Jan 1990 00:00 +0900"), title = "Start Date", tooltip = "Choose Backtest Start Date", inline = "Start Date", group = "Time" ) 
i_end                   = input (defval = timestamp("20 Dec 2030 00:00 +0900"), title = "End Date", tooltip = "Choose Backtest End Date", inline = "End Date", group = "Time" ) 
inTime                  = true

// 2. Inputs for direction: Long? Short? Both? 
i_longEnabled           = input.bool (defval = true , title = "Long?", tooltip = "Enable Long Position Trade?", inline = "Long / Short", group = "Long / Short" )
i_shortEnabled          = input.bool (defval = true , title = "Short?", tooltip = "Enable Short Position Trade?", inline = "Long / Short", group = "Long / Short" )

// ░░░░░░░░░░░░░░░░░░░░░░░░░░░░░░░░░░░░░░░░░░░░░░░░░░░░░░░░░░░░░░░░░░░░░░░░░░░░░░░░░░░░░░░░░░░░░░░░░░░░░░░░░░░░░░░░░░░░░░░░░░░░░░░░░░░░░░░░░░░░░░░░░░
//                      Filter - Inputs, Indicaotrs
// ░░░░░░░░░░░░░░░░░░░░░░░░░░░░░░░░░░░░░░░░░░░░░░░░░░░░░░░░░░░░░░░░░░░░░░░░░░░░░░░░░░░░░░░░░░░░░░░░░░░░░░░░░░░░░░░░░░░░░░░░░░░░░░░░░░░░░░░░░░░░░░░░░░
// 3. Use Filters? What Filters?
//// 3-1. ATR Filter
i_ATRFilterOn           = input.bool (defval = false , title = "ATR Filter On?", tooltip = "ATR Filter On? Order will not be made unless filter condition is fulfilled", inline = "1", group =  "Filters") 
i_ATRFilterLen          = input.int  (defval = 14,     title = "Length for ATR Filter", minval = 1 , maxval = 100 , step = 1 , tooltip = "", inline = "2", group = "Filters") 
i_ATRSMALen             = input.int  (defval = 40,     title = "SMA Length for ATR SMA", minval = 1 , maxval = 100000 , step = 1 , tooltip = "ATR should be bigger than this", inline = "2", group = "Filters") 
bool ATRFilter          = ta.atr(i_ATRFilterLen) >= ta.sma(ta.atr(length = i_ATRFilterLen), i_ATRSMALen) ? true : false

//// 3-2. EMA Filter
i_EMAFilterOn           = input.bool (defval = false , title = "EMA Filter On?", tooltip = "EMA Filter On? Order will not be made unless filter condition is fulfilled", inline = "3", group =  "Filters") 
i_EMALen                = input.int  (defval = 200,    title = "EMA Length", minval = 1 , maxval = 100000 , step = 1 , tooltip = "EMA Length", inline = "4", group = "Filters") 
bool longEMAFilter      = close >= ta.ema(source = close, length = i_EMALen) ? true : false
bool shortEMAFilter     = close <= ta.ema(source = close, length = i_EMALen) ? true : false
plot(i_EMAFilterOn ? ta.ema(source = close, length = i_EMALen) : na, title = "EMA Filter", color = color.new(color = color.orange , transp = 0), linewidth = 1)

//// 3-3. ADX Filter
////3-4. DMI Filter (Uses same ADX Length)
i_ADXFilterOn           = input.bool (defval = false , title = "ADX Filter On?", tooltip = "ADX Filter On? Order will not be made unless filter condition is fulfilled", inline = "5", group =  "Filters") 
i_DMIFilterOn           = input.bool (defval = false , title = "DMI Filter On?", tooltip = "DMI (Directional Moving Index) Filter On? Order will not be made unless filter condition is fulfilled", inline = "6", group =  "Filters") 
i_ADXLength             = input.int  (defval = 20,     title = "ADX Length", minval = 1 , maxval = 100000 , step = 1 , tooltip = "ADX Length", inline = "7", group = "Filters") 
i_ADXThreshold          = input.int  (defval = 25,     title = "ADX Threshold", minval = 1 , maxval = 100000 , step = 1 , tooltip = "ADX should be bigger than threshold", inline = "8", group = "Filters") 

//// 3-4. SuperTrend Filter
// i_superTrendFilterOn    = input.bool (defval = false , title = "Super Trend Filter On?", tooltip = "Super Trend Filter On? Order will not be made unless filter condition is fulfilled", inline = "9", group =  "Filters") 
// i_superTrendATRLen      = input.int  (defval = 10,     title = "ATR Length", minval = 1 , maxval = 100000 , step = 1 , tooltip = "Super Trend ATR Length", inline = "10", group = "Filters") 
// i_superTrendATRFactor   = input.float (defval = 3,     title = "Factor", minval = 1 , maxval = 100000 , step = 0.1 , tooltip = "Super Trend ATR Factor", inline = "11", group = "Filters") 

// ADX and DI Thanks to @BeikabuOyaji
int len                 = i_ADXLength
float th                = i_ADXThreshold

TR                      = math.max(math.max(high - low, math.abs(high - nz(close[1]))), math.abs(low - nz(close[1])))
DMPlus                  = high - nz(high[1]) > nz(low[1]) - low ? math.max(high - nz(high[1]), 0) : 0
DMMinus                 = nz(low[1]) - low > high - nz(high[1]) ? math.max(nz(low[1]) - low, 0) : 0

SmoothedTR              = 0.0
SmoothedTR              := nz(SmoothedTR[1]) - nz(SmoothedTR[1]) / len + TR

SmoothedDMPlus          = 0.0
SmoothedDMPlus          := nz(SmoothedDMPlus[1]) - nz(SmoothedDMPlus[1]) / len + DMPlus

SmoothedDMMinus         = 0.0
SmoothedDMMinus         := nz(SmoothedDMMinus[1]) - nz(SmoothedDMMinus[1]) / len + DMMinus

DIPlus                  = SmoothedDMPlus / SmoothedTR * 100
DIMinus                 = SmoothedDMMinus / SmoothedTR * 100
DX                      = math.abs(DIPlus - DIMinus) / (DIPlus + DIMinus) * 100
ADX                     = ta.sma(source = DX, length = len)

// plot(DIPlus, color=color.new(color.green, 0), title='DI+')
// plot(DIMinus, color=color.new(color.red, 0), title='DI-')
// plot(ADX, color=color.new(color.navy, 0), title='ADX')
// hline(th, color=color.white)

bool ADXFilter          = ADX > th ? true : false
bool longDMIFilter      = DIPlus >= DIMinus ? true : false
bool shortDMIFilter     = DIPlus <= DIMinus ? true : false

// Calculate Super Trend for Filter
// i_superTrendFilterOn    = input.bool (defval = false , title = "Super Trend Filter On?", tooltip = "Super Trend Filter On? Order will not be made unless filter condition is fulfilled", inline = "9", group =  "Filters") 
// i_superTrendATRLen      = input.int  (defval = 10,     title = "ATR Length", minval = 1 , maxval = 100000 , step = 1 , tooltip = "Super Trend ATR Length", inline = "10", group = "Filters") 
// i_superTrendATRFactor   = input.float (defval = 3,     title = "Factor", minval = 1 , maxval = 100000 , step = 0.1 , tooltip = "Super Trend ATR Factor", inline = "11", group = "Filters") 
// [supertrend, direction] = ta.supertrend(factor = i_superTrendATRFactor, atrPeriod = i_superTrendATRLen) 
// bodyMiddle              = plot((open + close) / 2, display=display.none)
// upTrend                 = plot(i_superTrendFilterOn ? direction < 0 ? supertrend : na : na, "Up Trend", color = color.green, style=plot.style_linebr)
// downTrend               = plot(i_superTrendFilterOn ? direction < 0 ? na : supertrend : na, "Down Trend", color = color.red, style=plot.style_linebr)
// fill(bodyMiddle, upTrend, color.new(color.green, 90), fillgaps=false)
// fill(bodyMiddle, downTrend, color.new(color.red, 90), fillgaps=false)
// bool longSTFilter       = direction <= 0
// bool shortSTFilter      = direction >= 0

// Filter 
bool longFilterFilled   = (not i_ATRFilterOn or ATRFilter) and (not i_EMAFilterOn or longEMAFilter) and (not i_ADXFilterOn or ADXFilter) and (not i_DMIFilterOn or longDMIFilter) // and (not i_superTrendFilterOn or longSTFilter)
bool shortFilterFilled  = (not i_ATRFilterOn or ATRFilter) and (not i_EMAFilterOn or shortEMAFilter) and (not i_ADXFilterOn or ADXFilter) and (not i_DMIFilterOn or shortDMIFilter) // and (not i_superTrendFilterOn or shortSTFilter)

// ░░░░░░░░░░░░░░░░░░░░░░░░░░░░░░░░░░░░░░░░░░░░░░░░░░░░░░░░░░░░░░░░░░░░░░░░░░░░░░░░░░░░░░░░░░░░░░░░░░░░░░░░░░░░░░░░░░░░░░░░░░░░░░░░░░░░░░░░░░░░░░░░░░
//                      Strategy Logic (Entry & Exit Condition) - Inputs, Indicators for Strategy
// ░░░░░░░░░░░░░░░░░░░░░░░░░░░░░░░░░░░░░░░░░░░░░░░░░░░░░░░░░░░░░░░░░░░░░░░░░░░░░░░░░░░░░░░░░░░░░░░░░░░░░░░░░░░░░░░░░░░░░░░░░░░░░░░░░░░░░░░░░░░░░░░░░░
//// Indicators
// Inputs for Strategy Indicators
//// 1. Super Trend
i_superTrendATRLen      = input.int  (defval = 10,     title = "ATR Length", minval = 1 , maxval = 100000 , step = 1 , tooltip = "Super Trend ATR Length", inline = "1", group = "1: SuperTrend") 
i_superTrendATRFactor   = input.float (defval = 3,     title = "Factor", minval = 1 , maxval = 100000 , step = 0.1 , tooltip = "Super Trend ATR Factor", inline = "2", group = "1: SuperTrend") 
[supertrend, direction] = ta.supertrend(factor = i_superTrendATRFactor, atrPeriod = i_superTrendATRLen) 

//// 2. SSL Hybrid Baseline
i_useTrueRange          = input.bool   (defval = true, title = "use true range for Keltner Channel?", tooltip = "", inline = "1", group = "2: SSL Hybrid") 
i_maType                = input.string (defval ='EMA', title='Baseline Type', options=['SMA', 'EMA', 'DEMA', 'TEMA', 'LSMA', 'WMA', 'VAMA', 'TMA', 'HMA', 'McGinley'], inline="2", group = "2: SSL Hybrid")
i_len                   = input.int    (defval =30,    title='Baseline Length', inline="2", group = "2: SSL Hybrid")
i_multy                 = input.float  (defval = 0.2,  title='Base Channel Multiplier', minval = 0, maxval = 100,  step=0.05, inline="3", group = "2: SSL Hybrid")
i_volatility_lookback   = input.int    (defval =10,    title='Volatility lookback length(for VAMA)', inline='4',group="2: SSL Hybrid")

tema(src, len) =>
    ema1 = ta.ema(src, len)
    ema2 = ta.ema(ema1, len)
    ema3 = ta.ema(ema2, len)
    3 * ema1 - 3 * ema2 + ema3

f_ma(type, src, len) =>
    float result = 0
    if type == 'TMA'
        result := ta.sma(ta.sma(src, math.ceil(len / 2)), math.floor(len / 2) + 1)
        result
    if type == 'LSMA'
        result := ta.linreg(src, len, 0)
        result
    if type == 'SMA'  // Simple
        result := ta.sma(src, len)
        result
    if type == 'EMA'  // Exponential
        result := ta.ema(src, len)
        result
    if type == 'DEMA'  // Double Exponential
        e = ta.ema(src, len)
        result := 2 * e - ta.ema(e, len)
        result
    if type == 'TEMA'  // Triple Exponential
        e = ta.ema(src, len)
        result := 3 * (e - ta.ema(e, len)) + ta.ema(ta.ema(e, len), len)
        result
    if type == 'WMA'  // Weighted
        result := ta.wma(src, len)
        result
    if type == 'VAMA'  // Volatility Adjusted
        /// Copyright © 2019 to present, Joris Duyck (JD)
        mid = ta.ema(src, len)
        dev = src - mid
        vol_up = ta.highest(dev, i_volatility_lookback)
        vol_down = ta.lowest(dev, i_volatility_lookback)
        result := mid + math.avg(vol_up, vol_down)
        result
    if type == 'HMA'  // Hull
        result := ta.wma(2 * ta.wma(src, len / 2) - ta.wma(src, len), math.round(math.sqrt(len)))
        result
    if type == 'McGinley'
        mg = 0.0
        mg := na(mg[1]) ? ta.ema(src, len) : mg[1] + (src - mg[1]) / (len * math.pow(src / mg[1], 4))
        result := mg
        result
    result

//// 2-1. SSL Hybrid Keltner Baseline Channel 
BBMC                    = f_ma (i_maType, close, i_len) // BaseLone
Keltma                  = f_ma (i_maType, close, i_len)
range_1                 = i_useTrueRange ? ta.tr : high - low
rangema                 = ta.ema(range_1, i_len)
upperk                  = Keltma + rangema * i_multy
lowerk                  = Keltma - rangema * i_multy

//// 3. QQE MOD, thanks to Mihkel100
RSI_Period              = input.int   (defval = 6,     title = 'RSI Length',      inline = "1",       group = "3: QQE MOD")
SF                      = input.int   (defval = 5,     title = 'RSI Smoothing',   inline = "2",       group = "3: QQE MOD")
QQE                     = input.float (defval = 3,     title = 'Fast QQE Factor', inline = "3",       group = "3: QQE MOD")
ThreshHold              = input.int   (defval = 3,     title = 'Thresh-hold',     inline = "4",       group = "3: QQE MOD")
src                     = input       (defval = close, title='RSI Source')

Wilders_Period          = RSI_Period * 2 - 1


Rsi                     = ta.rsi(src, RSI_Period)
RsiMa                   = ta.ema(Rsi, SF)
AtrRsi                  = math.abs(RsiMa[1] - RsiMa)
MaAtrRsi                = ta.ema(AtrRsi, Wilders_Period)
dar                     = ta.ema(MaAtrRsi, Wilders_Period) * QQE

longband                = 0.0
shortband               = 0.0
trend                   = 0

DeltaFastAtrRsi         = dar
RSIndex                 = RsiMa
newshortband            = RSIndex + DeltaFastAtrRsi
newlongband             = RSIndex - DeltaFastAtrRsi
longband                := RSIndex[1] > longband[1] and RSIndex > longband[1] ? math.max(longband[1], newlongband) : newlongband
shortband               := RSIndex[1] < shortband[1] and RSIndex < shortband[1] ? math.min(shortband[1], newshortband) : newshortband
cross_1                 = ta.cross(longband[1], RSIndex)
trend                   := ta.cross(RSIndex, shortband[1]) ? 1 : cross_1 ? -1 : nz(trend[1], 1)
FastAtrRsiTL            = trend == 1 ? longband : shortband
////////////////////

length                  = input.int     (defval = 50,   minval = 1,                            title = 'Bollinger Length', group = "3: QQE MOD")
mult                    = input.float   (defval = 0.35, minval = 0.01, maxval = 5, step = 0.1, title = 'BB Multiplier', group = "3: QQE MOD")

basis                   = ta.sma(FastAtrRsiTL - 50, length)
dev                     = mult * ta.stdev(FastAtrRsiTL - 50, length)
upper                   = basis + dev
lower                   = basis - dev
color_bar               = RsiMa - 50 > upper ? #00c3ff : RsiMa - 50 < lower ? #ff0062 : color.gray


//
// Zero cross
QQEzlong                = 0
QQEzlong                := nz(QQEzlong[1])
QQEzshort               = 0
QQEzshort               := nz(QQEzshort[1])
QQEzlong                := RSIndex >= 50 ? QQEzlong + 1 : 0
QQEzshort               := RSIndex < 50 ? QQEzshort + 1 : 0
//  

// Zero                    = hline(0, color=color.white, linestyle=hline.style_dotted, linewidth=1)

////////////////////////////////////////////////////////////////
RSI_Period2             = input.int   (defval = 6,     title = 'RSI 2  Length', group = "3: QQE MOD")
SF2                     = input.int   (defval = 5,     title = 'RSI Smoothing', group = "3: QQE MOD")
QQE2                    = input.float (defval = 1.61,  title = 'Fast QQE2 Factor', group = "3: QQE MOD")
ThreshHold2             = input.int   (defval = 3,     title = 'Thresh-hold', group = "3: QQE MOD")
src2                    = input       (defval = close, title = 'RSI Source', group = "3: QQE MOD")
//

//
Wilders_Period2 = RSI_Period2 * 2 - 1


Rsi2                    = ta.rsi(src2, RSI_Period2)
RsiMa2                  = ta.ema(Rsi2, SF2)
AtrRsi2                 = math.abs(RsiMa2[1] - RsiMa2)
MaAtrRsi2               = ta.ema(AtrRsi2, Wilders_Period2)
dar2                    = ta.ema(MaAtrRsi2, Wilders_Period2) * QQE2
longband2               = 0.0
shortband2              = 0.0
trend2                  = 0

DeltaFastAtrRsi2        = dar2
RSIndex2                = RsiMa2
newshortband2           = RSIndex2 + DeltaFastAtrRsi2
newlongband2            = RSIndex2 - DeltaFastAtrRsi2
longband2               := RSIndex2[1] > longband2[1] and RSIndex2 > longband2[1] ? math.max(longband2[1], newlongband2) : newlongband2
shortband2              := RSIndex2[1] < shortband2[1] and RSIndex2 < shortband2[1] ? math.min(shortband2[1], newshortband2) : newshortband2
cross_2                 = ta.cross(longband2[1], RSIndex2)
trend2                  := ta.cross(RSIndex2, shortband2[1]) ? 1 : cross_2 ? -1 : nz(trend2[1], 1)
FastAtrRsi2TL           = trend2 == 1 ? longband2 : shortband2


//
// Zero cross
QQE2zlong               = 0
QQE2zlong               := nz(QQE2zlong[1])
QQE2zshort              = 0
QQE2zshort              := nz(QQE2zshort[1])
QQE2zlong               := RSIndex2 >= 50 ? QQE2zlong + 1 : 0
QQE2zshort              := RSIndex2 < 50 ? QQE2zshort + 1 : 0
//  

hcolor2                 = RsiMa2 - 50 > ThreshHold2 ? color.silver : RsiMa2 - 50 < 0 - ThreshHold2 ? color.silver : na

Greenbar1               = RsiMa2 - 50 > ThreshHold2
Greenbar2               = RsiMa - 50 > upper

Redbar1                 = RsiMa2 - 50 < 0 - ThreshHold2
Redbar2                 = RsiMa - 50 < lower


// Plot: Indicators
//// 1. Super Trend
bodyMiddle              = plot((open + close) / 2, display=display.none)
upTrend                 = plot(direction < 0 ? supertrend : na, "Up Trend", color = color.green, style=plot.style_linebr)
downTrend               = plot(direction < 0 ? na : supertrend, "Down Trend", color = color.red, style=plot.style_linebr)
fill(bodyMiddle, upTrend, color.new(color.green, 90), fillgaps=false)
fill(bodyMiddle, downTrend, color.new(color.red, 90), fillgaps=false)

//// 2. SSL Hybrid
var bullSSLColor        = #00c3ff
var bearSSLColor        = #ff0062
// color_bar               = color.new(color = close > upperk ? bullSSLColor : close < lowerk ? bearSSLColor : color.gray, transp = 0)
// i_show_color_bar        = input.bool(defval = true , title = "Color Bars") 
// barcolor(i_show_color_bar ? color_bar : na)
plot(series = BBMC, title = 'MA Baseline', color = color_bar, linewidth = 1, style = plot.style_line)
up_channel              = plot(upperk, color=color_bar, title='Baseline Upper Channel')
low_channel             = plot(lowerk, color=color_bar, title='Basiline Lower Channel')
fill(up_channel, low_channel, color.new(color=color_bar, transp=90))

//// 3. QQE MOD: No Plotting because of overlay option
// plot(FastAtrRsi2TL - 50, title='QQE Line', color=color.new(color.white, 0), linewidth=2)
// plot(RsiMa2 - 50, color=hcolor2, title='Histo2', style=plot.style_columns, transp=50)
// plot(Greenbar1 and Greenbar2 == 1 ? RsiMa2 - 50 : na, title='QQE Up', style=plot.style_columns, color=color.new(#00c3ff, 0))
// plot(Redbar1 and Redbar2 == 1 ? RsiMa2 - 50 : na, title='QQE Down', style=plot.style_columns, color=color.new(#ff0062, 0))


////// Entry, Exit
// Long, Short Logic with Indicator
bool longSTCond         = direction[1] >= 0 and direction <= 0
bool shortSTCond        = direction[1] <= 0 and direction >= 0

bool longSSLCond        = close > upperk
bool shortSSLCond       = close < lowerk

bool longQQECond        = Greenbar1 and Greenbar2 == 1
bool shortQQECond       = Redbar1 and Redbar2 == 1

// Basic Cond + Long, Short Entry Condition
bool longCond           = (i_longEnabled and inTime) and (longSTCond and longSSLCond and longQQECond) 
bool shortCond          = (i_shortEnabled and inTime) and (shortSTCond and shortSSLCond and shortQQECond) 

// Basic Cond + Long, Short Exit Condition
bool closeLong          = (i_longEnabled) and (shortSTCond)
bool closeShort         = (i_shortEnabled) and (longSTCond)

// ░░░░░░░░░░░░░░░░░░░░░░░░░░░░░░░░░░░░░░░░░░░░░░░░░░░░░░░░░░░░░░░░░░░░░░░░░░░░░░░░░░░░░░░░░░░░░░░░░░░░░░░░░░░░░░░░░░░░░░░░░░░░░░░░░░░░░░░░░░░░░░░░░░
//                      Position Control
// ░░░░░░░░░░░░░░░░░░░░░░░░░░░░░░░░░░░░░░░░░░░░░░░░░░░░░░░░░░░░░░░░░░░░░░░░░░░░░░░░░░░░░░░░░░░░░░░░░░░░░░░░░░░░░░░░░░░░░░░░░░░░░░░░░░░░░░░░░░░░░░░░░░
// Long, Short Entry Condition + Not entered Position Yet
bool openLong           = longCond and not (strategy.opentrades.size(strategy.opentrades - 1) > 0) and longFilterFilled
bool openShort          = shortCond and not (strategy.opentrades.size(strategy.opentrades - 1) < 0) and shortFilterFilled
bool enteringTrade      = openLong or openShort
float entryBarIndex     = bar_index

// Long, Short Entry Fulfilled or Already Entered
bool inLong             = openLong or strategy.opentrades.size(strategy.opentrades - 1) > 0 and not closeLong
bool inShort            = openShort or strategy.opentrades.size(strategy.opentrades - 1) < 0 and not closeShort

// ░░░░░░░░░░░░░░░░░░░░░░░░░░░░░░░░░░░░░░░░░░░░░░░░░░░░░░░░░░░░░░░░░░░░░░░░░░░░░░░░░░░░░░░░░░░░░░░░░░░░░░░░░░░░░░░░░░░░░░░░░░░░░░░░░░░░░░░░░░░░░░░░░░
//                      Stop Loss - Inputs, Indicaotrs
// ░░░░░░░░░░░░░░░░░░░░░░░░░░░░░░░░░░░░░░░░░░░░░░░░░░░░░░░░░░░░░░░░░░░░░░░░░░░░░░░░░░░░░░░░░░░░░░░░░░░░░░░░░░░░░░░░░░░░░░░░░░░░░░░░░░░░░░░░░░░░░░░░░░
//// Use SL? TSL? 
i_useSLTP               = input.bool   (defval =  true, title = "Enable SL & TP?", tooltip = "", inline = "1", group = "Stop Loss") 
i_tslEnabled            = input.bool   (defval = false , title = "Enable Trailing SL?", tooltip = "Enable Stop Loss & Take Profit? \n\Enable Trailing SL?", inline = "1", group = "Stop Loss") 
// i_breakEvenAfterTP   = input.bool   (defval = false, title = 'Enable Break Even After TP?', tooltip = 'When Take Profit price target is hit, move the Stop Loss to the entry price (or to a more strict price defined by the Stop Loss %/ATR Multiplier).', inline = '2', group = 'Stop Loss / Take Profit')
//// Sl Options
i_slType                = input.string (defval = "ATR", title = "Stop Loss Type", options = ["Percent", "ATR", "Previous LL / HH"], tooltip = "Stop Loss based on %? ATR?", inline = "3", group = "Stop Loss") 
i_slATRLen              = input.int    (defval = 14, title = "ATR Length", minval = 1 , maxval = 200 , step = 1, inline = "4", group = "Stop Loss")  
i_slATRMult             = input.float  (defval = 3, title = "ATR Multiplier", minval = 1 , maxval = 200 , step = 0.1, tooltip = "", inline = "4", group = "Stop Loss") 
i_slPercent             = input.float  (defval = 3, title = "Percent", tooltip = "", inline = "5", group = "Stop Loss")
i_slLookBack            = input.int    (defval = 30, title = "Lowest Price Before Entry", group = "Stop Loss",  inline = "6", minval = 30, step = 1, tooltip = "Lookback to find the Lowest Price. \nStopLoss is determined by the Lowest price of the look back period. Take Profit is derived from this also by multiplying the StopLoss value by the Risk:Reward multiplier.")

// Functions for Stop Loss
float openAtr           = ta.valuewhen(condition = enteringTrade, source = ta.atr(i_slATRLen), occurrence = 0) 
float openLowest        = ta.valuewhen(condition = openLong, source = ta.lowest(low, i_slLookBack), occurrence = 0)
float openHighest       = ta.valuewhen(condition = openShort, source = ta.highest(high, i_slLookBack), occurrence = 0)

f_getLongSLPrice(source) =>
    switch i_slType
        "Percent"           => source * (1 - (i_slPercent/100))
        "ATR"               => source - (i_slATRMult * openAtr)
        "Previous LL / HH"  => openLowest
        => na

f_getShortSLPrice(source) =>
    switch i_slType
        "Percent"           => source * (1 + (i_slPercent/100))
        "ATR"               => source + (i_slATRMult * openAtr)
        "Previous LL / HH"  => openHighest
        => na

// Calculate Stop Loss
var float longSLPrice   = na
var float shortSLPrice  = na
bool longTPExecuted     = false
bool shortTPExecuted    = false

longSLPrice := if (inLong and i_useSLTP)
    if (openLong)
        f_getLongSLPrice (close)
    else
        // 1. Trailing Stop Loss
        if i_tslEnabled
            stopLossPrice = f_getLongSLPrice (high) 
            math.max(stopLossPrice, nz(longSLPrice[1])) 
        // 2. Normal StopLoss
        else
            nz(source = longSLPrice[1], replacement = 0) 
else
    na           

shortSLPrice := if (inShort and i_useSLTP)
    if (openShort)
        f_getShortSLPrice (close)
    else
        // 1. Trailing Stop Loss
        if i_tslEnabled
            stopLossPrice = f_getShortSLPrice (low) 
            math.min(stopLossPrice, nz(shortSLPrice[1])) 
        // 2. Normal StopLoss
        else
            nz(source = shortSLPrice[1], replacement = 999999.9) 
else
    na           

// Plot: Stop Loss of Long, Short Entry
var longSLPriceColor    = color.new(color.maroon, 0)
plot(series = longSLPrice, title = 'Long Stop Loss', color = longSLPriceColor, linewidth = 1, style = plot.style_linebr, offset = 1)
var shortSLPriceColor   = color.new(color.maroon, 0)
plot(series = shortSLPrice, title = 'Short Stop Loss', color = shortSLPriceColor, linewidth = 1, style = plot.style_linebr, offset = 1)

// ░░░░░░░░░░░░░░░░░░░░░░░░░░░░░░░░░░░░░░░░░░░░░░░░░░░░░░░░░░░░░░░░░░░░░░░░░░░░░░░░░░░░░░░░░░░░░░░░░░░░░░░░░░░░░░░░░░░░░░░░░░░░░░░░░░░░░░░░░░░░░░░░░░
//                      Take Profit - Inputs, Indicaotrs
// ░░░░░░░░░░░░░░░░░░░░░░░░░░░░░░░░░░░░░░░░░░░░░░░░░░░░░░░░░░░░░░░░░░░░░░░░░░░░░░░░░░░░░░░░░░░░░░░░░░░░░░░░░░░░░░░░░░░░░░░░░░░░░░░░░░░░░░░░░░░░░░░░░░
i_useTPExit             = input.bool   (defval = true, title = "Use Take Profit?", tooltip = "", inline = "1", group = "Take Profit") 
i_RRratio               = input.float  (defval = 1.8, title = "R:R Ratio", minval = 0.1 , maxval = 200 , step = 0.1, tooltip = "R:R Ratio > Risk Reward Ratio? It will automatically set Take Profit % based on Stop Loss", inline = "2", group = "Take Profit") 
i_tpQuantityPerc        = input.float  (defval = 50, title = 'Take Profit Quantity %', minval = 0.0, maxval = 100, step = 1.0, tooltip = '% of position closed when tp target is met.', inline="34", group = 'Take Profit')

var float longTPPrice   = na
var float shortTPPrice  = na

f_getLongTPPrice() =>
    close + i_RRratio * math.abs (close - f_getLongSLPrice (close))

f_getShortTPPrice() =>
    close - i_RRratio * math.abs(close - f_getShortSLPrice (close))

longTPPrice := if (inLong and i_useSLTP)
    if (openLong)
        f_getLongTPPrice ()
    else
        nz(source = longTPPrice[1], replacement = f_getLongTPPrice ()) 
else
    na

shortTPPrice := if (inShort and i_useSLTP)
    if (openShort)
        f_getShortTPPrice ()
    else
        nz(source = shortTPPrice[1], replacement = f_getShortTPPrice ()) 
else
    na

// Plot: Take Profit of Long, Short Entry 
var longTPPriceColor    = color.new(color.teal, 0)
plot(series = longTPPrice, title = 'Long Take Profit', color = longTPPriceColor, linewidth = 1, style = plot.style_linebr, offset = 1)
var shortTPPriceColor   = color.new(color.teal, 0)
plot(series = shortTPPrice, title = 'Short Take Profit', color = shortTPPriceColor, linewidth = 1, style = plot.style_linebr, offset = 1)

// Plot: Entry Price 
var posColor            = color.new(color.white, 0)
plot(series = strategy.opentrades.entry_price(strategy.opentrades - 1), title = 'Position Entry Price', color = posColor, linewidth = 1, style = plot.style_linebr)

// ░░░░░░░░░░░░░░░░░░░░░░░░░░░░░░░░░░░░░░░░░░░░░░░░░░░░░░░░░░░░░░░░░░░░░░░░░░░░░░░░░░░░░░░░░░░░░░░░░░░░░░░░░░░░░░░░░░░░░░░░░░░░░░░░░░░░░░░░░░░░░░░░░░
//                      Quantity - Inputs
// ░░░░░░░░░░░░░░░░░░░░░░░░░░░░░░░░░░░░░░░░░░░░░░░░░░░░░░░░░░░░░░░░░░░░░░░░░░░░░░░░░░░░░░░░░░░░░░░░░░░░░░░░░░░░░░░░░░░░░░░░░░░░░░░░░░░░░░░░░░░░░░░░░░
i_useRiskManangement    = input.bool  (defval = true, title = "Use Risk Manangement?", tooltip = "", inline = "1", group = "Quantity") 
i_riskPerTrade          = input.float (defval = 3, title = "Risk Per Trade (%)", minval = 0, maxval = 100, step = 0.1, tooltip = "Use Risk Manangement by Quantity Control?", inline = "2", group = "Quantity") 
// i_leverage              = input.float (defval = 2, title = "Leverage", minval = 0, maxval = 100, step = 0.1, tooltip = "Leverage", inline = "3", group = "Quantity") 

float qtyPercent        = na
float entryQuantity     = na

f_calQtyPerc() =>
    if (i_useRiskManangement)
        riskPerTrade        = (i_riskPerTrade) / 100 // 1번 거래시 3% 손실
        stopLossPrice       = openLong ? f_getLongSLPrice (close) : openShort ? f_getShortSLPrice (close) : na
        riskExpected        = math.abs((close-stopLossPrice)/close) // 손절가랑 6% 차이
        riskPerTrade / riskExpected  // 0 ~ 1
    else
        1

f_calQty(qtyPerc) =>
    math.min (math.max (0.000001, strategy.equity / close * qtyPerc), 1000000000)
    
// TP Execution
longTPExecuted          := strategy.opentrades.size(strategy.opentrades - 1) > 0 and (longTPExecuted[1] or strategy.opentrades.size(strategy.opentrades - 1) < strategy.opentrades.size(strategy.opentrades - 1)[1] or strategy.opentrades.size(strategy.opentrades - 1)[1] == 0 and high >= longTPPrice)
shortTPExecuted         := strategy.opentrades.size(strategy.opentrades - 1) < 0 and (shortTPExecuted[1] or strategy.opentrades.size(strategy.opentrades - 1) > strategy.opentrades.size(strategy.opentrades - 1)[1] or strategy.opentrades.size(strategy.opentrades - 1)[1] == 0 and low <= shortTPPrice)

// ░░░░░░░░░░░░░░░░░░░░░░░░░░░░░░░░░░░░░░░░░░░░░░░░░░░░░░░░░░░░░░░░░░░░░░░░░░░░░░░░░░░░░░░░░░░░░░░░░░░░░░░░░░░░░░░░░░░░░░░░░░░░░░░░░░░░░░░░░░░░░░░░░░
//                      Plot Label, Boxes, Results, Etc
// ░░░░░░░░░░░░░░░░░░░░░░░░░░░░░░░░░░░░░░░░░░░░░░░░░░░░░░░░░░░░░░░░░░░░░░░░░░░░░░░░░░░░░░░░░░░░░░░░░░░░░░░░░░░░░░░░░░░░░░░░░░░░░░░░░░░░░░░░░░░░░░░░░░
i_showSimpleLabel       = input.bool(false, "Show Simple Label for Entry?",     group = "Strategy: Drawings",           inline = "1",  tooltip ="") 
i_showLabels            = input.bool(true, "Show Trade Exit Labels",            group = "Strategy: Drawings",           inline = "1",  tooltip = "Useful labels to identify Profit/Loss and cumulative portfolio capital after each trade closes.\n\nAlso note that TradingView limits the max number of 'boxes' that can be displayed on a chart (max 500). This means when you lookback far enough on the chart you will not see the TP/SL boxes. However you can check this option to identify where trades exited.")
i_showDashboard         = input.bool(true, "Show Dashboard",                    group = "Strategy: Drawings",           inline = "2",  tooltip = "Show Backtest Results. Backtest Dates, Win/Lose Rates, Etc.")

// Plot: Label for Long, Short Entry
var openLongColor       = color.new(#2962FF, 0)
var openShortColor      = color.new(#FF1744, 0)
var entryTextColor      = color.new(color.white, 0)

if (openLong and i_showSimpleLabel)
    label.new (x = bar_index, y = na, text = 'Open', yloc = yloc.belowbar, color = openLongColor, style = label.style_label_up, textcolor = entryTextColor)
    entryBarIndex := bar_index
if (openShort and i_showSimpleLabel)
    label.new (x = bar_index, y = na, text = 'Close', yloc = yloc.abovebar, color = openShortColor, style = label.style_label_down, textcolor = entryTextColor)
    entryBarIndex := bar_index

float prevEntryPrice    = strategy.closedtrades.entry_price (strategy.closedtrades - 1)
float pnl               = strategy.closedtrades.profit      (strategy.closedtrades - 1)
float prevExitPrice     = strategy.closedtrades.exit_price  (strategy.closedtrades - 1)

f_enteringTradeLabel(x, y, qty, entryPrice, slPrice, tpPrice, rrRatio, direction) => 
    if i_showLabels
        labelStr = ("Trade Start" 
              + "\nDirection: " + direction 
              + "\nRisk Per Trade: " + str.tostring (i_useRiskManangement ? i_riskPerTrade : 100, "#.##") + "%"  
              + "\nExpected Risk: " + str.tostring (math.abs((close-slPrice)/close) * 100, "#.##") + "%" 
              + "\nEntry Position Qty: " + str.tostring(math.abs(qty * 100), "#.##") + "%"
              + "\nEntry Price: " + str.tostring(entryPrice, "#.##"))
              + "\nStop Loss Price: " + str.tostring(slPrice, "#.##") 
              + "\nTake Profit Price: " + str.tostring(tpPrice, "#.##") 
              + "\nRisk - Reward Ratio: " + str.tostring(rrRatio, "#.##") 
        label.new(x = x, y = y, text = labelStr, color = color.new(color.blue, 60) , textcolor = color.white, style = label.style_label_up)


f_exitingTradeLabel(x, y, entryPrice, exitPrice, direction) => 
    if i_showLabels
        labelStr = ("Trade Result" 
              + "\nDirection: " + direction 
              + "\nEntry Price: " + str.tostring(entryPrice, "#.##") 
              + "\nExit Price: " + str.tostring(exitPrice,"#.##")
              + "\nGain %: " + str.tostring(direction == 'Long' ? -(entryPrice-exitPrice) / entryPrice * 100 : (entryPrice-exitPrice) / entryPrice * 100 ,"#.##") + "%")
        label.new(x = x, y = y, text = labelStr, color = pnl > 0 ? color.new(color.green, 60) : color.new(color.red, 60), textcolor = color.white, style = label.style_label_down)

f_fillCell(_table, _column, _row, _title, _value, _bgcolor, _txtcolor) =>
    _cellText = _title + " " + _value
    table.cell(_table, _column, _row, _cellText, bgcolor=_bgcolor, text_color=_txtcolor, text_size=size.auto)

// ░░░░░░░░░░░░░░░░░░░░░░░░░░░░░░░░░░░░░░░░░░░░░░░░░░░░░░░░░░░░░░░░░░░░░░░░░░░░░░░░░░░░░░░░░░░░░░░░░░░░░░░░░░░░░░░░░░░░░░░░░░░░░░░░░░░░░░░░░░░░░░░░░░
//                      Orders
// ░░░░░░░░░░░░░░░░░░░░░░░░░░░░░░░░░░░░░░░░░░░░░░░░░░░░░░░░░░░░░░░░░░░░░░░░░░░░░░░░░░░░░░░░░░░░░░░░░░░░░░░░░░░░░░░░░░░░░░░░░░░░░░░░░░░░░░░░░░░░░░░░░░

if (inTime)
    if (openLong)
        qtyPercent        := f_calQtyPerc()
        entryQuantity     := f_calQty(qtyPercent)
        strategy.entry(id = "Long", direction = strategy.long, qty = entryQuantity, comment = 'Long(' + syminfo.ticker + '): Started', alert_message = 'Long(' + syminfo.ticker + '): Started')
        f_enteringTradeLabel(x = bar_index + 1, y = close-3*ta.tr, entryPrice = close, qty = qtyPercent, slPrice = longSLPrice, tpPrice = longTPPrice, rrRatio = i_RRratio, direction = "Long")

    if (openShort)
        qtyPercent        := f_calQtyPerc()
        entryQuantity     := f_calQty(qtyPercent)
        strategy.entry(id = "Short", direction = strategy.short, qty = entryQuantity, comment = 'Short(' + syminfo.ticker + '): Started', alert_message = 'Short(' + syminfo.ticker + '): Started')
        f_enteringTradeLabel(x = bar_index + 1, y = close-3*ta.tr, entryPrice = close, qty = qtyPercent, slPrice = shortSLPrice, tpPrice = shortTPPrice, rrRatio = i_RRratio, direction = "Short")

    if (closeLong)
        strategy.close(id = 'Long', comment = 'Close Long', alert_message = 'Long: Closed at market price')
        strategy.position_size > 0 ? f_exitingTradeLabel(x = bar_index, y = close+3*ta.tr, entryPrice = prevEntryPrice, exitPrice = prevExitPrice, direction = 'Long') : na

    if (closeShort)
        strategy.close(id = 'Short', comment = 'Close Short', alert_message = 'Short: Closed at market price')
        strategy.position_size < 0 ? f_exitingTradeLabel(x = bar_index, y = close+3*ta.tr, entryPrice = prevEntryPrice, exitPrice = prevExitPrice, direction = 'Short') : na

    if (inLong)
        strategy.exit(id = 'Long TP / SL', from_entry = 'Long', qty_percent = i_tpQuantityPerc, limit = longTPPrice, stop = longSLPrice, alert_message = 'Long(' + syminfo.ticker + '): Take Profit or Stop Loss executed')
        strategy.exit(id = 'Long SL', from_entry = 'Long', stop = longSLPrice, alert_message = 'Long(' + syminfo.ticker + '): Stop Loss executed')

    if (inShort)
        strategy.exit(id = 'Short TP / SL', from_entry = 'Short', qty_percent = i_tpQuantityPerc, limit = shortTPPrice, stop = shortSLPrice, alert_message = 'Short(' + syminfo.ticker + '): Take Profit or Stop Loss executed')
        strategy.exit(id = 'Short SL', from_entry = 'Short', stop = shortSLPrice, alert_message = 'Short(' + syminfo.ticker + '): Stop Loss executed')
    
    if strategy.position_size[1] > 0 and strategy.position_size == 0
        f_exitingTradeLabel(x = bar_index, y = close+3*ta.tr, entryPrice = prevEntryPrice, exitPrice = prevExitPrice, direction = 'Long')
    
    if strategy.position_size[1] < 0 and strategy.position_size == 0
        f_exitingTradeLabel(x = bar_index, y = close+3*ta.tr, entryPrice = prevEntryPrice, exitPrice = prevExitPrice, direction = 'Short')

// ░░░░░░░░░░░░░░░░░░░░░░░░░░░░░░░░░░░░░░░░░░░░░░░░░░░░░░░░░░░░░░░░░░░░░░░░░░░░░░░░░░░░░░░░░░░░░░░░░░░░░░░░░░░░░░░░░░░░░░░░░░░░░░░░░░░░░░░░░░░░░░░░░░
//                      Backtest Result Dashboard
// ░░░░░░░░░░░░░░░░░░░░░░░░░░░░░░░░░░░░░░░░░░░░░░░░░░░░░░░░░░░░░░░░░░░░░░░░░░░░░░░░░░░░░░░░░░░░░░░░░░░░░░░░░░░░░░░░░░░░░░░░░░░░░░░░░░░░░░░░░░░░░░░░░░

// if i_showDashboard
//     var bgcolor = color.new(color = color.black, transp = 100)
//     var greenColor = color.new(color = #02732A, transp = 0)
//     var redColor = color.new(color = #D92332, transp = 0)
//     var yellowColor = color.new(color = #F2E313, transp = 0)
//     // Keep track of Wins/Losses streaks
//     newWin  = (strategy.wintrades  > strategy.wintrades[1]) and (strategy.losstrades == strategy.losstrades[1]) and (strategy.eventrades == strategy.eventrades[1])
//     newLoss = (strategy.wintrades == strategy.wintrades[1]) and (strategy.losstrades  > strategy.losstrades[1]) and (strategy.eventrades == strategy.eventrades[1])

//     varip int winRow     = 0
//     varip int lossRow    = 0
//     varip int maxWinRow  = 0
//     varip int maxLossRow = 0

//     if newWin
//         lossRow := 0
//         winRow := winRow + 1
//     if winRow > maxWinRow
//         maxWinRow := winRow
        
//     if newLoss
//         winRow := 0
//         lossRow := lossRow + 1
//     if lossRow > maxLossRow
//         maxLossRow := lossRow


//     // Prepare stats table
//     var table dashTable = table.new(position.top_right, 1, 15, border_width=1)
    
   
//     if barstate.islastconfirmedhistory
//         dollarReturn = strategy.netprofit
//         f_fillCell(dashTable, 0, 0, "Start:", str.format("{0,date,long}", strategy.closedtrades.entry_time(0)) , bgcolor, color.white) // + str.format(" {0,time,HH:mm}", strategy.closedtrades.entry_time(0)) 
//         f_fillCell(dashTable, 0, 1, "End:", str.format("{0,date,long}", strategy.opentrades.entry_time(0)) , bgcolor, color.white) // + str.format(" {0,time,HH:mm}", strategy.opentrades.entry_time(0))
//         _profit = (strategy.netprofit / strategy.initial_capital) * 100
//         f_fillCell(dashTable, 0, 2, "Net Profit:", str.tostring(_profit, '##.##') + "%", _profit > 0 ? greenColor : redColor, color.white)
//         _numOfDaysInStrategy = (strategy.opentrades.entry_time(0) - strategy.closedtrades.entry_time(0)) / (1000 * 3600 * 24)
//         f_fillCell(dashTable, 0, 3, "Percent Per Day", str.tostring(_profit / _numOfDaysInStrategy, '#########################.#####')+"%", _profit > 0 ? greenColor : redColor, color.white)
//         _winRate = ( strategy.wintrades / strategy.closedtrades ) * 100
//         f_fillCell(dashTable, 0, 4, "Percent Profitable:", str.tostring(_winRate, '##.##') + "%", _winRate < 50 ? redColor : _winRate < 75 ? greenColor : yellowColor, color.white)
//         f_fillCell(dashTable, 0, 5, "Profit Factor:", str.tostring(strategy.grossprofit / strategy.grossloss,  '##.###'), strategy.grossprofit > strategy.grossloss ? greenColor : redColor, color.white)
//         f_fillCell(dashTable, 0, 6, "Total Trades:", str.tostring(strategy.closedtrades), bgcolor, color.white)
//         f_fillCell(dashTable, 0, 8, "Max Wins In A Row:", str.tostring(maxWinRow, '######') , bgcolor, color.white)
//         f_fillCell(dashTable, 0, 9, "Max Losses In A Row:", str.tostring(maxLossRow, '######') , bgcolor, color.white)