
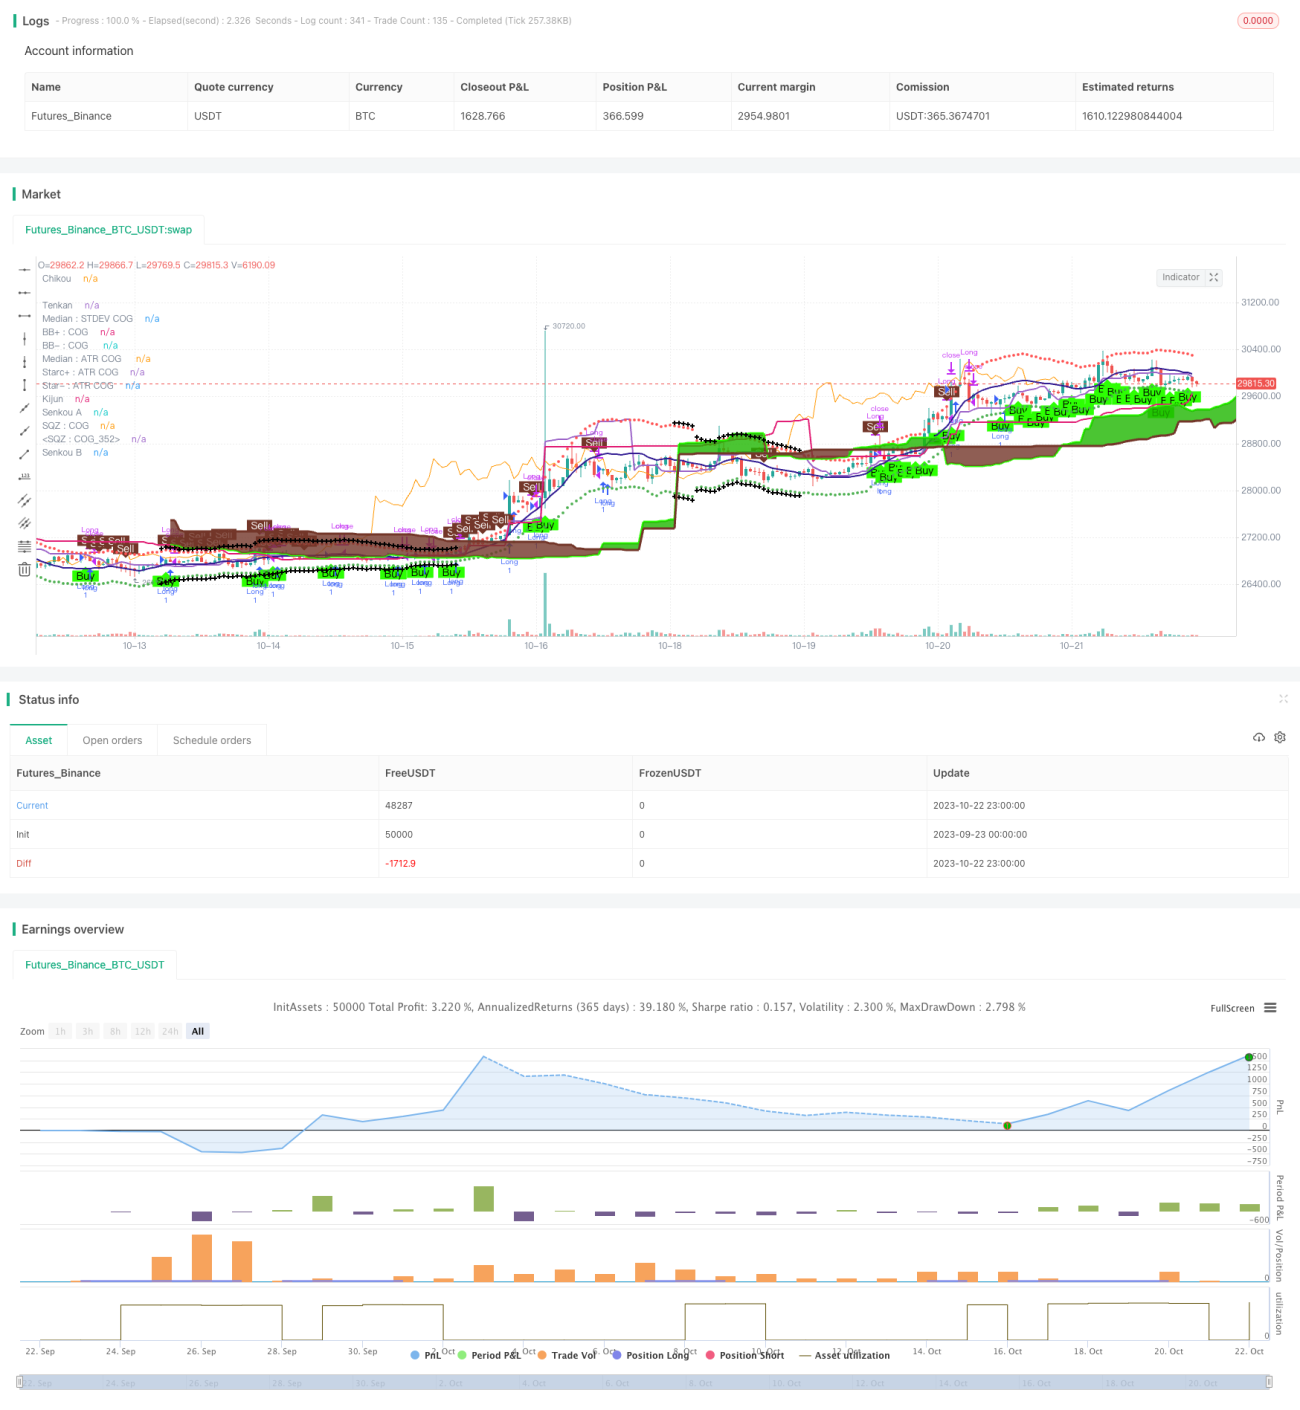
これは,複数の技術指標を組み合わせて多空判断を行う定量取引戦略である.この戦略は,動態指標,トレンド指標,イチモク雲図などの複数の要因を総合的に考慮して,最終的な買入判断を形成する.この戦略は,強い安定性とリスク抵抗性がある.
この戦略は以下の部分から構成されています.
動量指標:パラボリックSAR,Leledc強度指標,Kaufman自主移動平均など
トレンド・インジケータ:ラフール・モヒンダール・シェイバー,トレンド・マジック
イチモク雲図: テンカン線,キジュン線など
ボリューム・フロー・インジケーター
波動指標: 波動トレンドオシレータ
TDシーケンス
これらの指標は,それぞれ異なる角度から現在の市場トレンドと強さを判断する.パラボリックSARはトレンドの逆転点を判断する,Leledc強度指標はモメンタムを判断する,Ichimoku雲図はサポート圧力を判断する.ほとんどの指標が同方向のシグナルを与えるとき,最終的な買いまたは売り判断を形成する.
この戦略は,月,日の指定日間の範囲でのみ取引を行うためのフィルタリング条件を同時に設定し,無効取引の回数を減らす.
多因子総合判断,より高い精度,より強いリスク抵抗性
単一の指標が失敗するリスクを回避するために,さまざまなタイプの指標をクロス検証する
フィルタリング条件を設定し,不適切な時間帯で無効取引を避ける
パイン・スクリプトで作成され,TradingViewのプラットフォームに直接アクセスできます.
指数のパラメータは,異なる市場向けに最適化することができます.
市場構造を直感的に判断する指標信号を可視化
多因子組合せは重みとパラメータの調整を必要とし,ある程度の最適化困難がある.
単一の指標は,特定の市場の状況で有効でない可能性があります.
フィルタリング条件を正しく設定しない場合, 機会が失われます.
過剰な最適化には注意が必要です
交易者は指標の失敗のリスクに注意し,戦略を適時に調整する必要があります.
対策として
現在の市場に対してより効果的になるように指標のパラメータを最適化
体重を調整し,有効な指標の作用を大きくし,無効な指標の作用を小さくする.
フィルタリング条件を適時調整し,機会とリスクの両方を把握する
機械学習アルゴリズムを追加し,指標の重みを自動的に調整する
感情指数や資金流動指数など
取引品種や期間をテストし,最適なパラメータを設定する.
ポジションの長さの違いを検証する
季節性や経済データなどの フィルタリング条件が加わります
ストップ・ロスの追加
この戦略は,複数の指標を統合して最終判断を形成し,リスクに対する強い強さの優位性を持っています.同時に,単一の指標の失敗のリスク,継続的な最適化および調整パラメータにも注意する必要があります.将来,指標の重量設定をさらに最適化し,より多くの要因を追加し,最適なポジション周期をテストすることができます.
//@version=2
persistent_bull = nz(persistent_bull[1],0)
persistent_bear = nz(persistent_bear[1],0)
strategy("Strategy for The Bitcoin Buy/Sell Indicator", overlay=true, calc_on_every_tick=true)
// ****************************************Inputs***************************************************************
//@fixme if there is a buy and sell signal on the same bar, then it displays the first one and skips the second one. Fix this issue
buySellSignal = true // Make this false if you do not want to show Buy/Sell signal
inputIndividualSiganlPlot = true // = input (false, "Do you want to display each individual indicator's signal on the chart?")
sp = input (false, "Do you want to display Parabolic SAR?")
spLines = input (false, "Do you want to display Parabolic SAR on the chart?")
sCloud = input(false, "Do you want to display the Tenkan and Kijun lines of Ichimoku lines on the chart?")
sL = input (false, "Do you want to display Leledec Exhausion - Leledc on the chart?")
sTD = false
sRMO = input(false, "Do you want to display Rahul Mohindar Oscillator - RMO on the chart?")
inputAma = input(false, title="Do you want to display Kaufman AMA wave - AMA on the chart?")
tm = input (false, "Do you want to display Trend Magic signals on the chart?")
wtoLB = input (false, "Do you want to display WaveTrend Oscillator - WTO on the chart?")
vfiLB = input (false, "Do you want to display Volume Flow Indicator - VFI on the chart?")
cogRegionFillTransp = 100 // input(false, "Do you want to display COG Region Fill and ATR Starc+/-")
inputNeutralMinorSignals = input (false, title="Do you want to not display the minor or the not so strong signals from Ichimoku")
maj=true // input(true,title="Show Major Leledc Exhausion Bar signal")
min=input(false,title="Show Minor Leledc Exhausion Bar signal")
tenkanPeriods = input(20, minval=9, title="Tenkan Period - Ichimoku [9 or 10 or 20]")
kijunPeriods = input(60, minval=26, title="Kijun Period - Ichimoku [26 or 30 or 60]")
chikouPeriods = input(120, minval=52, title="Chikou - Ichimoku [52 or 60 or 120]")
displacement = input(30, minval=26, title="Displacement - Ichimoku [26 or 30]")
// ****************************************General Color Variables***************************************************************
colorLime = #006400 // Warning sign for long trade
colorBuy= #2DFF03 // Good sign for long trade
colorSell = #733629 // Good sign for short trade
colorMaroon =#8b0000 // Warning sign for short trade
colorBlue =#0000ff // No clear sign
colorGray = #a9a9a9 // Gray Color (For Squeeze momentum indicator)
colorBlack = #000000 // Black
colorWhite = #ffffff // White
colorTenkanViolet = #800000 // Tenkan-sen line color
colorKijun = #0000A6 // Kijun-sen line color
// TD Sequential bar colors
tdSell = #ff6666
tdSellOvershoot = #ff1a1a
tdSellOvershoot1 = #cc0000
tdSellOverShoot2 = #990000
tdSellOverShoot3 = #732626
tdBuy = #80ff80
tdBuyOverShoot = #33ff33
tdBuyOvershoot1 = #00cc00
tdBuyOverShoot2 = #008000
tdBuyOvershoot3 = #004d00
// ****************************************Icons***************************************************************
upSign = '↑' // indicates the indicator shows uptrend
downSign = '↓' // incicates the indicator showing downtrend
exitSign ='x' //indicates the indicator uptrend/downtrend ending
// diamond signals weakBullishSignal or weakBearishsignal
// flag signals neutralBullishSignal or neutralBearishSignal
// ****************************************Parabolic SAR code***************************************************************
start = 2
increment = 2
maximum = 2
sus = true
sds = true
disc = false
startCalc = start * .01
incrementCalc = increment * .01
maximumCalc = maximum * .10
sarUp = sar(startCalc, incrementCalc, maximumCalc)
sarDown = sar(startCalc, incrementCalc, maximumCalc)
colUp = spLines and close >= sarDown ? colorLime : na
colDown = spLines and close <= sarUp ? colorSell : na
//@fixme Does not display the correct values for up and down pSAR
plot(sp and sus and sarUp ? sarUp : na, title="↓ SAR", style=cross, linewidth=3,color=colUp)
plot(sp and sds and sarDown ? sarDown : na, title="↑ SAR", style=circles, linewidth=3,color=colDown)
startSAR = 0.02
incrementSAR = 0.02
maximumSAR = 0.2
psar = sar(startSAR, incrementSAR, maximumSAR)
bullishPSAR = psar < high and psar[1] > low
bearishPSAR= psar > low and psar[1] < high
//***********************Leledc Exhausion Bar***********************************************
maj_qual=6
maj_len=30
min_qual=5
min_len=5
lele(qual,len)=>
bindex=nz(bindex[1],0)
sindex=nz(sindex[1],0)
ret=0
if (close>close[4])
bindex:=bindex + 1
if(close<close[4])
sindex:=sindex + 1
if (bindex>qual) and (close<open) and high>=highest(high,len)
bindex:=0
ret:=-1
if ((sindex>qual) and (close>open) and (low<= lowest(low,len)))
sindex:=0
ret:=1
return=ret
major=lele(maj_qual,maj_len)
minor=lele(min_qual,min_len)
leledecMajorBullish = maj ? (major==1?low:na) : na
leledecMajorBearish = maj ? (major==-1?high:na) : na
//****************Ichimoku ************************************
donchian(len) => avg(lowest(len), highest(len))
tenkan = donchian(tenkanPeriods)
kijun = donchian(kijunPeriods)
senkouA = avg(tenkan, kijun)
senkouB = donchian(chikouPeriods)
displacedSenkouA = senkouA[displacement]
displacedSenkouB = senkouB[displacement]
bullishSignal = crossover(tenkan, kijun)
bearishSignal = crossunder(tenkan, kijun)
bullishSignalValues = iff(bullishSignal, tenkan, na)
bearishSignalValues = iff(bearishSignal, tenkan, na)
strongBullishSignal = crossover(tenkan, kijun) and bullishSignalValues > displacedSenkouA and bullishSignalValues > displacedSenkouB and low > tenkan and displacedSenkouA > displacedSenkouB
strongBearishSignal = bearishSignalValues < displacedSenkouA and bearishSignalValues < displacedSenkouB and high < tenkan and displacedSenkouA < displacedSenkouB
neutralBullishSignal = (bullishSignalValues > displacedSenkouA and bullishSignalValues < displacedSenkouB) or (bullishSignalValues < displacedSenkouA and bullishSignalValues > displacedSenkouB)
weakBullishSignal = bullishSignalValues < displacedSenkouA and bullishSignalValues < displacedSenkouB
neutralBearishSignal = (bearishSignalValues > displacedSenkouA and bearishSignalValues < displacedSenkouB) or (bearishSignalValues < displacedSenkouA and bearishSignalValues > displacedSenkouB)
weakBearishSignal = bearishSignalValues > displacedSenkouA and bearishSignalValues > displacedSenkouB
//*********************Kaufman AMA wave*********************//
src=close
lengthAMA=20
filterp = 10
d=abs(src-src[1])
s=abs(src-src[lengthAMA])
noise=sum(d, lengthAMA)
efratio=s/noise
fastsc=0.6022
slowsc=0.0645
smooth=pow(efratio*fastsc+slowsc, 2)
ama=nz(ama[1], close)+smooth*(src-nz(ama[1], close))
filter=filterp/100 * stdev(ama-nz(ama), lengthAMA)
amalow=ama < nz(ama[1]) ? ama : nz(amalow[1])
amahigh=ama > nz(ama[1]) ? ama : nz(amahigh[1])
bw=(ama-amalow) > filter ? 1 : (amahigh-ama > filter ? -1 : 0)
s_color=bw > 0 ? colorBuy : (bw < 0) ? colorSell : colorBlue
amaLongConditionEntry = s_color==colorBuy and s_color[1]!=colorBuy
amaShortConditionEntry = s_color==colorSell and s_color[1]!=colorSell
//***********************Rahul Mohindar Oscillator ******************************//
C=close
cm2(x) => sma(x,2)
ma1=cm2(C)
ma2=cm2(ma1)
ma3=cm2(ma2)
ma4=cm2(ma3)
ma5=cm2(ma4)
ma6=cm2(ma5)
ma7=cm2(ma6)
ma8=cm2(ma7)
ma9=cm2(ma8)
ma10=cm2(ma9)
SwingTrd1 = 100 * (close - (ma1+ma2+ma3+ma4+ma5+ma6+ma7+ma8+ma9+ma10)/10)/(highest(C,10)-lowest(C,10))
SwingTrd2=ema(SwingTrd1,30)
SwingTrd3=ema(SwingTrd2,30)
RMO= ema(SwingTrd1,81)
Buy=cross(SwingTrd2,SwingTrd3)
Sell=cross(SwingTrd3,SwingTrd2)
Bull_Trend=ema(SwingTrd1,81)>0
Bear_Trend=ema(SwingTrd1,81)<0
Ribbon_kol=Bull_Trend ? colorBuy : (Bear_Trend ? colorSell : colorBlue)
Impulse_UP= SwingTrd2 > 0
Impulse_Down= RMO < 0
bar_kol=Impulse_UP ? colorBuy : (Impulse_Down ? colorSell : (Bull_Trend ? colorBuy : colorBlue))
rahulMohindarOscilllatorLongEntry = Ribbon_kol==colorBuy and Ribbon_kol[1]!=colorBuy and Ribbon_kol[1]==colorSell and bar_kol==colorBuy
rahulMohindarOscilllatorShortEntry = Ribbon_kol==colorSell and Ribbon_kol[1]!=colorSell and Ribbon_kol[1]==colorBuy and bar_kol==colorSell
//***********************TD Sequential code ******************************//
transp=0
Numbers=false
SR=false
Barcolor=true
TD = close > close[4] ?nz(TD[1])+1:0
TS = close < close[4] ?nz(TS[1])+1:0
TDUp = TD - valuewhen(TD < TD[1], TD , 1 )
TDDn = TS - valuewhen(TS < TS[1], TS , 1 )
priceflip = barssince(close<close[4])
sellsetup = close>close[4] and priceflip
sell = sellsetup and barssince(priceflip!=9)
sellovershoot = sellsetup and barssince(priceflip!=13)
sellovershoot1 = sellsetup and barssince(priceflip!=14)
sellovershoot2 = sellsetup and barssince(priceflip!=15)
sellovershoot3 = sellsetup and barssince(priceflip!=16)
priceflip1 = barssince(close>close[4])
buysetup = close<close[4] and priceflip1
buy = buysetup and barssince(priceflip1!=9)
buyovershoot = barssince(priceflip1!=13) and buysetup
buyovershoot1 = barssince(priceflip1!=14) and buysetup
buyovershoot2 = barssince(priceflip1!=15) and buysetup
buyovershoot3 = barssince(priceflip1!=16) and buysetup
TDbuyh = valuewhen(buy,high,0)
TDbuyl = valuewhen(buy,low,0)
TDsellh = valuewhen(sell,high,0)
TDselll = valuewhen(sell,low,0)
//***********************Volume Flow Indicator [LazyBear] ******************************//
lengthVFI = 130
coefVFI = 0.2
vcoefVFI = 2.5
signalLength= 5
smoothVFI=true
ma(x,y) => smoothVFI ? sma(x,y) : x
typical=hlc3
inter = log( typical ) - log( typical[1] )
vinter = stdev(inter, 30 )
cutoff = coefVFI * vinter * close
vave = sma( volume, lengthVFI )[1]
vmax = vave * vcoefVFI
vc = iff(volume < vmax, volume, vmax)
mf = typical - typical[1]
vcp = iff( mf > cutoff, vc, iff ( mf < -cutoff, -vc, 0 ) )
vfi = ma(sum( vcp , lengthVFI )/vave, 3)
vfima=ema( vfi, signalLength )
dVFI=vfi-vfima
bullishVFI = vfi > 0 and vfi[1] <=0
bearishVFI = vfi < 0 and vfi[1] >=0
//***********************WaveTrend Oscillator [WT] ******************************//
n1 = 10
n2 = 21
obLevel1 = 60
obLevel2 = 53
osLevel1 = -60
osLevel2 = -53
ap = hlc3
esa = ema(ap, n1)
dWTI = ema(abs(ap - esa), n1)
ci = (ap - esa) / (0.015 * dWTI)
tci = ema(ci, n2)
wt1 = tci
wt2 = sma(wt1,4)
wtiSignal = wt1-wt2
bullishWTI = wt1 > osLevel1 and wt1[1] <= osLevel1 and wtiSignal > 0
bearishWTI = wt1 < obLevel1 and wt1[1] >= obLevel1 and wtiSignal < 0
// **************** Trend Magic code adapted from Glaz ********************* /
CCI = 20 // input(20)
ATR = 5 // input(5)
Multiplier=1 // input(1,title='ATR Multiplier')
original=true // input(true,title='original coloring')
thisCCI = cci(close, CCI)
lastCCI = nz(thisCCI[1])
bufferDn= high + Multiplier * sma(tr,ATR)
bufferUp= low - Multiplier * sma(tr,ATR)
if (thisCCI >= 0 and lastCCI < 0)
bufferUp := bufferDn[1]
if (thisCCI <= 0 and lastCCI > 0)
bufferDn := bufferUp[1]
if (thisCCI >= 0)
if (bufferUp < bufferUp[1])
bufferUp := bufferUp[1]
else
if (thisCCI <= 0)
if (bufferDn > bufferDn[1])
bufferDn := bufferDn[1]
x=thisCCI >= 0 ?bufferUp:thisCCI <= 0 ?bufferDn:x[1]
swap=x>x[1]?1:x<x[1]?-1:swap[1]
swap2=swap==1?lime:red
swap3=thisCCI >=0 ?lime:red
swap4=original?swap3:swap2
bullTrendMagic = swap4 == lime and swap4[1] == red
bearTrendMagic = swap4 == red and swap4[1] == lime
// ************ Indicator: Custom COG channel by Lazy Bear **************** //
srcCOG = close
lengthCOG = 34
median=0
multCOG= 2.5 // input(2.5)
offset = 20 //input(20)
tr_custom() =>
x1=high-low
x2=abs(high-close[1])
x3=abs(low-close[1])
max(x1, max(x2,x3))
atr_custom(x,y) =>
sma(x,y)
dev = (multCOG * stdev(srcCOG, lengthCOG))
basis=linreg(srcCOG, lengthCOG, median)
ul = (basis + dev)
ll = (basis - dev)
tr_v = tr_custom()
acustom=(2*atr_custom(tr_v, lengthCOG))
uls=basis+acustom
lls=basis-acustom
// Plot STDEV channel
plot(basis, linewidth=1, color=navy, style=line, linewidth=1, title="Median : STDEV COG")
lb=plot(ul, color=red, linewidth=1, title="BB+ : COG", style=hline.style_dashed)
tb=plot(ll, color=green, linewidth=1, title="BB- : COG ", style=hline.style_dashed)
fill(tb,lb, silver, title="Region fill: STDEV COG", transp=cogRegionFillTransp)
// Plot ATR channel
plot(basis, linewidth=2, color=navy, style=line, linewidth=2, title="Median : ATR COG ")
ls=plot(uls, color=red, linewidth=1, title="Starc+ : ATR COG", style=circles, transp=cogRegionFillTransp)
ts=plot(lls, color=green, linewidth=1, title="Star- : ATR COG", style=circles, transp=cogRegionFillTransp)
fill(ts,tb, green, title="Region fill : ATR COG", transp=cogRegionFillTransp)
fill(ls,lb, red, title="Region fill : ATR COG", transp=cogRegionFillTransp)
// Mark SQZ
plot_offs_high=0.002
plot_offs_low=0.002
sqz_f=(uls>ul) and (lls<ll)
b_color=sqz_f ? colorBlack : na
plot(sqz_f ? lls - (lls * plot_offs_low) : na, color=b_color, style=cross, linewidth=3, title="SQZ : COG", trasp=0)
plot(sqz_f ? uls + (uls * plot_offs_high) : na, color=b_color, style=cross, linewidth=3, title="SQZ : COG", trasp=0)
// ****************************************All the plots and coloring of bars***************************************************************
// Trend Magic
plotchar(tm and bullTrendMagic, title="TM", char=upSign, location=location.belowbar, color=colorBuy, transp=0, text="TM", textcolor=colorBuy, size=size.auto)
plotchar(tm and bearTrendMagic, title="TM", char=downSign, location=location.abovebar, color=colorSell, transp=0, text="TM", textcolor=colorSell, size=size.auto)
// WaveTrend Oscillator
plotshape(wtoLB and bullishWTI, color=colorBuy, style=shape.labelup, textcolor=#000000, text="WTI", location=location.belowbar, transp=0)
plotshape(wtoLB and bearishWTI, color=colorSell, style=shape.labeldown, textcolor=#ffffff, text="WTI", location=location.abovebar, transp=0)
// VFI
plotshape(vfiLB and bullishVFI, color=colorBuy, style=shape.labelup, textcolor=#000000, text="VFI", location=location.belowbar, transp=0)
plotshape(vfiLB and bearishVFI, color=colorSell, style=shape.labeldown, textcolor=#ffffff, text="VFI", location=location.abovebar, transp=0)
// PSAR
plotshape(inputIndividualSiganlPlot and sp and bullishPSAR, color=colorBuy, style=shape.labelup, textcolor=#000000, text="Sar", location=location.belowbar, transp=0)
plotshape(inputIndividualSiganlPlot and sp and bearishPSAR, color=colorSell, style=shape.labeldown, textcolor=#ffffff, text="Sar", location=location.abovebar, transp=0)
// Leledec
plotshape(inputIndividualSiganlPlot and sL and leledecMajorBearish, color=colorSell, style=shape.labeldown, textcolor=#ffffff, text="Leledec", location=location.abovebar, transp=0)
plotshape(inputIndividualSiganlPlot and sL and leledecMajorBullish, color=colorBuy, style=shape.labelup, textcolor=#000000, text="Leledec", location=location.belowbar, transp=0)
plotshape(min ? (minor==1?low:na) : na, style=shape.diamond, text="Leledec", size=size.tiny, location=location.belowbar, title="Weak Bullish Signals - Leledec", color=colorLime)
plotshape(min ? (minor==-1?high:na) : na, style=shape.diamond, text="Leledec", size=size.tiny, location=location.abovebar, title="Weak Bearish Signals - Leleded", color=colorSell)
// Ichimoku
plot(tenkan, color=iff(sCloud, colorTenkanViolet, na), title="Tenkan", linewidth=2, transp=0)
plot(kijun, color=iff(sCloud, colorKijun, na), title="Kijun", linewidth=2, transp=0)
plot(close, offset = -displacement, color=iff(sCloud, colorLime, na), title="Chikou", linewidth=1)
p1 = plot(senkouA, offset=displacement, color=colorBuy, title="Senkou A", linewidth=3, transp=0)
p2 = plot(senkouB, offset=displacement, color=colorSell, title="Senkou B", linewidth=3, transp=0)
fill(p1, p2, color = senkouA > senkouB ? #1eb600 : colorSell)
plotshape(inputIndividualSiganlPlot and strongBearishSignal, color=colorSell, style=shape.labelup, textcolor=#000000, text="Ichimoku", location=location.abovebar, transp=0)
plotshape(inputIndividualSiganlPlot and strongBullishSignal, color=colorBuy, style=shape.labeldown, textcolor=#ffffff, text="Ichimoku", location=location.belowbar, transp=0)
plotshape(inputNeutralMinorSignals and neutralBullishSignal, style=shape.flag, text="Ichimoku", size=size.small, location=location.belowbar, title="Neutral Bullish Signals - Ichimoku", color=colorLime)
plotshape(inputNeutralMinorSignals and weakBullishSignal, style=shape.diamond, text="Ichimoku", size=size.tiny, location=location.belowbar, title="Weak Bullish Signals - Ichimoku", color=colorLime)
plotshape(inputNeutralMinorSignals and neutralBearishSignal, style=shape.flag, text="Ichimoku", size=size.small, location=location.abovebar, title="Neutral Bearish Signals - Ichimoku", color=colorMaroon)
plotshape(inputNeutralMinorSignals and weakBearishSignal, style=shape.diamond, text="Ichimoku", size=size.tiny, location=location.abovebar, title="Weak Bearish Signals - Ichimoku", color=colorMaroon)
// AMA
plotshape(inputIndividualSiganlPlot and inputAma and amaLongConditionEntry, color=colorBuy, style=shape.labelup, textcolor=#000000, text="AMA", location=location.belowbar, transp=0)
plotshape(inputIndividualSiganlPlot and inputAma and amaShortConditionEntry, color=colorSell, style=shape.labeldown, textcolor=#ffffff, text="AMA", location=location.abovebar, transp=0)
// RMO
plotshape(inputIndividualSiganlPlot and sRMO and rahulMohindarOscilllatorLongEntry, color=colorBuy, style=shape.labelup, textcolor=#000000, text="RMO", location=location.belowbar, transp=0)
plotshape(inputIndividualSiganlPlot and sRMO and rahulMohindarOscilllatorShortEntry, color=colorSell, style=shape.labeldown, textcolor=#ffffff, text="RMO", location=location.abovebar, transp=0)
// TD
plot(sTD and SR?(TDbuyh ? TDbuyl: na):na,style=circles, linewidth=1, color=red)
plot(sTD and SR?(TDselll ? TDsellh : na):na,style=circles, linewidth=1, color=lime)
barColour = sell? tdSell : buy? tdBuy : sellovershoot? tdSellOvershoot : sellovershoot1? tdSellOvershoot1 : sellovershoot2?tdSellOverShoot2 : sellovershoot3? tdSellOverShoot3 : buyovershoot? tdBuyOverShoot : buyovershoot1? tdBuyOvershoot1 : buyovershoot2? tdBuyOverShoot2 : buyovershoot3? tdBuyOvershoot3 : na
barcolor(color=barColour, title ="TD Sequential Bar Colour")
// ****************************************BUY/SELL Signal ***************************************************************
bull = leledecMajorBullish or bullishPSAR or strongBullishSignal or amaLongConditionEntry or rahulMohindarOscilllatorLongEntry or bullishVFI
bear = leledecMajorBearish or bearishPSAR or strongBearishSignal or amaShortConditionEntry or rahulMohindarOscilllatorShortEntry or bearishVFI
if bull
persistent_bull := 1
persistent_bear := 0
if bear
persistent_bull := 0
persistent_bear := 1
plotshape(bull and persistent_bull[1] != 1, style=shape.labelup, location=location.belowbar, color=colorBuy, text="Buy", textcolor=#000000, transp=0)
plotshape(bear and persistent_bear[1] != 1, style=shape.labeldown, color=colorSell, text="Sell", location=location.abovebar, textcolor =#ffffff, transp=0)
// ****************************************Alerts***************************************************************
// For global buy/sell
alertcondition(bull and persistent_bull[1] != 1, title='Buy', message='Buy')
alertcondition(bear and persistent_bear[1] != 1, title='Sell', message='Sell')
// Strategy
longCondition = leledecMajorBullish or bullishPSAR or strongBullishSignal or amaLongConditionEntry or rahulMohindarOscilllatorLongEntry or bullishVFI
closeLongCondition = leledecMajorBearish or bearishPSAR or strongBearishSignal or amaShortConditionEntry or rahulMohindarOscilllatorShortEntry or bearishVFI
monthfrom =input(1)
monthuntil =input(12)
dayfrom=input(1)
dayuntil=input(31)
yearfrom=input(2017)
yearuntil=input(2020)
leverage=input(1)
if (longCondition )
strategy.entry("Long", strategy.long, leverage, comment="Enter Long")
else
strategy.close("Long", when=closeLongCondition)
//if (closeLongCondition and month>=monthfrom and month <=monthuntil and dayofmonth>=dayfrom and dayofmonth <= dayuntil and year <= yearuntil and year>=yearfrom)
// strategy.entry("Short", strategy.short, leverage, comment="Enter Short")
//else
// strategy.close("Short", when=longCondition)