
この戦略は,移動平均,振動指数などの複数の技術指標を活用し,均線横断の形状と組み合わせて,株価の傾向と下落の転換点を識別し,買付を行う.
この戦略は以下の部分に構成されています.
選択区間:K線図の時間区間の分数,例えば1分,5分など.
移動平均を選択:一般的なEMA,SMAなどの移動平均のパラメータ,例えば10日線,20日線などを配置する.
震動指標を選択:RSI,MACD,ウィリアム指数などの震動指標のパラメータを設定する.
買出信号の計算: カスタマイズされた関数を使って,移動平均と振動指数の数値を計算する. 短期平均線上を長期平均線を越えたときに買出信号が生じる; 短期平均線下を長期平均線を越えたときに売出信号が生じる. 同時に,超買超売指数と組み合わせて極限点を識別する.
評価システム:各指標の買出信号を数値的に打つ.それから平均を取って,全体的な評価指数が得られる.評価指数は0より大きいのは買出信号で,0より小さいのは売出信号である.
取引シグナル:評価指数0以上または以下で最終的な取引シグナルを生成し,買取または販売操作を行う.
この戦略は,複数の指標を組み合わせて,価格の傾向とターニングポイントを効果的に識別し,信号の信頼性を高めます.均線通過は,行が有効なトレンド技術信号であり,震動指標と組み合わせると,偽突破を避けるのに役立ちます.評価システムは,取引信号をより明確にする.
リスクは以下の方法で軽減できます.
この戦略は,以下の点でさらに最適化できます.
概要として,この戦略は平均線突破と複数の指標を統合して,価格動向を効果的に識別することができる.しかし,継続的にテストして最適化し,リスクを制御する必要がある.将来,ポートフォリオの選択株,パラメータの最適化,止損の面で改善することができる.
この戦略は均線横断を主要取引シグナルとし,複数の震動指標で補足され,スコアシステムを使用して明確な買出シグナルを生成する.価格の傾向と転換点を効果的に識別することができるが,取引頻度を制御し,取引コストとリスクを削減し,またパラメータを継続的に最適化する必要がある.一定の実用価値と改善の余地がある.
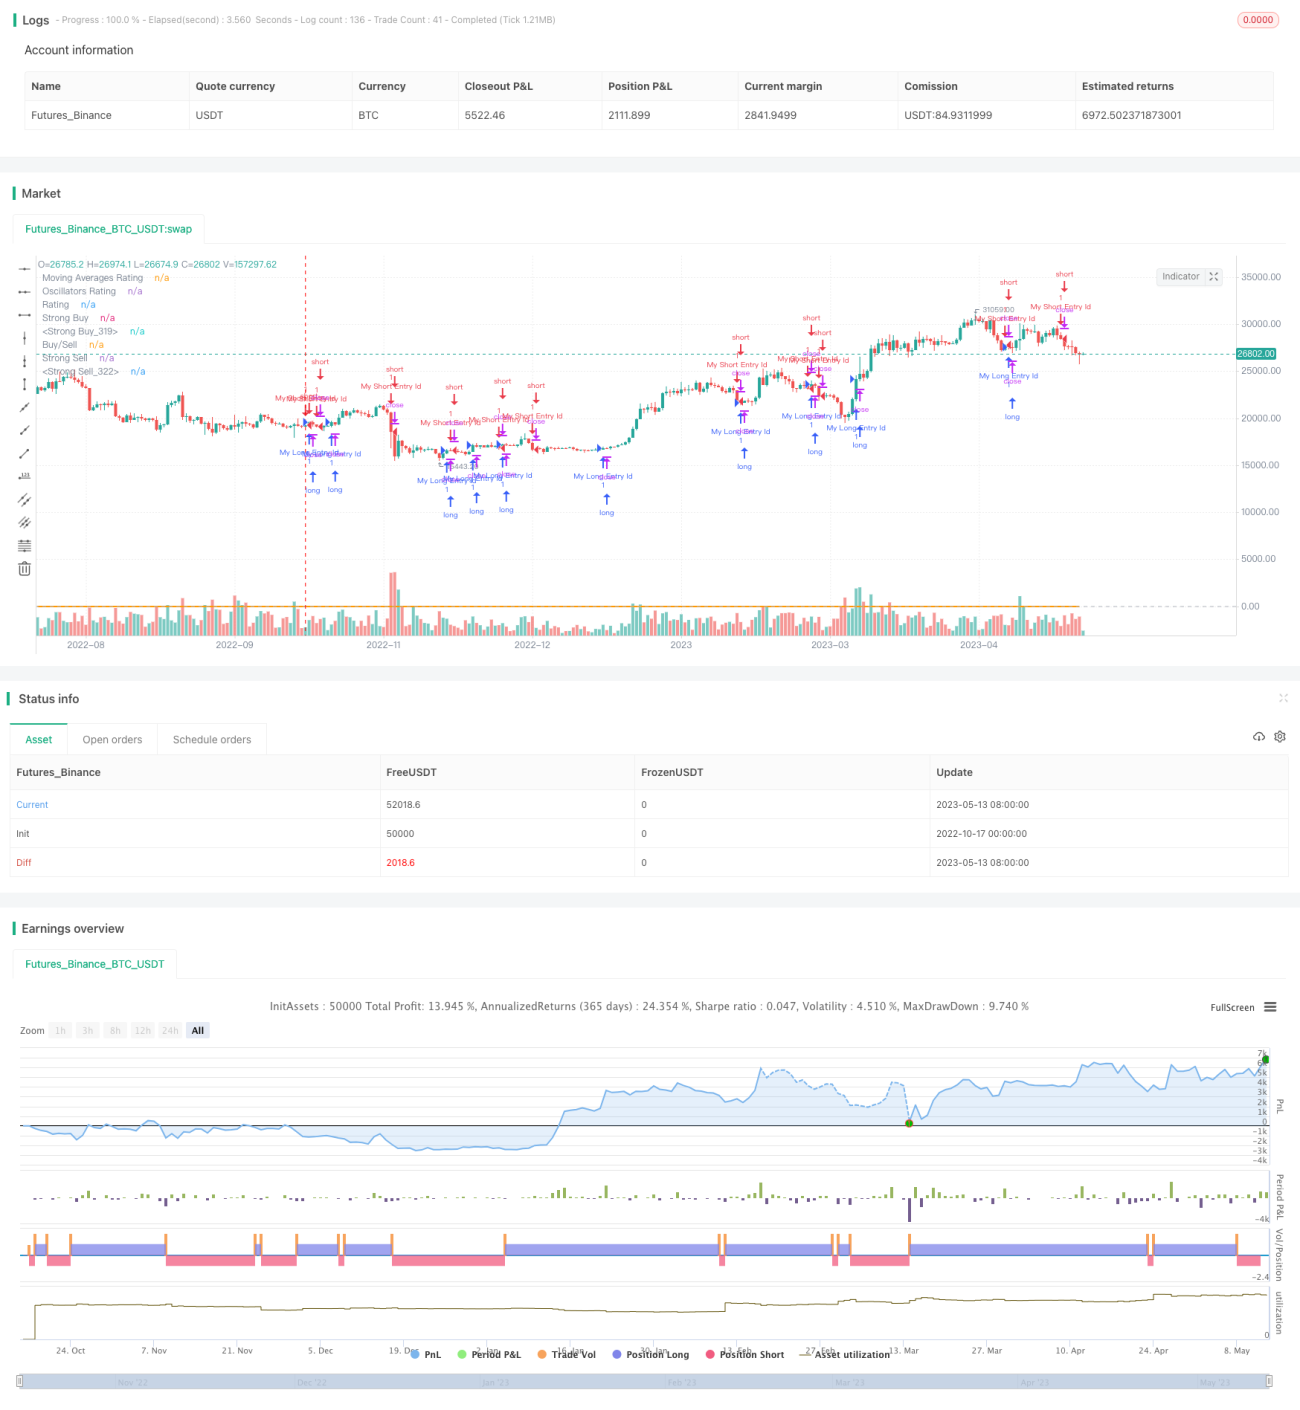
/*backtest
start: 2022-10-17 00:00:00
end: 2023-05-14 00:00:00
period: 1d
basePeriod: 1h
exchanges: [{"eid":"Futures_Binance","currency":"BTC_USDT"}]
*/
//@version=4
strategy("TV Signal", overlay=true, initial_capital = 500, currency = "USD")
// -------------------------------------- GLOBAL SELECTION --------------------------------------------- //
//res = input(defval="5" , title="resolution " , type=resolution)
res_num = input("240", title="Resolution (minutes)", options=["1", "5", "15", "60", "240"] )
res = res_num
src = close
// -----------------------------------MOVING AVERAGES SELECTION----------------------------------------- //
// EMAS input
ema10 = 10
ema20 = 20
ema30 = 30
ema50 = 50
ema100 = 100
ema200 = 200
// SMAS input
sma10 = 10
sma20 = 20
sma30 = 30
sma50 = 50
sma100 = 100
sma200 = 200
// Ichimoku - is not active in the calculation brought to you by TV TEAM for the lolz
// VWMA
vwma20 = 20
// Hull
hma9 = 9
// -----------------------------------OSCILLATORS SELECTION----------------------------------------- //
//RSI
rsi_len = input(14, minval=1, title="RSI Length")
//STOCH K
stoch_k = input(14, minval=1, title="STOCH K")
stoch_d = input(3, minval=1, title="STOCH D")
stoch_smooth = input(3, minval=1, title="STOCH Smooth")
//CCI
cci_len = input(20, minval=1, title="CCI Length")
//Momentum
momentum_len = input(10, minval=1, title="Momentum Length")
//MACD
macd_fast = input(12, title="MACD fast")
macd_slow = input(27, title="MACD slow")
//ADX
adxlen = input(14, title="ADX Smoothing")
dilen = input(14, title="DI Length")
//BBP
bbp_len = input(13, title="BBP EMA Length")
//William Percentage Range
wpr_length = input(14, minval=1, title="William Perc Range Length")
//Ultimate Oscillator
uo_length7 = input(7, minval=1, title="UO Length 7"), uo_length14 = input(14, minval=1, title="UO Length 14"), uo_length28 = input(28, minval=1, title="UO Length 28")
// -------------------------------------- FUNCTIONS - Moving Averages -------------------------------------- //
// Simple Moving Averages Calculation Function - SELL indicator values < price // BUY – indicator values > price
calc_sma_index(len, src, res) =>
sma_val = request.security(syminfo.tickerid, res, sma(src, len))
sma_index = if( sma_val > close )
-1
else
1
sma_index
// Exponential Moving Averages Calculation Function - SELL indicator values < price // BUY – indicator values > price
calc_ema_index(len, src, res) =>
ema_val = request.security(syminfo.tickerid, res, sma(src, len))
ema_index = if( ema_val > close )
-1
else
1
ema_index
// Hull Moving Averages Calculation Function - SELL indicator values < price // BUY – indicator values > price
calc_hull_index(len, src, res) =>
hull_val = request.security(syminfo.tickerid, res, wma(2*wma(src, len/2)-wma(src, len), round(sqrt(len))))
hull_index = if( hull_val > close )
-1
else
1
hull_index
// VW Moving Averages Calculation Function - SELL indicator values < price // BUY – indicator values > price
calc_vwma_index(len, src, res) =>
vwma_val = request.security(syminfo.tickerid, res, vwma(src, len))
vwma_index = if( vwma_val > close )
-1
else
1
vwma_index
// -------------------------------------- FUNCTIONS - Oscillators -------------------------------------- //
// RSI indicator < lines that represent oversold conditions(70) and indicator values are rising = -1
// RSI indicator > lines that represent overbought conditions(30) and indicator values are falling = +1
calc_rsi_index(len, src, res) =>
up = rma(max(change(src), 0), len)
down = rma(-min(change(src), 0), len)
rsi = down == 0 ? 100 : up == 0 ? 0 : 100 - (100 / (1 + up / down))
rsi_res = request.security(syminfo.tickerid, res, rsi)
rsi_change = rsi_res - rsi_res[1]
rsi_index = 0
if( rsi_res > 70 and rsi_change < 0 )
rsi_index := -1
if( rsi_res < 30 and rsi_change > 0 )
rsi_index := 1
rsi_index
// STOCH indicator – main line < lower band (20) and main line crosses the signal line from bottom-up
// STOCH indicato – main line > upper band (80) and main line crosses the signal line from above-down
calc_stoch_index(len_k, len_d, smoothK, res) =>
stoch_k = sma(stoch(close, high, low, len_k), smoothK)
stoch_d = sma(stoch_k, len_d)
res_stoch_k = request.security(syminfo.tickerid, res, stoch_k)
res_stoch_d = request.security(syminfo.tickerid, res, stoch_d)
spread = (res_stoch_k/res_stoch_d -1)*100
stoch_index = 0
if( res_stoch_k > 80 and spread < 0 )
stoch_index := -1
if( res_stoch_k < 20 and spread > 0 )
stoch_index := 1
stoch_index
// CCI indicator – indicator < oversold level (-100) and reversed upwards
// CCI indicator – indicator > overbought level (100) and reversed downwards
calc_cci_index(len, src, res) =>
cci_ma = sma(src, len)
cci = (src - cci_ma) / (0.015 * dev(src, len))
cci_res = request.security(syminfo.tickerid, res, cci)
cci_change = cci_res - cci_res[1]
cci_index = 0
if( cci_res > 100 and cci_change > 0 )
cci_index := -1
if( cci_res < -100 and cci_change < 0 )
cci_index := 1
cci_index
//AWESOME OSCILLATOR – saucer and values are greater than 0 or zero line cross from bottom-up - BUY
//AWESOME OSCILLATOR – saucer and values are lower than 0 or zero line cross from above-down - SELL
calc_awesome_index(src, res) =>
ao = sma(hl2,5) - sma(hl2,34)
ao_res = request.security(syminfo.tickerid, res, ao)
ao_change = ao_res - ao_res[1]
ao_index = 0
if( ao_res > 0 and ao_change > 0 )
ao_index := 1
if( ao_res < 0 and ao_change < 0 )
ao_index := -1
ao_index
// Momentum indicator - indicator values are rising - BUY
// Momentum indicator - indicator values are falling - SELL
calc_momentum_index(len, src, res) =>
mom = src - src[len]
res_mom = request.security(syminfo.tickerid, res, mom)
mom_index = 0
if res_mom>= 0
mom_index := 1
if res_mom <= 0
mom_index := -1
mom_index
// MACD - main line values > signal line values - BUY
// MACD - main line values < signal line values - SELL
calc_macd_index(macd_fast, macd_slow, src, res) =>
macd = ema(src, macd_fast) - ema(src, macd_slow)
res_macd = request.security(syminfo.tickerid, res, macd)
macd_index = 0
if res_macd>= 0
macd_index := 1
if res_macd <= 0
macd_index := -1
macd_index
//STOCHRSI - main line < lower band (20) and main line crosses the signal line from bottom-up
//STOCHRSI - main line > upper band (80) and main line crosses the signal line from above-down
calc_stochrsi_index(len_rsi, len_stoch, smoothK, smoothD, src, res) =>
rsi = rsi(src, len_rsi)
stoch_k = sma(stoch(rsi, rsi, rsi, len_stoch), smoothK)
stoch_d = sma(stoch_k, smoothD)
res_stoch_k = request.security(syminfo.tickerid, res, stoch_k)
res_stoch_d = request.security(syminfo.tickerid, res, stoch_d)
spread = (res_stoch_k/res_stoch_d -1)*100
stochrsi_index = 0
if( res_stoch_k > 80 and spread < 0 )
stochrsi_index := -1
if( res_stoch_k < 20 and spread > 0 )
stochrsi_index := 1
stochrsi_index
//Williams % Range - line is above -20 and values are dropping - Overbough conditions - SELL
//Williams % Range - line is below -80 and values are rising - Oversold conditions - BUY
calc_wpr_index(len, src, res) =>
wpr_upper = highest(len)
wpr_lower = lowest(len)
wpr = 100 * (src - wpr_upper) / (wpr_upper - wpr_lower)
wpr_res = request.security(syminfo.tickerid, res, wpr)
wpr_change = wpr_res - wpr_res[1]
wpr_index = 0
if( wpr_res < -80 and wpr_change > 0 )
wpr_index := 1
if( wpr_res > -20 and wpr_change < 0 )
wpr_index := -1
wpr_index
//Ultimate Oscillator - line is above -20 and values are dropping - Overbough conditions - SELL
//Ultimate Oscillator - line is below -80 and values are rising - Oversold conditions - BUY
average(bp, tr_, length) => sum(bp, length) / sum(tr_, length)
calc_uo_index(len7, len14, len28, res) =>
high_ = max(high, close[1])
low_ = min(low, close[1])
bp = close - low_
tr_ = high_ - low_
avg7 = average(bp, tr_, len7)
avg14 = average(bp, tr_, len14)
avg28 = average(bp, tr_, len28)
uo = 100 * (4*avg7 + 2*avg14 + avg28)/7
uo_res = request.security(syminfo.tickerid, res, uo)
uo_index = 0
if uo_res >= 70
uo_index := 1
if uo_res <= 30
uo_index := -1
uo_index
//Average Directional Index - indicator > 20 and +DI line crossed -DI line from bottom-up
//Average Directional Index - indicator > 20 and +DI line crossed -DI line from above-down
dirmov(len) =>
up = change(high)
down = -change(low)
truerange = rma(tr, len)
plus = fixnan(100 * rma(up > down and up > 0 ? up : 0, len) / truerange)
minus = fixnan(100 * rma(down > up and down > 0 ? down : 0, len) / truerange)
[plus, minus]
adx(dilen, adxlen) =>
[plus, minus] = dirmov(dilen)
sum = plus + minus
adx = 100 * rma(abs(plus - minus) / (sum == 0 ? 1 : sum), adxlen)
adxHigh(dilen, adxlen) =>
[plus, minus] = dirmov(dilen)
plus
adxLow(dilen, adxlen) =>
[plus, minus] = dirmov(dilen)
minus
calc_adx_index(res) =>
sig = adx(dilen, adxlen) //ADX
sigHigh = adxHigh(dilen, adxlen) // DI+
sigLow = adxLow(dilen, adxlen) // DI-
res_sig = request.security(syminfo.tickerid, res, sig)
res_sigHigh = request.security(syminfo.tickerid, res, sigHigh)
res_sigLow = request.security(syminfo.tickerid, res, sigLow)
spread = (res_sigHigh/res_sigLow -1)*100
adx_index = 0
if res_sig >= 20 and spread > 0
adx_index := 1
if res_sig >= 20 and spread < 0
adx_index := -1
adx_index
//Bull Bear Power Index - bear power is below 0 and is weakening -> BUY
//Bull Bear Power Index - bull power is above 0 and is weakening -> SELL
calc_bbp_index(len, src, res ) =>
ema = ema(src, len)
bulls = high - ema
bears = low - ema
bulls_res = request.security(syminfo.tickerid, res, bulls)
bears_res = request.security(syminfo.tickerid, res, bears)
sum = bulls_res + bears_res
bbp_index = 0
if bears_res < 0 and bears_res > bears_res[1]
bbp_index := 1
if bulls_res > 0 and bulls_res < bulls_res[1]
bbp_index := -1
bbp_index
// --------------------------------MOVING AVERAGES CALCULATION------------------------------------- //
sma10_index = calc_sma_index(sma10, src, res)
sma20_index = calc_sma_index(sma20, src, res)
sma30_index = calc_sma_index(sma30, src, res)
sma50_index = calc_sma_index(sma50, src, res)
sma100_index = calc_sma_index(sma100, src, res)
sma200_index = calc_sma_index(sma200, src, res)
ema10_index = calc_ema_index(ema10, src, res)
ema20_index = calc_ema_index(ema20, src, res)
ema30_index = calc_ema_index(ema30, src, res)
ema50_index = calc_ema_index(ema50, src, res)
ema100_index = calc_ema_index(ema100, src, res)
ema200_index = calc_ema_index(ema200, src, res)
hull9_index = calc_ema_index(hma9, src, res)
vwma20_index = calc_ema_index(vwma20, src, res)
ichimoku_index = 0.0 //Ichimoku - is not active in the calculation brought to you by TV TEAM for the lolz
moving_averages_index = ( ema10_index + ema20_index + ema30_index + ema50_index + ema100_index + ema200_index +
sma10_index + sma20_index + sma30_index + sma50_index + sma100_index + sma200_index +
ichimoku_index + vwma20_index + hull9_index ) / 15
// -----------------------------------OSCILLATORS CALCULATION----------------------------------------- //
rsi_index = calc_rsi_index(rsi_len, src, res)
stoch_index = calc_stoch_index(stoch_k, stoch_d, stoch_smooth, res)
cci_index = calc_cci_index(cci_len, src, res)
ao_index = calc_awesome_index(src, res)
mom_index = calc_momentum_index(momentum_len, src, res)
macd_index = calc_macd_index(macd_fast, macd_slow, src, res)
stochrsi_index = calc_stochrsi_index(rsi_len, stoch_k, stoch_d, stoch_smooth, src, res)
wpr_index = calc_wpr_index(wpr_length, src, res)
uo_index = calc_uo_index(uo_length7, uo_length14, uo_length28, res)
adx_index = calc_adx_index(res)
bbp_index = calc_bbp_index(bbp_len , src, res)
oscillators_index = ( rsi_index + stoch_index + adx_index + cci_index + stochrsi_index + ao_index + mom_index + macd_index + wpr_index + uo_index + bbp_index ) / 11
rating_index = ( moving_averages_index + oscillators_index ) / 2
plot(moving_averages_index, color=green, linewidth = 1, title="Moving Averages Rating",transp = 70)
plot(oscillators_index , color=blue, linewidth = 1, title="Oscillators Rating",transp = 70)
plot(rating_index , color=orange, linewidth = 2, title="Rating")
strongbuy = hline(1, "Strong Buy" , color=silver )
buy = hline(0.5, "Strong Buy" , color=green )
normal = hline(0, "Buy/Sell" , color=silver )
sell = hline(-0.5,"Strong Sell", color=red )
strongsell = hline(-1, "Strong Sell", color=silver )
fill(strongbuy,buy, color=green, transp=90)
fill(buy,normal, color=#b2ffb2, transp=90)
fill(sell,normal, color=#F08080, transp=90)
fill(strongsell,sell, color=red, transp=90)
longCondition = rating_index > 0
if (longCondition)
strategy.entry("My Long Entry Id", strategy.long)
shortCondition = rating_index < 0
if (shortCondition)
strategy.entry("My Short Entry Id", strategy.short)