月間トレンドブレイクアウト戦略

概要
月間トレンドブレイクストラテジー (月間トレンドブレイクストラテジー) は,ピンスクリプトベースのTradingView指標である.この戦略は,自主的な移動平均,トレンドラインブレイク,およびRSI指標の組み合わせを使用して,月に一度だけ多頭入場のタイミングを決定する.RSI指標がオーバーバイを示したときに平仓退出する.
戦略原則
-
lastEntryMonthの変数を定義して,最後のEntryMonthを記録し,現在のMonthを取得します.
-
TRAMAを移動平均のパラメータ length=99 に適応するように設定し,価格を平らにし,トレンドの方向を判断する.
-
参数 length_trend=14 を設定し,高点のトレンドライン upper を描きます. 価格がトレンドラインを上方から越えたとき,突破として判断します.
-
RSI指標のパラメータrsiLength=14を計算して,超買超売を判断する.
-
入場論理:閉盤価格がTRAMAより高く,閉盤価格が軌道上を突破したときに,先月入場しなかった場合は,追加入場を行う.
-
出場論理: RSIが70以上になると平仓する.
-
TRAMA曲線,RSIの超買い線を描き,戦略を完了する.
この戦略は,3つの主要な技術指標を統合して,トレンド,モメンタム,オーバーバイ・オーバーセルの状況を判断し,毎月1回だけより低いリスクの多くを行う機会を探します. 同時に,価格が上昇傾向を突破したときにのみ入場することを制限し,収束区間での無効操作を回避します.
優位分析
-
複数の指標の組み合わせにより,市場の状況を総合的に判断し,意思決定の正確性を向上させる.
-
月間時間枠を突破した時にのみ入場し,頻繁に取引を避ける.
-
移動平均の自律的な動向は,トレンドの方向を判断し,転換を迅速に捉えることができます.
-
超買い指数と組み合わせて市場の高値を回避し,リスクを効果的にコントロールする.
-
簡単な,直感的な入場・出場条件で,簡単に把握できます.
-
戦略を最適化するために,必要なパラメータを調整できます.
リスク分析
-
突破の失敗によるwhipsawリスク.入場後,価格が再び上位に下がり,損失を招く可能性があります.
-
トレンドの突破点での選択は不良で,トップに近い高位での入場を選択する.
-
指数パラメータの設定が不適切で,指数が誤導信号を生成する.
-
突破のみ Reflect recent market volatility. 適応的なストップ/ポジションサイジングを考慮する
-
Monitor risk/reward. Consider only trading pullbacks or adding other confirmation filters.
-
Validate indicators on multiple timeframes. Use higher timeframes to identify trend and lower for entry.
-
Backtest over different market conditions. Optimize parameters to match strategy to market type.
最適化の方向
-
Volume,MAの取引量指標の確認を追加し,低量の偽突破を避ける.
-
RSIが平定ポジションを上回る時,部分的利益のストップを考慮し,残りを保有してください.
-
移動平均のパラメータを最適化し,変化に適応し,トレンド変換をよりよく追跡する.
-
突破点の前後に区画を設け,ターニングポイントの高位から直接入場を避ける.
-
経路指標,波動率指標などのフィルタリング条件を追加し,意思決定の正確性を向上させる.
-
順位入場,価格が新増強レジスタンスラインを突破し続けると,加仓することができる.
要約する
月間トレンドブレイク戦略は,トレンド,エネルギー,限界状態などの複数の要因を総合的に考慮します. 月間時間枠でトレンドの方向性を判断し,より低い時間枠のブレイク実行入場を組み合わせます. 同時に,RSI指標を有効に使用して取引リスクを制御します. この戦略は,毎月1回に優位な機会を多く行うための単純な論理で探します. それは,トレンド追跡を考慮するとともに,リスク管理を重視します.
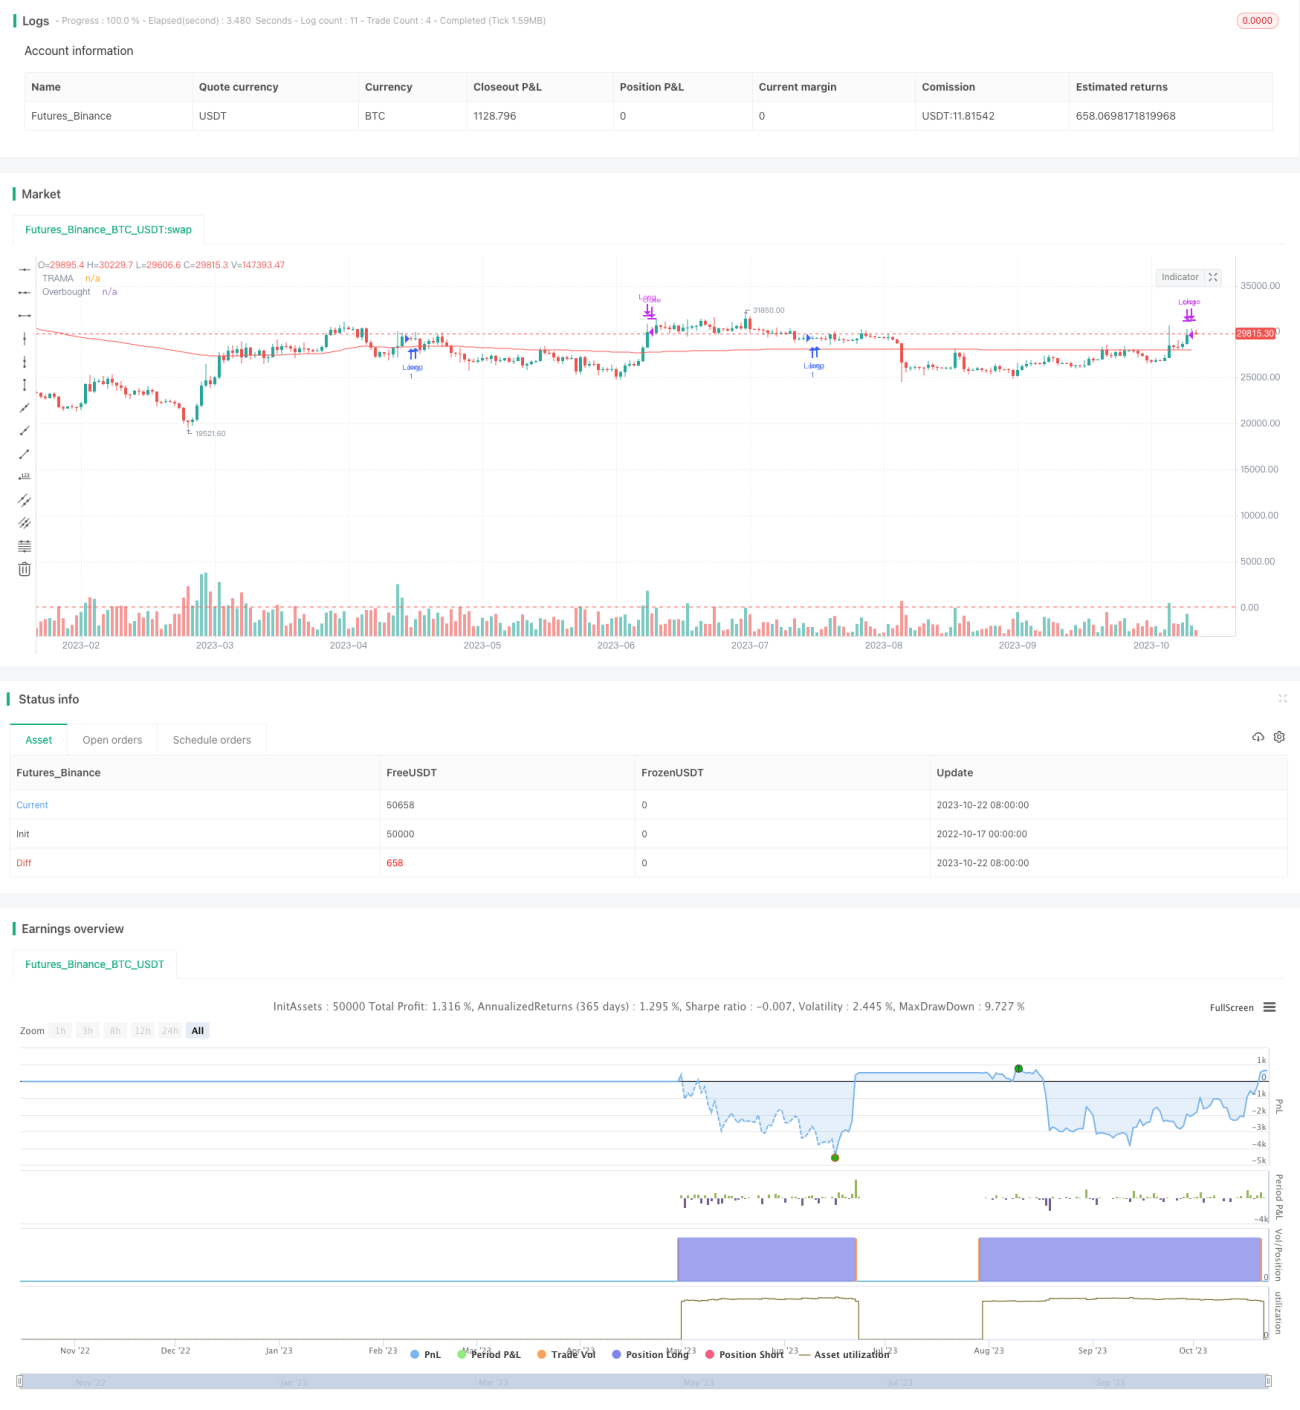
/*backtest
start: 2022-10-17 00:00:00
end: 2023-10-23 00:00:00
period: 1d
basePeriod: 1h
exchanges: [{"eid":"Futures_Binance","currency":"BTC_USDT"}]
*/

//@version=5
strategy('Bannos Strategy', shorttitle='Bannos', overlay=true)

//The provided script is an indicator for TradingView written in Pine Script version 5. The indicator is used to determine entry and exit points for a trading strategy. Here's a detailed breakdown of what the script does:- 1