ブレイクアウト トレーリング ストップ V2 戦略

概要
この戦略は,ブレイク戦略とトレンド追跡ストップ戦略の優位性を組み合わせて,ロングライングラフのサポートレジスタンスブレイク信号を捕捉し,移動平均を利用してストップトラッキングを行い,ロングライントレンドの方向で利益を得ながらもリスクを制御することを目的としています.
戦略原則
-
戦略は,まず,トレンド判断,サポートレジスタンス,ストップダメージトラッキングとして使用される複数の異なるパラメータの移動平均を計算します.
-
そして,指定された周期内の最高点と最低点を,入場するサポート・レジスタンス領域として見つけます. 価格がこれらのサポート・レジスタンスを突破すると,シグナルが作られます.
-
策略は,突破高点で多信号に買い,突破低点で空信号に売る.
-
入場後,突破最低点の低点をストップ損失位としてポジションを保持する.
-
ポジションが利益状態に入ると,ストップ・ロスは移動平均を追跡する.価格が移動平均を下回ると,ストップ・ロスは,このルートK線の最低点に設定する.
-
取引先が取引先の取引を監視し,取引先の取引先の取引を監視する.
-
策略は同時に平均の実際の波動を加えることで,適切な区間でのみ突破買いを確実にするため,過度な拡大の突破を避ける.
戦略的優位分析
-
突破戦略とトレンド追跡戦略を組み合わせたストップ・ロスの二重の利点.
-
長期トレンドで突破買いをすることで,利益の確率を高めることができます.
-
ストップ・ロスの戦略は,ポジションを保護するだけでなく,ポジションに十分なスペースを与えます.
-
波動率のフィルタを加え,過度の上昇を避ける不利な突破を避ける.
-
自動取引は,時折の請求書に適しています.
-
異なる周期平均線の操作をカスタマイズできます.
-
ストップダストトラッキングは柔軟に調整できます.
戦略的リスク分析
-
突破策は偽突破の危険性がある. 突破確認は適切に緩やかである.
-
突破シグナルを生成するには十分な波動が必要で,逆転の状況では無効にされやすい.
-
突破口のいくつかは 捉え難いほどに短く, タイムラインを下げて チャンスを探すこともできます.
-
追跡ストップは,震動の状況で頻繁にストップすることがあります. ストップ距離を適切に緩めることができます.
-
波動率のフィルタリングは,いくつかのチャンスを逃す可能性があります.フィルタリングパラメータを下げることができます.
戦略最適化の方向性
-
異なる均線参数組をテストして,最適な参数を見つけます.
-
経路,K線形など,さまざまな突破確認機構をテストする.
-
ストップ・トラッキングの様々な方法を試して,最適のストップ・トラッキングを探してください.
-
資金管理戦略の最適化,ポジトンスコアなど
-
統計技術指標のフィルタリングが加えられ,フィルタリングの精度が向上する.
-
この戦略の効果を様々な品種でテストする.
-
戦略の効果を高めるために,機械学習アルゴリズムを組み込む.
要約する
この戦略は,突破思考とトレンド追跡のストップ思考を統合し,長線を正しく判断した前提で,利益の空間を最適化することができる. 鍵は,最適なパラメータの組み合わせを見つけ,良き資金管理戦略と連携して,長線の機会を掴むと同時に,リスクを制御できるようにすることである. この戦略は,さらなる最適化によって,より信頼性の高い長線のトレンド戦略になる見込みである.
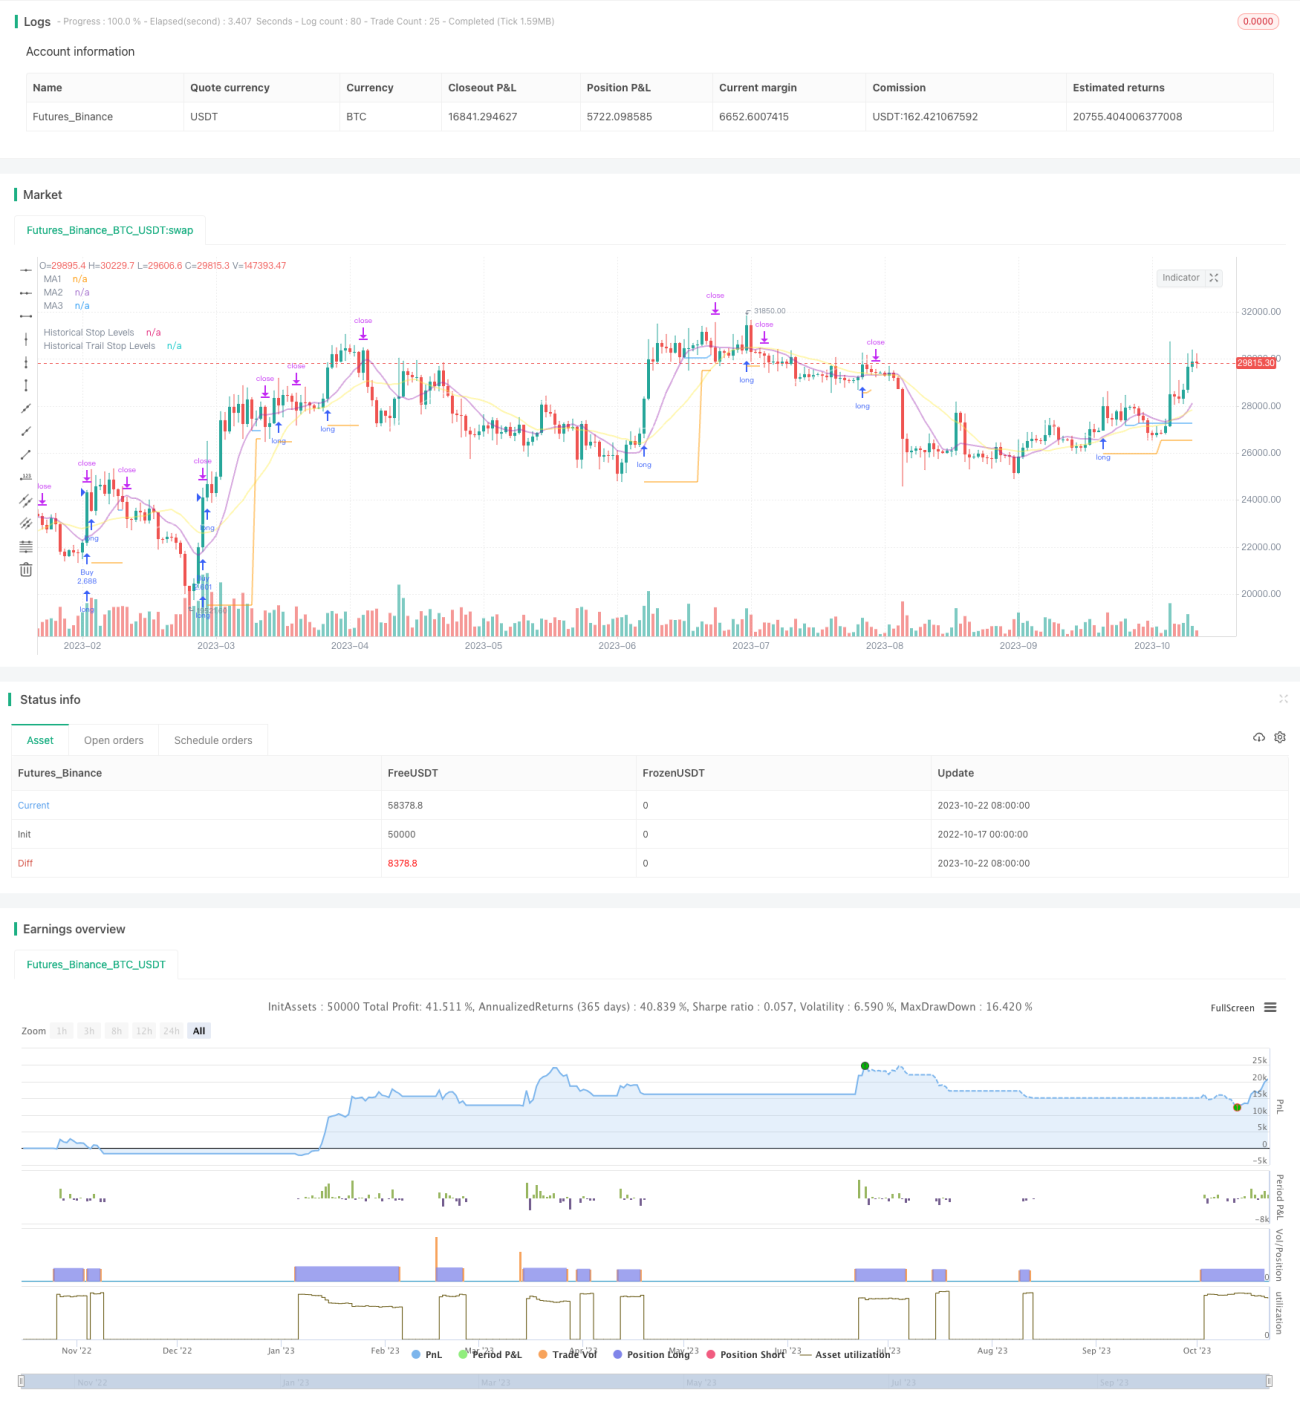
/*backtest
start: 2022-10-17 00:00:00
end: 2023-10-23 00:00:00
period: 1d
basePeriod: 1h
exchanges: [{"eid":"Futures_Binance","currency":"BTC_USDT"}]
*/

// This source code is subject to the terms of the Mozilla Public License 2.0 at https://mozilla.org/MPL/2.0/
// © millerrh

// The intent of this strategy is to buy breakouts with a tight stop on smaller timeframes in the direction of the longer term trend.- 1