双方向バンドフィルタリング戦略

[trans]
概要
双面波段フィルタリング戦略は,ブロードが2010年にブロード株式と商品<unk>誌で発表した記事を基に改訂された戦略である. この戦略は,ブロード波段フィルタルの数値を計算し,株式価格の変動を認識し,取引信号を与える.ブロード波段フィルタルの数値が<unk>値より高いときは見下し,<unk>値より低いときは見多し,トレンドフォローを実現する.
戦略原則
この戦略は以下のステップで構成されています.
-
初期化パラメータ: ブロードバンド長を含む
Length波動系数についてDelta余剰余剰の値が下がったSellZone複数の区間の<unk>値を見るBuyZone待って。 -
ブロードバンドフィルタを計算する
BP: 波段フィルターの値を,一連の三角関数で計算する。 -
ポジションの方向を判断する:
BPより高いSellZone値が0より低い場合はBuyZoneポジションを維持する. -
出力シグナル:保有方向に合わせて多空シグナルを出力する.
-
Kラインの色を描く:信号結果に応じてKラインの色を設定する.
-
波段フィルター曲線を描画する.
この戦略は,市場における短期的な波動をブロードバンドフィルターで捕捉し,波動が一定の幅に達したときに取引シグナルを生成し,市場動向に従って取引する.
優位分析
-
ブロードバンドフィルターにより,市場の波動に敏感になり,短期的なトレンドを捉えることができます.
-
パラメータの最適化により,波動に対する感度が調整され,異なる市場環境に適応できます.
-
戦略の論理はシンプルで明快で,実行が分かりやすい.
-
パラメータを簡単に調整し,最適なパラメータの組み合わせを探します.
-
視覚化された波段フィルター曲線,市場波動を直感的に表示する.
リスク分析
-
ブロードバンドフィルターは,過度に最適化すると過度に敏感になり,誤った信号を生成する可能性があります.
-
波動の終点が特定できないため,損失が拡大する可能性があります.
-
取引の頻度が高くなり,取引コストや滑り場リスクが増加する可能性があります.
-
突発的な事件の影響を受けやすいため,誤信号が生成される.
-
異なる品種と市場環境に対応するためにパラメータを適切に調整する必要があります.
-
単一損失をコントロールするために,ストップ・ロスを設定することも考えられます.
-
適切な出場時間を延長するか,誤信号を減らすためにフィルタリング条件を使用する.
最適化の方向
-
パラメータを最適化して,最適なパラメータ組み合わせを見つける.最適化の目標は,勝率,損益率,シャープ比率などの指標を考慮することができる.
-
フィルタリング条件を追加します.例えば,平均線や価格パターンを突破し,トレンド外での取引を避けるようにします.
-
複数の指標を組み合わせたパラメータの組み合わせを考慮してバスケット取引を行い,一方的なリスクを分散する.
-
ストップロジックを追加し,単一損失を制御する. ダイナミックストップまたは追跡ストップを考慮することができます.
-
モバイルストップを追加し,プロフィートをロックします. トレンドの段階に応じて異なるストップ位置を設定することもできます.
-
入場シグナルを最適化して,波動的な市場での誤信号を避ける. ポジション保持周期を延長したり,入場シグナルとして価格突破を設定することも考えられます.
-
品種間の価格差をカバーする多品種アベレージシステムに拡張.
-
採集と最適化,最良の品種選択と採集戦略
要約する
双方向波段フィルタリング戦略は,価格変動の強さを判断するブロードバンドフィルターを計算し,波動が<unk>値に達したときに取引信号を生成し,市場短期トレンドに対する高い感受性を持ち,簡単に実現する利点があります.しかし,この戦略はパラメータと取引頻度に敏感であり,誤信号を減らすために適切な最適化が必要であり,リスクを制御します.全体的に,この戦略は,短期トレンドを捕捉するためのオプションを提供していますが,最適化の問題を警戒し,他の技術指標と適切に連携して取引する必要があります.
||
Overview
The Dual Bandpass Filter strategy is adapted from the strategy published by Broder in Stocks & Commodities magazine in 2010. It generates trading signals by calculating the value of Broder's bandpass filter to identify price fluctuations in stocks. It goes short when the bandpass filter value is higher than the threshold, and goes long when it is lower, to follow the trend.
Strategy Logic
The key steps of this strategy are:
-
Initialize parameters including bandpass length
Length, fluctuation coefficientDelta, short zone thresholdSellZone, and long zone thresholdBuyZone. -
Calculate the Broder bandpass filter
BPusing a series of trigonometric functions. -
Determine position direction: go short if
BPis aboveSellZone; go long if belowBuyZone; otherwise, maintain current position. -
Output signals: generate long/short signals based on position direction.
-
Set bar colors based on signal results.
-
Plot the bandpass filter curve.
This strategy captures short-term fluctuations using the Broder bandpass filter, and generates trading signals when the fluctuations reach certain magnitude to follow the trend.
Advantage Analysis
-
More sensitive to market fluctuations based on the Broder bandpass filter, which can catch short-term trends.
-
The sensitivity can be adjusted through parameter tuning to adapt to different market environments.
-
Simple and clear strategy logic, easy to understand and implement.
-
Parameters can be easily optimized to find the best combination.
-
Visual bandpass filter curve intuitively shows market fluctuations.
Risk Analysis
-
Overly optimized bandpass filter may become too sensitive and generate false signals.
-
Unable to determine fluctuation end points, may lead to expanding losses.
-
High trading frequency may increase costs and slippage risks.
-
Vulnerable to black swan events that trigger false signals.
-
Parameters need adjusting for different products and markets.
-
Consider setting stop loss to control loss per trade.
-
Extend exit time or add filters to reduce false signals.
Optimization Directions
-
Optimize parameters to find the best combination, evaluating win rate, profit ratio, Sharpe ratio etc.
-
Add filters like moving average cross, price patterns to avoid trading in non-trending areas.
-
Consider combining parameters across multiple instruments for basket trading to diversify risks.
-
Add stop loss logic to control loss per trade, like dynamic stops or trailing stops.
-
Add profit taking like moving profit stops to lock in gains. Different levels can be set for different trend stages.
-
Optimize entry signals to avoid false signals in ranging markets. Consider longer holding periods or breakout signals.
-
Expand to a cross-asset arbitrage system utilizing price differentials for hedging.
-
Backtest optimization for best asset selection and rebalancing strategies.
Summary
The Dual Bandpass Filter strategy judges price fluctuations using Broder's bandpass filter and generates signals when the fluctuations reach thresholds, with the advantage of high sensitivity to short-term trends and easy implementation. However, it is sensitive to parameters and trading frequency, requiring optimization to reduce false signals and manage risks. Overall, it provides an option for catching short-term trends, but overfitting should be avoided, and other technical tools can be combined for trading.
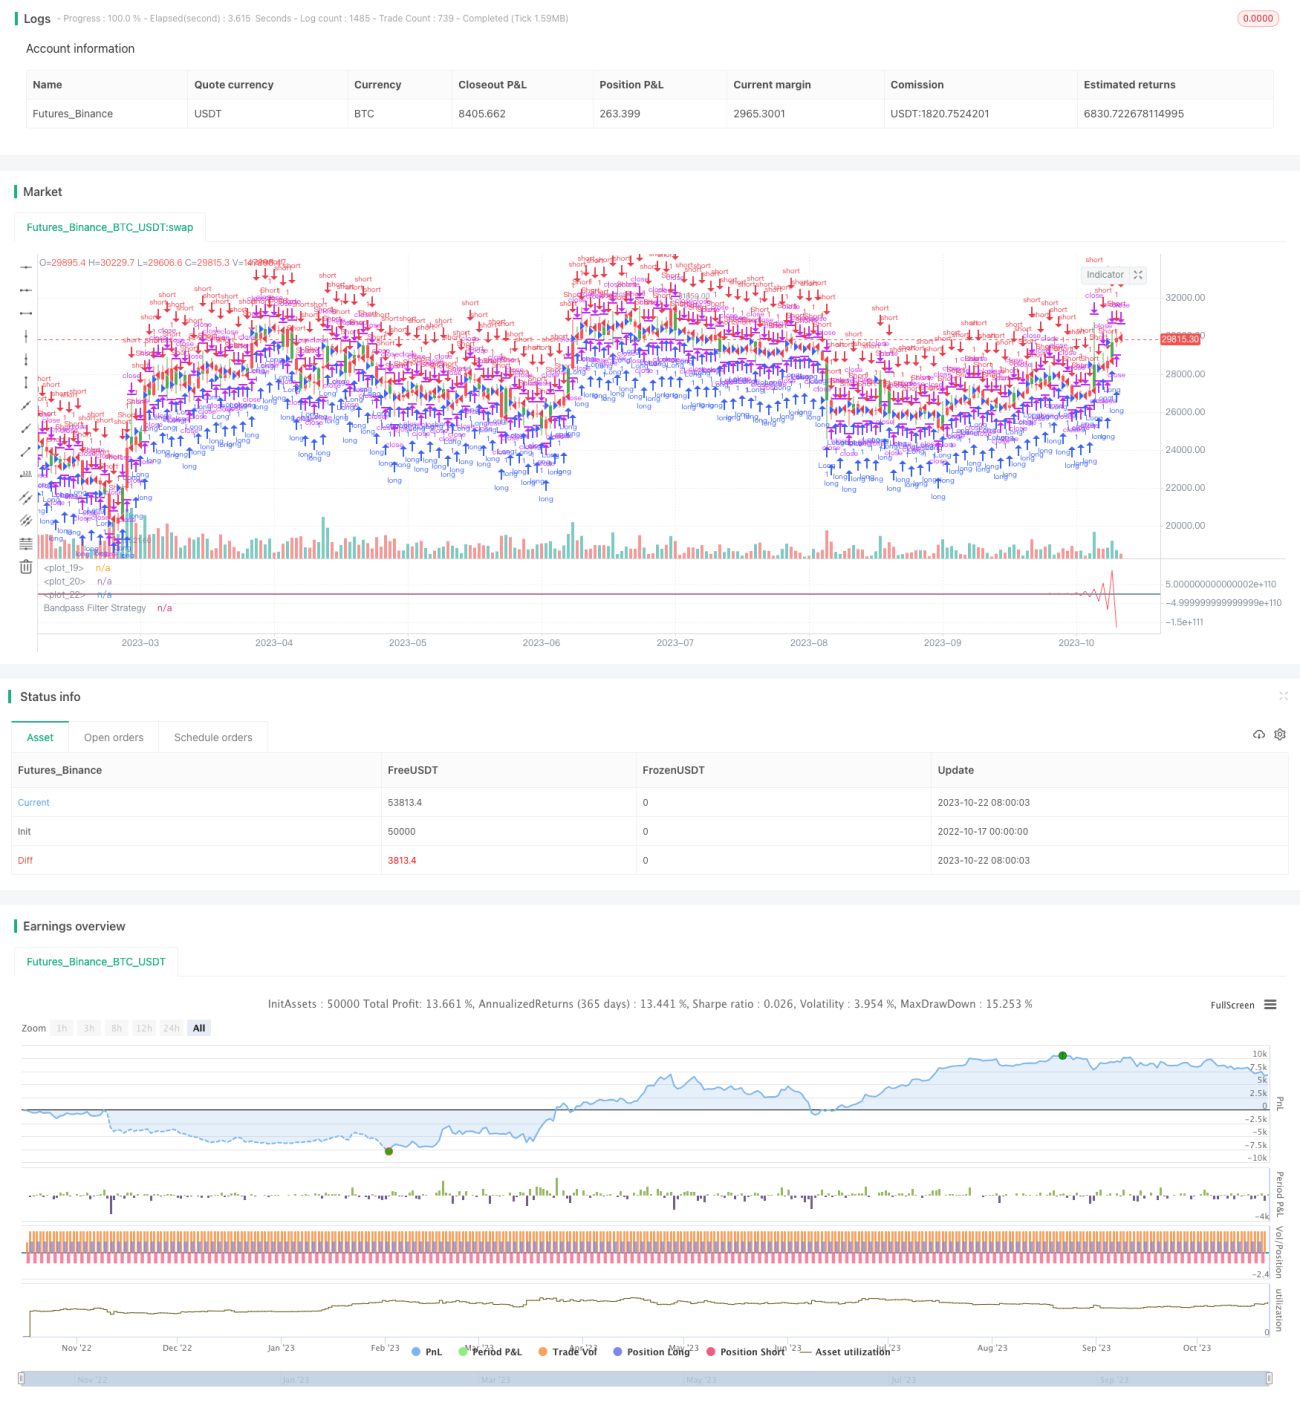
/*backtest
start: 2022-10-17 00:00:00
end: 2023-10-23 00:00:00
period: 1d
basePeriod: 1h
exchanges: [{"eid":"Futures_Binance","currency":"BTC_USDT"}]
*/

//@version=2
////////////////////////////////////////////////////////////
//  Copyright by HPotter v1.0 18/09/2018
// The related article is copyrighted material from- 1