段階的なトレーリングストップロス戦略

1
Follow
1781
Followers
概要
漸進的追跡ストップ戦略は,ストップラインを動的に調整し,リスク管理とストップ・キャプチャの有機的な組み合わせを実現する.平均実際の波動範囲を使用してストップラインを計算し,株価のトレンドを効果的に追跡し,利益を保護しながら不必要なストップを減らす.この戦略は,トレンドが強い株に適用され,安定した利益を得ることができます.
原則
この戦略は,動的ストップの基礎として,平均実際の波動範囲 (ATR) を計算する.ATRは,株の変動性を効果的に反映する.戦略は,ATR周期パラメータを入力し,典型的には10日間である.そしてATR値を計算する.株価が上昇すると,ストップラインもそれに合わせて移動し,動的に追跡される.株価が下がると,ストップラインは変わらないので,利益をロックすることができます.同時に,戦略は,<unk>因子<unk>参数によってストップラインと株価の距離を微調整することができます.
具体的には,策略は,現在のK線のATR値を計算し,<unk>因子<unk>参数で倍し,止損距離を得ます. 株価が止損価格より高い場合は,多ポジションを開きます. 株価が止損価格より低い場合は,空ポジションを開きます. このようにして,止損線は,株価の運行に緊密に貼り付けられ,止損線の漸進追跡効果を実現します.
利点
- ダイナミック・トラッキング・ストップ,市場の状況に応じてストップ距離を調整できる,柔軟性がある
- ATRによるストップ・ロスの計算により,市場の波動を効果的に追跡できます.
- 戦略はシンプルで使いやすい. 取引を自動化するのも簡単です.
- 異なる取引品種に対応するカスタマイズ可能なATR周期とストップ距離因子
- ストップとストップのバランスをとって,不必要なストップの確率を減らす
リスク
- ATRの動的止損基準として,適切なパラメータを選択することが重要です.
- 止損距離が近すぎると,不必要な止損の確率が増加する
- 距離が遠すぎると リスクがコントロールできない
- 戦略は市場動向を判断できず,手動で買入・売却の信号を確認する必要があります.
- ATRの計算周期の合理性,および<unk>因子<unk>のパラメータの調整に注目する
オプティマイズ
- 移動平均線などの指標のフィルタリング信号を組み合わせて,誤った取引の確率を減らすことを考えることができます.
- ATR周期と止損距離のパラメータを機械学習方法によって自動的に最適化できます.
- 自動ストップ戦略を導入し,ストップと損失を組み合わせて利益をロックします.
- 他の指標の組み合わせと併用して購入・売却シグナルの信頼性を検証することも検討できます.
- ATRの計算方法を改良したり,ATR周期パラメータを動的に調整したりすることができます.
- 異なる動的トラッキングの止損アルゴリズムを研究し,止損効果をさらに最適化できます.
要約する
漸進的なトラッキングストップ戦略は,ストップ距離を動的に調整することで,リスク制御とストップ・キャプチャの有効なバランスを実現する. この戦略は,操作がシンプルで,高度にカスタマイズされ,ロボット自動取引に適しています. もちろん,合理的なパラメータ選択と指標の組み合わせは,まだ人工経験が必要です. この戦略は,さらなる最適化により,より安定した投資収益を得ることを期待しています.
Source
Pine
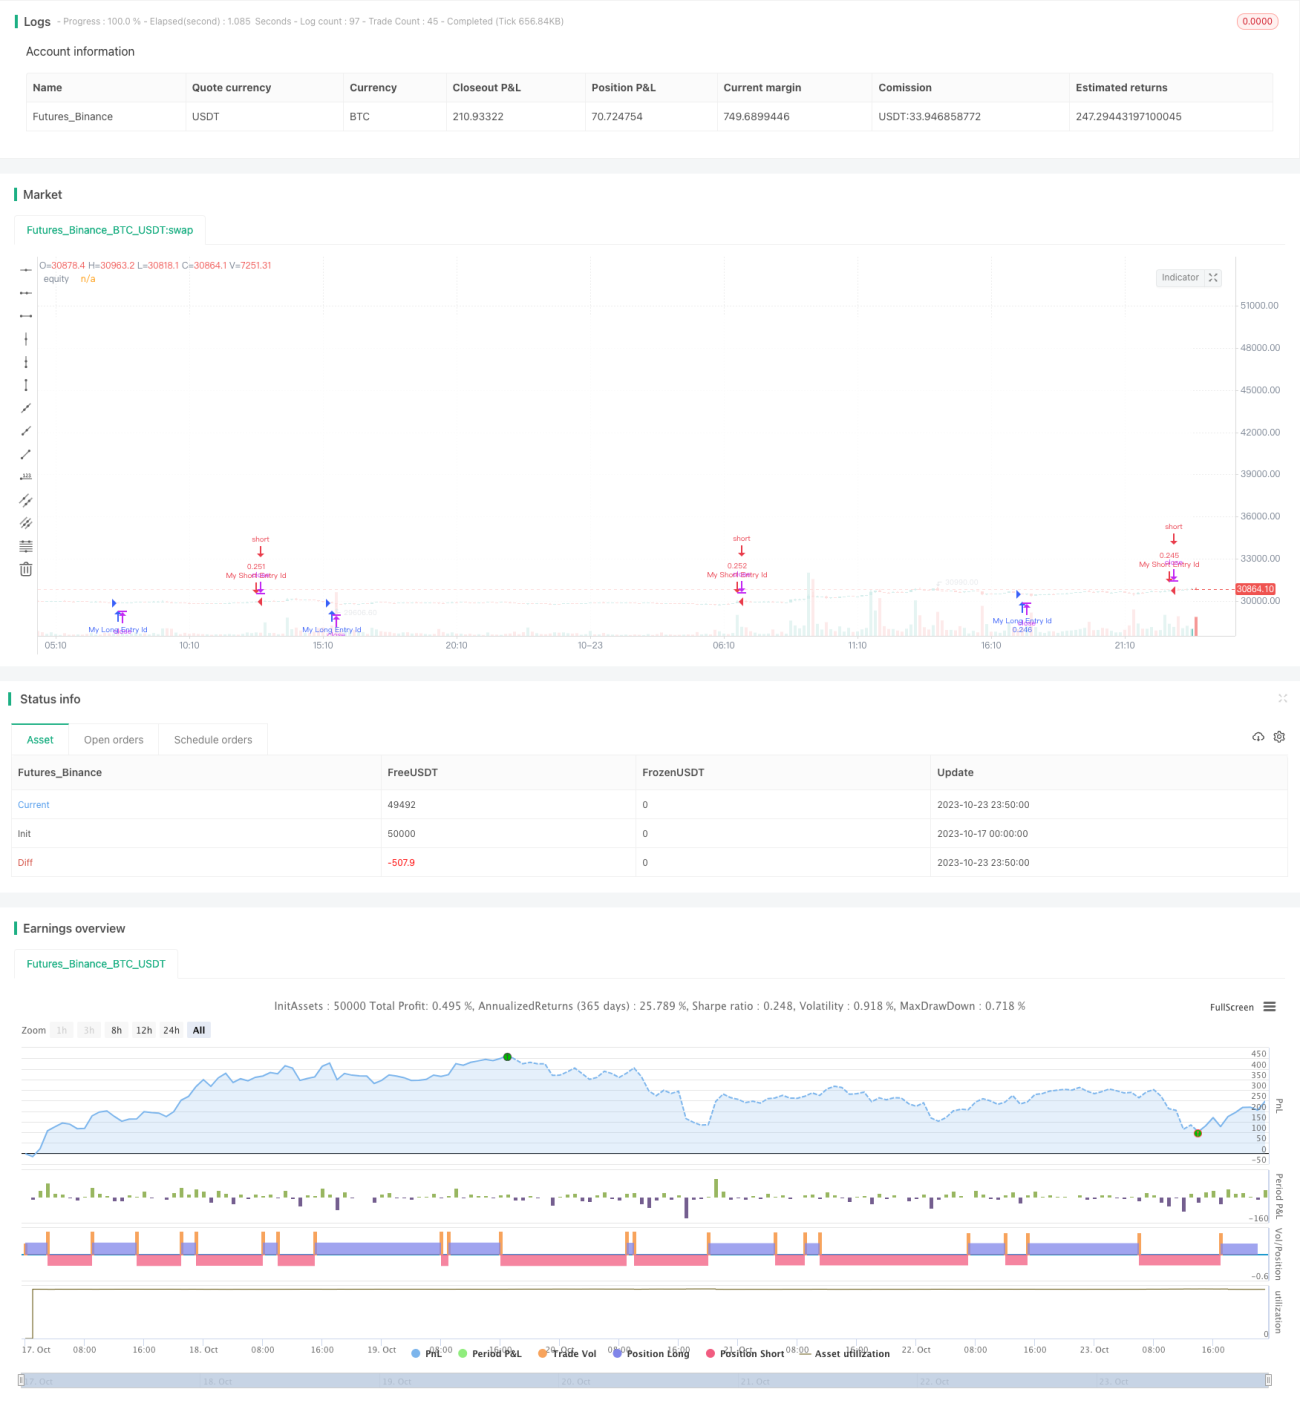
/*backtest
start: 2023-10-17 00:00:00
end: 2023-10-24 00:00:00
period: 10m
basePeriod: 1m
exchanges: [{"eid":"Futures_Binance","currency":"BTC_USDT"}]
*/

//@version=5
strategy("Supertrend Strategy, by Ho.J.", overlay=true, default_qty_type=strategy.percent_of_equity, default_qty_value=15)

// 백테스팅 시작일과 종료일 입력Strategy parameters
Related strategies
Comment
All comments (0)
No data
- 1