
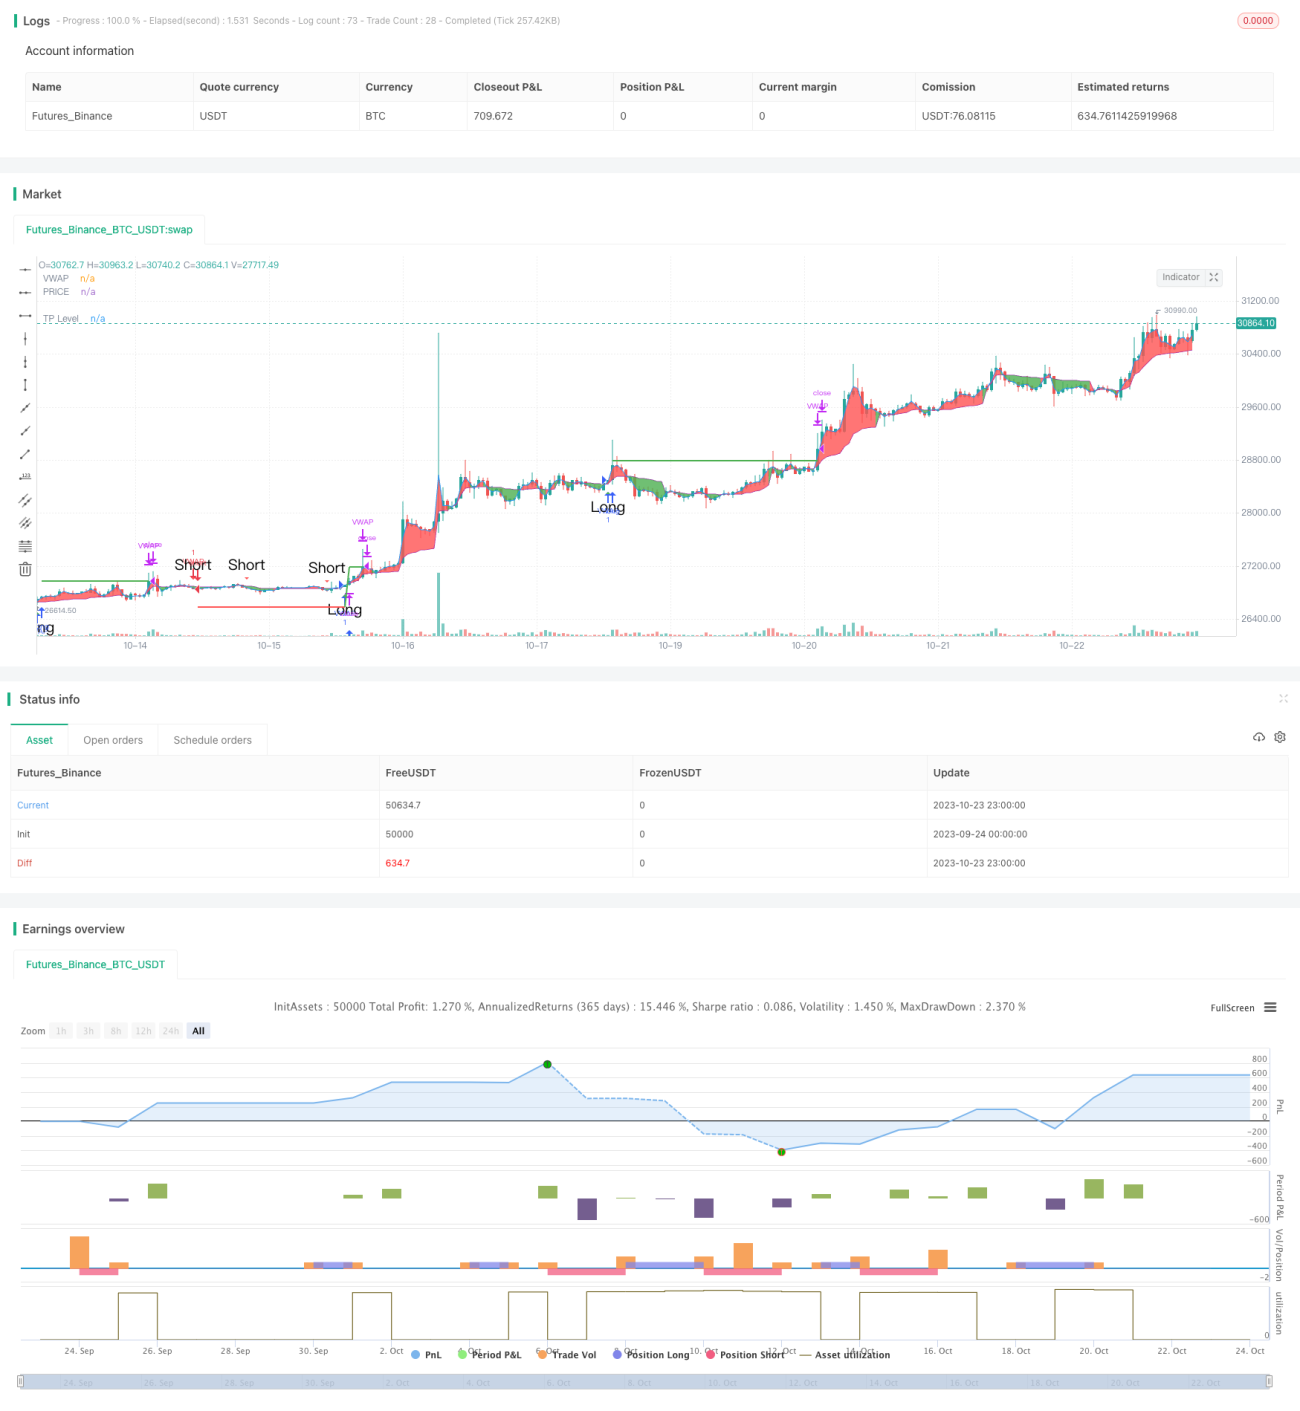
この戦略は,3つの異なる次元であるテクニカル指標,すなわち,レジスタンス,平均線システム,オーバーバイオーバーセール指標のサポートを融合し,それらの総合的な信号に基づいて短期トレンドの方向を判断し,より高い勝利率を得ます.
コードでは,標準振動軸とフィボナッチのサポートとレジスタンスを含む価格のサポートとレジスタンスが最初に計算され,グラフに描かれます.価格がこれらの重要な値を突破すると,重要なトレンドシグナルと見なされます.
次に,重引移動平均VWAPと平均値を計算し,それらの黄金クロスとデッドフォークの信号を判断する.これは中長期のトレンド判断である.
最後に,ストキャスティックRSIの指標を計算し,その金十字と死叉の信号を判断し,超買い超売り指標に属します.
この3つの次元を統合した指標は,サポートレジスタンス,VWAP平均線,Stochastic RSIが同時に買入シグナルを発信した場合,多項を開きます.
この戦略の最大の利点は,3つの異なる次元の指標を組み合わせることで,判断がより全面的に正確で,勝率が高いことです. まず,レジスタンス位は大きな傾向を判断する;次いでVWAPは中間の長線傾向を判断する;最後にStochastic RSIは超買い超売り状況を判断する.三次元指標は同時に信号を発信し,偽の信号を大きくフィルターして,入場成功率を向上させます.
また,ストップ・フック機能が追加され,一定割合の収益をロックでき,資金管理に便利である.
この戦略の主なリスクは,多空決策が指標の同期信号を発信することに依存することであり,一部の指標が誤った信号を発信した場合,決定ミスを引き起こす可能性がある.例えば,ストキャスティックRSIが超買い信号を発信するが,VWAPとサポートレジスタンス判断は依然として悲観的であり,このとき,購入ポイントを逃し,入場しない可能性がある.
また,指標パラメータの設定が不適切であることも信号判断の誤りにつながり,反復テストによって最適なパラメータを特定する必要がある.
さらに,株価は短期間にブラック天事件が頻繁に発生し,指標が失敗する.このリスクを防ぐために,単一の損失を過大にしないように,止損戦略を組み込むことができます.
この戦略は,以下の点で改善できる:
取引量指数などの指標信号を追加し,トレンドの強さや弱さを判断し,意思決定の正確性を向上させる.
機械学習モデルを追加し,多次元指標をトレーニングし,最適の取引戦略を自動的に探す.
異なる品種のパラメータに応じて最適化し,自己適応パラメータを設定します.
リスク管理策の強化と,引き戻しのコントロールポジションの大きさによるリスク管理.
組み合わせを最適化して,関連性が低い品種を見つけ,組み合わせを組み合わせ,組み合わせの撤回を減らす.
この戦略は,全体として,短期トレンド取引に適しています.これは,多次元指数を使用して意思決定を行い,多くのノイズをフィルタリングし,勝利率が高いです.しかし,指標が間違った信号を発信するリスクに注意する必要があります.この戦略は,継続的な最適化によって,効率的で安定したショートライン戦略になる可能性があります.
/*backtest
start: 2023-09-24 00:00:00
end: 2023-10-24 00:00:00
period: 1h
basePeriod: 15m
exchanges: [{"eid":"Futures_Binance","currency":"BTC_USDT"}]
*/
// EmperorBTC's VWAP Indicator & Strategy
// v2.1
//
// coded by Bogdan Vaida
// This indicator was created after EmperorBTC's conditions on Twitter.
// Good timeframes for it: 30', 15', 5'
// To convert from strategy to study switch the commented lines in the beginning
// and at the end of the script and vice versa.
// What this indicator does is to check if:
// o Pivot Point was crossed
// o Stoch-RSI and VWAP were crossed in current or previous candle
// o Candle (or previous candle) close is in the trend direction
// If all these are true then it will go long or short based on direction.
// FUTURE IDEAS:
// - Volume Expansion
// - Candle Stick patterns
//@version=4
// 🔥Uncomment the line below for the indicator and comment the strategy lines
// study(title="EmperorBTC's VWAP Indicator", shorttitle="EMP-VWAP", overlay=true)
// 🔥 Uncomment the line below for the strategy and comment the above line
strategy(title="EmperorBTC's VWAP Strategy", shorttitle="EMP-VWAP", overlay=true, pyramiding=1)
plotAveragePriceCrossedPivotPoint = input(false, title="Plot Close Price Crossing Pivot Points?", group="Pivot Points")
plotPivotPoints = input(false, title="Plot Pivot Points?", group="Pivot Points")
pivotPointsType = input(title="Pivot Points type", defval="Fibonacci", options=["Fibonacci", "Traditional"], group="Pivot Points")
pivotPointCircleWidth = input(2, title="Width of Pivot Point circles", minval=1, group="Pivot Points")
plotVWAP = input(true, title="Plot VWAP?", group="VWAP")
plotAvgPrice = input(true, title="Plot Average Price?", group="VWAP")
plotVWAPCrossPrice = input(false, title="Plot Price Crossing VWAP?", group="VWAP")
reso = input(title="Period", type=input.resolution, defval="D", group="VWAP")
cumulativePeriod = input(14, "VWAP Cumulative Period", group="VWAP")
plotStochRSICross = input(false, title="Plot StochRSI Cross?", group="StochRSI")
smoothK = input(3, "K", minval=1, group="StochRSI", inline="K&D")
smoothD = input(3, "D", minval=1, group="StochRSI", inline="K&D")
lengthRSI = input(14, "RSI Length", minval=1, group="Stochastic-RSI", inline="length")
lengthStoch = input(14, "Stochastic Length", minval=1, group="Stochastic-RSI", inline="length")
rsiSrc = input(close, title="RSI Source", group="Stochastic-RSI")
plotLong = input(true, title="Plot Long Opportunity?", group="Strategy only")
plotShort = input(true, title="Plot Short Opportunity?", group="Strategy only")
tradingDirection = input(title="Strategy trading Direction: ", defval="L&S", options=["L&S", "L", "S"], group="Strategy only")
takeProfit = input(1.0, title='Take Profit %', group="Strategy only") / 100
plotTP = input(true, title="Plot Take Profit?", group="Strategy only")
startDate = input(title="Start Date", type=input.integer,
defval=1, minval=1, maxval=31, group="Backtesting range", inline="Start Date")
startMonth = input(title="Start Month", type=input.integer,
defval=1, minval=1, maxval=12, group="Backtesting range", inline="Start Date")
startYear = input(title="Start Year", type=input.integer,
defval=2017, minval=1800, maxval=2100, group="Backtesting range", inline="Start Date")
endDate = input(title="End Date", type=input.integer,
defval=31, minval=1, maxval=31, group="Backtesting range", inline="End Date")
endMonth = input(title="End Month", type=input.integer,
defval=12, minval=1, maxval=12, group="Backtesting range", inline="End Date")
endYear = input(title="End Year", type=input.integer,
defval=2050, minval=1800, maxval=2100, group="Backtesting range", inline="End Date")
// PivotPoint code (PVTvX by DGT has some nice code on PP)
candleHigh = security(syminfo.tickerid,"D", high[1], lookahead=barmerge.lookahead_on)
candleLow = security(syminfo.tickerid,"D", low[1], lookahead=barmerge.lookahead_on)
candleClose = security(syminfo.tickerid,"D", close[1], lookahead=barmerge.lookahead_on)
pivotPoint = (candleHigh+candleLow+candleClose) / 3
float resistance1 = na
float resistance2 = na
float resistance3 = na
float support1 = na
float support2 = na
float support3 = na
if pivotPointsType == "Fibonacci"
resistance1 := pivotPoint + 0.382 * (candleHigh - candleLow)
resistance2 := pivotPoint + 0.618 * (candleHigh - candleLow)
resistance3 := pivotPoint + (candleHigh - candleLow)
support1 := pivotPoint - 0.382 * (candleHigh - candleLow)
support2 := pivotPoint - 0.618 * (candleHigh - candleLow)
support3 := pivotPoint - (candleHigh - candleLow)
else if pivotPointsType == "Traditional"
resistance1 := 2 * pivotPoint - candleLow
resistance2 := pivotPoint + (candleHigh - candleLow)
resistance3 := candleHigh + 2 * (pivotPoint - candleLow)
support1 := 2 * pivotPoint - candleHigh
support2 := pivotPoint - (candleHigh - candleLow)
support3 := candleLow - 2 * (candleHigh - pivotPoint)
plot(series = plotPivotPoints ? support1 : na, color=#ff0000, title="S1", style = plot.style_circles, linewidth = pivotPointCircleWidth)
plot(series = plotPivotPoints ? support2 : na, color=#800000, title="S2", style = plot.style_circles, linewidth = pivotPointCircleWidth)
plot(series = plotPivotPoints ? support3 : na, color=#330000, title="S3", style = plot.style_circles, linewidth = pivotPointCircleWidth)
plot(series = plotPivotPoints ? pivotPoint : na, color=#FFA500, title="PP", style = plot.style_circles, linewidth = pivotPointCircleWidth)
plot(series = plotPivotPoints ? resistance1 : na, color=#00FF00, title="R1", style = plot.style_circles, linewidth = pivotPointCircleWidth)
plot(series = plotPivotPoints ? resistance2 : na, color=#008000, title="R2", style = plot.style_circles, linewidth = pivotPointCircleWidth)
plot(series = plotPivotPoints ? resistance3 : na, color=#003300, title="R3", style = plot.style_circles, linewidth = pivotPointCircleWidth)
pivotPointCrossedUp = ((low < support3) and (close > support3)) or ((low < support2) and (close > support2)) or ((low < support1) and (close > support1)) or ((low < pivotPoint) and (close > pivotPoint))
pivotPointCrossedDown = ((high > support3) and (close < support3)) or ((high > support2) and (close < support2)) or ((high > support1) and (close < support1)) or ((high > pivotPoint) and (close < pivotPoint))
plotPPColor = pivotPointCrossedUp ? color.green :
pivotPointCrossedDown ? color.red :
na
plotshape(series = plotAveragePriceCrossedPivotPoint ? (pivotPointCrossedUp or pivotPointCrossedDown) : na, title="PP Cross", style = shape.triangleup, location=location.belowbar, color=plotPPColor, text="PP", size=size.small)
// VWAP (taken from the TV code)
// There are five steps in calculating VWAP:
//
// 1. Calculate the Typical Price for the period. [(High + Low + Close)/3)]
// 2. Multiply the Typical Price by the period Volume (Typical Price x Volume)
// 3. Create a Cumulative Total of Typical Price. Cumulative(Typical Price x Volume)
// 4. Create a Cumulative Total of Volume. Cumulative(Volume)
// 5. Divide the Cumulative Totals.
//
// VWAP = Cumulative(Typical Price x Volume) / Cumulative(Volume)
// Emperor's Edition
t = time(reso)
debut = na(t[1]) or t > t[1]
addsource = ohlc4 * volume
addvol = volume
addsource := debut ? addsource : addsource + addsource[1]
addvol := debut ? addvol : addvol + addvol[1]
vwapValue = addsource / addvol
pVWAP = plot(series = plotVWAP ? vwapValue : na, color=color.purple, title="VWAP")
pAvgPrice = plot(series = plotAvgPrice ? ohlc4 : na, color=color.blue, title="PRICE")
fill(pVWAP, pAvgPrice, color = ohlc4 > vwapValue ? color.red : color.green, title="VWAP PRICE FILL")
vwapCrossUp = (low < vwapValue) and (vwapValue < high) and (close > open) // added green candle check
vwapCrossDown = (high > vwapValue) and (vwapValue > low) and (close < open) // added red candle check
plotVWAPColor = vwapCrossUp ? color.green :
vwapCrossDown ? color.red :
na
plotshape(series = plotVWAPCrossPrice ? (vwapCrossUp or vwapCrossDown) : na, title="VWAP Cross Price", style=shape.triangleup, location=location.belowbar, color=plotVWAPColor, text="VWAP", size=size.small)
// Stochastic RSI
rsi1 = rsi(rsiSrc, lengthRSI)
k = sma(stoch(rsi1, rsi1, rsi1, lengthStoch), smoothK)
d = sma(k, smoothD)
sRsiCrossUp = k[1] < d[1] and k > d
sRsiCrossDown = k[1] > d[1] and k < d
plotColor = sRsiCrossUp ? color.green :
sRsiCrossDown ? color.red :
na
plotshape(series = plotStochRSICross ? (sRsiCrossUp or sRsiCrossDown) : na, title="StochRSI Cross Up", style=shape.triangleup, location=location.belowbar, color=plotColor, text="StochRSI", size=size.small)
// Long Trades
sRsiCrossedUp = sRsiCrossUp or sRsiCrossUp[1]
vwapCrossedUp = vwapCrossUp or vwapCrossUp[1]
// longCond1 = (sRsiCross and vwapCross) or (sRsiCross[1] and vwapCross) or (sRsiCross and vwapCross[1])
longCond1 = (sRsiCrossedUp[1] and vwapCrossedUp[1])
longCond2 = pivotPointCrossedUp[1]
longCond3 = (close[1] > open[1]) and (close > open) // check this
longCond = longCond1 and longCond2 and longCond3
plotshape(series = plotLong ? longCond : na, title="Long", style=shape.triangleup, location=location.belowbar, color=color.green, text="Long", size=size.normal)
// Short Trades
sRsiCrossedDown = sRsiCrossDown or sRsiCrossDown[1]
vwapCrossedDown = vwapCrossDown or vwapCrossDown[1]
shortCond1 = (sRsiCrossedDown[1] and vwapCrossedDown[1])
shortCond2 = pivotPointCrossedDown[1]
shortCond3 = (close[1] < open[1]) and (close < open)
shortCond = shortCond1 and shortCond2 and shortCond3
plotshape(series = plotShort ? shortCond : na, title="Short", style=shape.triangledown, location=location.abovebar, color=color.red, text="Short", size=size.normal)
// alertcondition(condition=longCond, title="Long", message="Going long")
// alertcondition(condition=shortCond, title="Short", message="Going short")
// 🔥 Uncomment the lines below for the strategy and revert for the study
takeProfitLong = strategy.position_avg_price * (1 + takeProfit)
takeProfitShort = strategy.position_avg_price * (1 - takeProfit)
exitTp = ((strategy.position_size > 0) and (close > takeProfitLong)) or ((strategy.position_size < 0) and (close < takeProfitShort))
strategy.risk.allow_entry_in(tradingDirection == "L" ? strategy.direction.long : tradingDirection == "S" ? strategy.direction.short : strategy.direction.all)
plot(series = (plotTP and strategy.position_size > 0) ? takeProfitLong : na, title="TP Level",color=color.green, style=plot.style_linebr, linewidth=2)
plot(series = (plotTP and strategy.position_size < 0) ? takeProfitShort : na, title="TP Level",color=color.red, style=plot.style_linebr, linewidth=2)
inDateRange = (time >= timestamp(syminfo.timezone, startYear,
startMonth, startDate, 0, 0)) and (time < timestamp(syminfo.timezone, endYear, endMonth, endDate, 0, 0))
strategy.entry("VWAP", strategy.long, comment="Long", when=longCond and inDateRange)
strategy.entry("VWAP", strategy.short, comment="Short", when=shortCond and inDateRange)
strategy.close(id="VWAP", when=exitTp)
if (not inDateRange)
strategy.close_all()