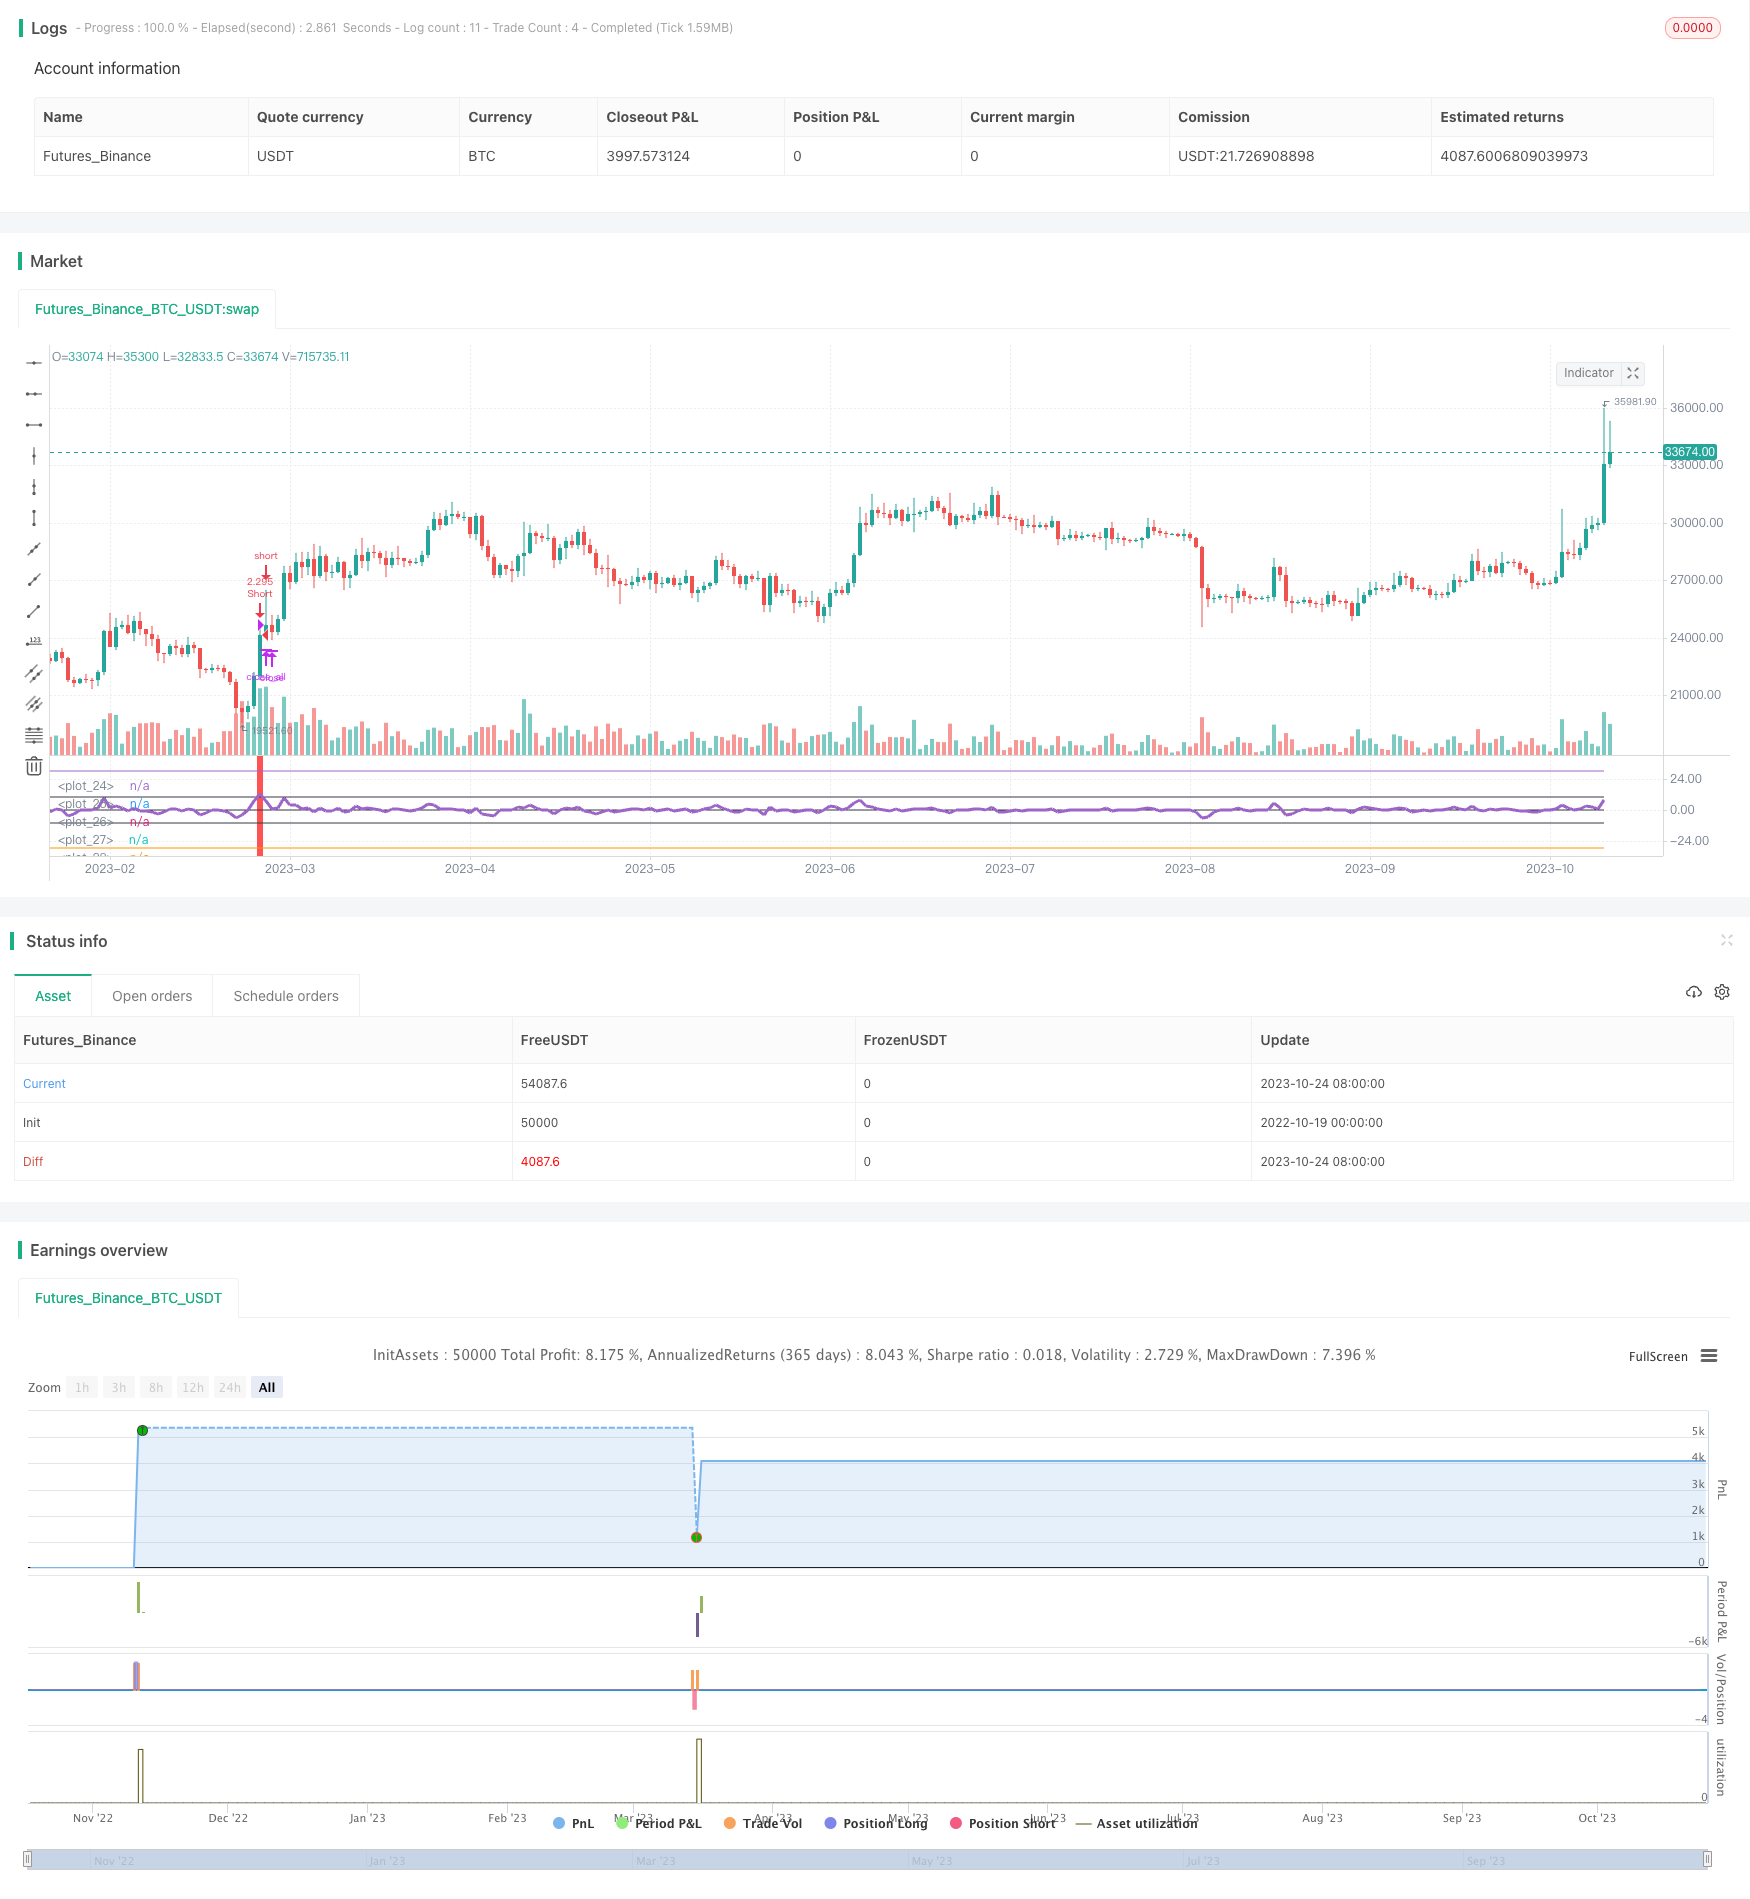
後続移動平均ギャップ戦略

この記事では,Noroが作成した追跡移動平均空飛ぶ戦略を詳細に分析する.この戦略は,閉店価格とSMAの偏差を計算し,市場トレンドの転換のタイミングを判断し,低買い高売りを実現する.
戦略原則
この策略は,まず,3日間のシンプル・ムービング・アベアンス (sma) を計算する.それから,閉店価格のcloseとsmaの比を計算し,1を減算すると,指数indが得られる.indの上を突破すると,閉店価格がsmaを明らかに上回っていることを示す,過剰を考慮する.indの下を突破すると,閉店価格がsmaより大幅に低いことを示す,空白を考慮する.
策略はまた,0軸,limit軸,および-limit軸を描いています. ind指標は,異なる領域で,異なる色で色付けされ,判断を補助しています. ind指標がlimitまたは-limitを横切ると,多行または空白の信号が表示されます.
策略が多引または空調の信号を生じるときは,まず現在の方向の逆のポジションをクリアし,次に多引または空調を開きます.ind指数が0軸の間に戻ると,すべてのポジションをクリアします.
戦略的優位性
跳躍原理を用いて,価格が移動平均から明らかに離れるときに逆転操作を行う.これはトレンド追跡とは異なり,跳躍戦略はターニングポイントを捕獲しようとする.
指標軸を描き,直観的に指標の位置と穿越を判断する.
平仓の論理を最適化し,現在のポジションを平にした後に逆転して新しいポジションを開くことで,不要な逆転ポジション保持を避ける.
取引時間帯を設定して,不必要な夜間ポジションを避ける.
多空の両側にアクセスする取引スイッチを設定することを許可し,多空のみまたは空空のみを行うことができます.
戦略リスク
移動平均策を追跡することは,多重な損失を招く可能性があり,忍耐強いポジションに適しています.
移動平均は価格の変動を反映する判断指標として柔軟性が欠けています.
デフォルトのパラメータのlimitは静的であり,異なる品種と市場環境で調整する必要がある.
移動平均を追跡する方法は,トレンド内の波動を識別できないので,波動指標などと組み合わせて使用すべきである.
ポジションの維持ルールの最適化が必要である.例えば,ストップ・ローズやストップ・ストップを設定するか,またはトレンドの初期にのみ空飛ぶようにする.
戦略最適化の方向性
異なるパラメータの設定,例えばsma周期,または指数移動平均などの自己適応移動平均をテストできます.
移動平均の方向,角度などの判定を加えることができ,プラットフォーム期間の無意味な取引を避ける.
ブリン帯のような波動性指標と組み合わせると,波動が大きくなると取引を一時停止することを考えることができます.
ポジション管理のルールを設定できます. 固定数量でのポジション開設,ポジションの追加,資金管理などです.
ストップ・ロスト・フリッジを設定したり,固定比率のストップ・ロスト時に新規オーダーを一時停止したりして,単価リスクをコントロールできます.
要約する
この記事では,Noroが作成したトラッキング移動平均空飛ぶ戦略を詳細に分析した.この戦略は,価格空飛ぶ移動平均の特徴を利用し,指標軸とカラーグラフィを設計し,入場タイミングを判断した.平仓順序の論理を最適化し,取引時間範囲を設定した.しかし,この戦略には,移動平均を追跡する固有の欠点があり,パラメータ設定,止損ルール,その他の指標との結合をさらに最適化して安定性を高める必要がある.
/*backtest
start: 2022-10-19 00:00:00
end: 2023-10-25 00:00:00
period: 1d
basePeriod: 1h
exchanges: [{"eid":"Futures_Binance","currency":"BTC_USDT"}]
*/

//Noro
//2018

//@version=3
strategy(title = "Noro's Shift Close Strategy v1.0", shorttitle = "Shift Close 1.0", default_qty_type = strategy.percent_of_equity, default_qty_value = 100, pyramiding = 5)

//Settings
needlong = input(true, defval = true, title = "Long")
needshort = input(true, defval = true, title = "Short")
capital = input(100, defval = 100, minval = 1, maxval = 10000, title = "Lot, %")
limit = input(10)
fromyear = input(1900, defval = 1900, minval = 1900, maxval = 2100, title = "From Year")
toyear = input(2100, defval = 2100, minval = 1900, maxval = 2100, title = "To Year")
frommonth = input(01, defval = 01, minval = 01, maxval = 12, title = "From Month")
tomonth = input(12, defval = 12, minval = 01, maxval = 12, title = "To Month")
fromday = input(01, defval = 01, minval = 01, maxval = 31, title = "From Day")
today = input(31, defval = 31, minval = 01, maxval = 31, title = "To Day")

//Shift MA
sma = sma(ohlc4, 3)
ind = ((close / sma) - 1) * 100

//Oscilator
plot(3 * limit, color = na, transp = 0)
plot(limit, color = black, transp = 0)
plot(0, color = black, transp = 0)
plot(-1 * limit, color = black, transp = 0)
plot(-3 * limit, color = na, transp = 0)
plot(ind, linewidth = 3, transp = 0)
col = ind > limit ? red : ind < -1 * limit ? lime : na
bgcolor(col, transp = 0)

//Signals
size = strategy.position_size
up = ind < -1 * limit
dn = ind > limit
exit = ind > -1 * limit and ind < limit

//Trading
lot = 0.0
lot := size == 0 ? strategy.equity / close * capital / 100 : lot[1]

if up
    if strategy.position_size < 0
        strategy.close_all()

    strategy.entry("Long", strategy.long, needlong == false ? 0 : lot, when=(time > timestamp(fromyear, frommonth, fromday, 00, 00) and time < timestamp(toyear, tomonth, today, 23, 59)))

if dn
    if strategy.position_size > 0
        strategy.close_all()

    strategy.entry("Short", strategy.short, needshort == false ? 0 : lot, when=(time > timestamp(fromyear, frommonth, fromday, 00, 00) and time < timestamp(toyear, tomonth, today, 23, 59)))

if exit
    strategy.close_all()