ダブルEMA黄色と緑の取引システム


作成日: 2023-10-26 17:15:46 最終変更日: 2023-10-26 17:15:46
コピー: 0 クリック数: 680
1
フォロー
1617
フォロワー

ダブルEMA黄色と緑の取引システム

概要

双EMA黄緑取引システムは,双指数移動平均に基づくトレンド追跡取引システムである.このシステムは,価格とEMA平均線との関係に基づいて現在のトレンド方向を判断し,取引決定を行うために,2つの異なる周期のEMA平均線を使用する.このシステムは,論理的にシンプルで,操作が簡単で,市場トレンドをうまく捉え,中長期の投資家に適しています.

戦略原則

この戦略は,主に2つのEMA平均線,すなわち,より速い周期のEMA平均線と,より遅い周期のEMA平均線に依存する. 速いEMAが遅いEMAの上であるときは,ブルッシュとみなされ,速いEMAが遅いEMAの下であるときは,ベアッシュとみなされる.

価格と2つのEMA均線との関係により,K線を異なる取引領域に分けることができる:

  • 速気EMAが遅気EMA上であり,価格が速気EMA上であるとき ((G1),強気買い区域として,このとき購入することができる.

  • 速いEMAが遅いEMAの下にあり,価格が速いEMAの下にあるとき ((R1),強さのためにエリアを売り,このときは売り出せます。

  • EMAの交差時に,価格と2つのEMAの関係によって,黄色 (警告) とオレンジ (見張) の領域に分けることができます. この2つの領域は,トレンドの転換の可能性を代表し,他の領域と他の指標と組み合わせて取引を決定する必要があります.

この戦略は,異なる取引領域の価格の変化に応じて,買入と売却の信号を発する.強気領域G1とR1では,戦略は直接信号を生成する.予警と監視領域では,他の指標の確認が必要である.

さらに,この戦略は,StochRSIを導入し,買い買いを判断するのに役立ちます.StochRSIの超買い超売りは,追加的な買い売りシグナルとして使用できます.

戦略的優位性

  • 戦略の論理はシンプルで明快で,理解し,実行しやすい.

  • 動向を基に動いて,中長期のトレンドを効果的に捉えることができる.

  • 強い地域と,トレンドに反する警告/見張りの地域を区別し,取引信号はより信頼性がある.

  • ストックRSIと組み合わせると,買いや売却のタイミングをより正確に判断できます.

戦略リスク

  • 純トレンドシステムでは,明確なトレンドがない市場で取引がうまくいかない可能性があります.

  • EMA周期が正しく設定されていなければ,誤信号が発生する可能性があります.

  • 警戒区と監視区は取引のリスクが高く,慎重に扱われる必要があります.

  • 損失の拡大につながるリスクは考慮されていない.

リスクを下げるには以下の方法があります.

  1. 傾向がはっきりした品種を選び,傾向が弱かったときに取引を一時停止する.

  2. 偽信号の確率を減らすためにEMA周期パラメータを最適化します.

  3. 予備警報や監視区域の他の指標の導入を確認し,取引リスクを軽減する.

  4. ストップ・ロスを設定して,単一損失をコントロールする.

戦略最適化の方向性

この戦略は以下の点で最適化できます.

  1. MACD,KDJなどの指標を導入し,信号の質を向上させる.

  2. 取引量を増やし,取引の成功率を高めるように,取引区域にフィルタリング条件を導入する.

  3. 市場状況に応じてEMAパラメータを動的に調整し,最適化パラメータを設定する.

  4. 損失の一定比率に達したときに損失を止める戦略を増やす.

  5. 資金管理を最適化し,合理的なポジション管理を設定する.

  6. 異なる品種で最適化テストを行い,最適なパラメータの組み合わせを探します.

より多くの補助判断指標,動態パラメータの最適化,止損戦略などの導入により,システムの安定性を高め,資金管理などの観点からリスクを軽減することで,この戦略は,より良い取引効果を得ることができる.

要約する

双EMA黄緑取引システムは,双EMA均線の比較に基づくトレンド追跡取引システムである.異なる取引領域を区分し,価格とEMA均線の関係によってトレンドの方向を判断し,取引信号を生成する,論理的に明確で,容易に実行可能なトレンド追跡システムである.この戦略は,トレンドを効果的に捕捉し,取引規則はシンプルで直感的な利点などがありますが,一定のリスクもあります.補助指標,動的最適化パラメータ設定,ストップロス設定,資金管理の最適化などの方法を導入することにより,リスクを軽減し,システムの安定性と収益性をさらに向上させることができます.全体的に,双EMA黄緑取引システムは,中長期投資家が使用するのに非常に適したトレンド追跡システムです.
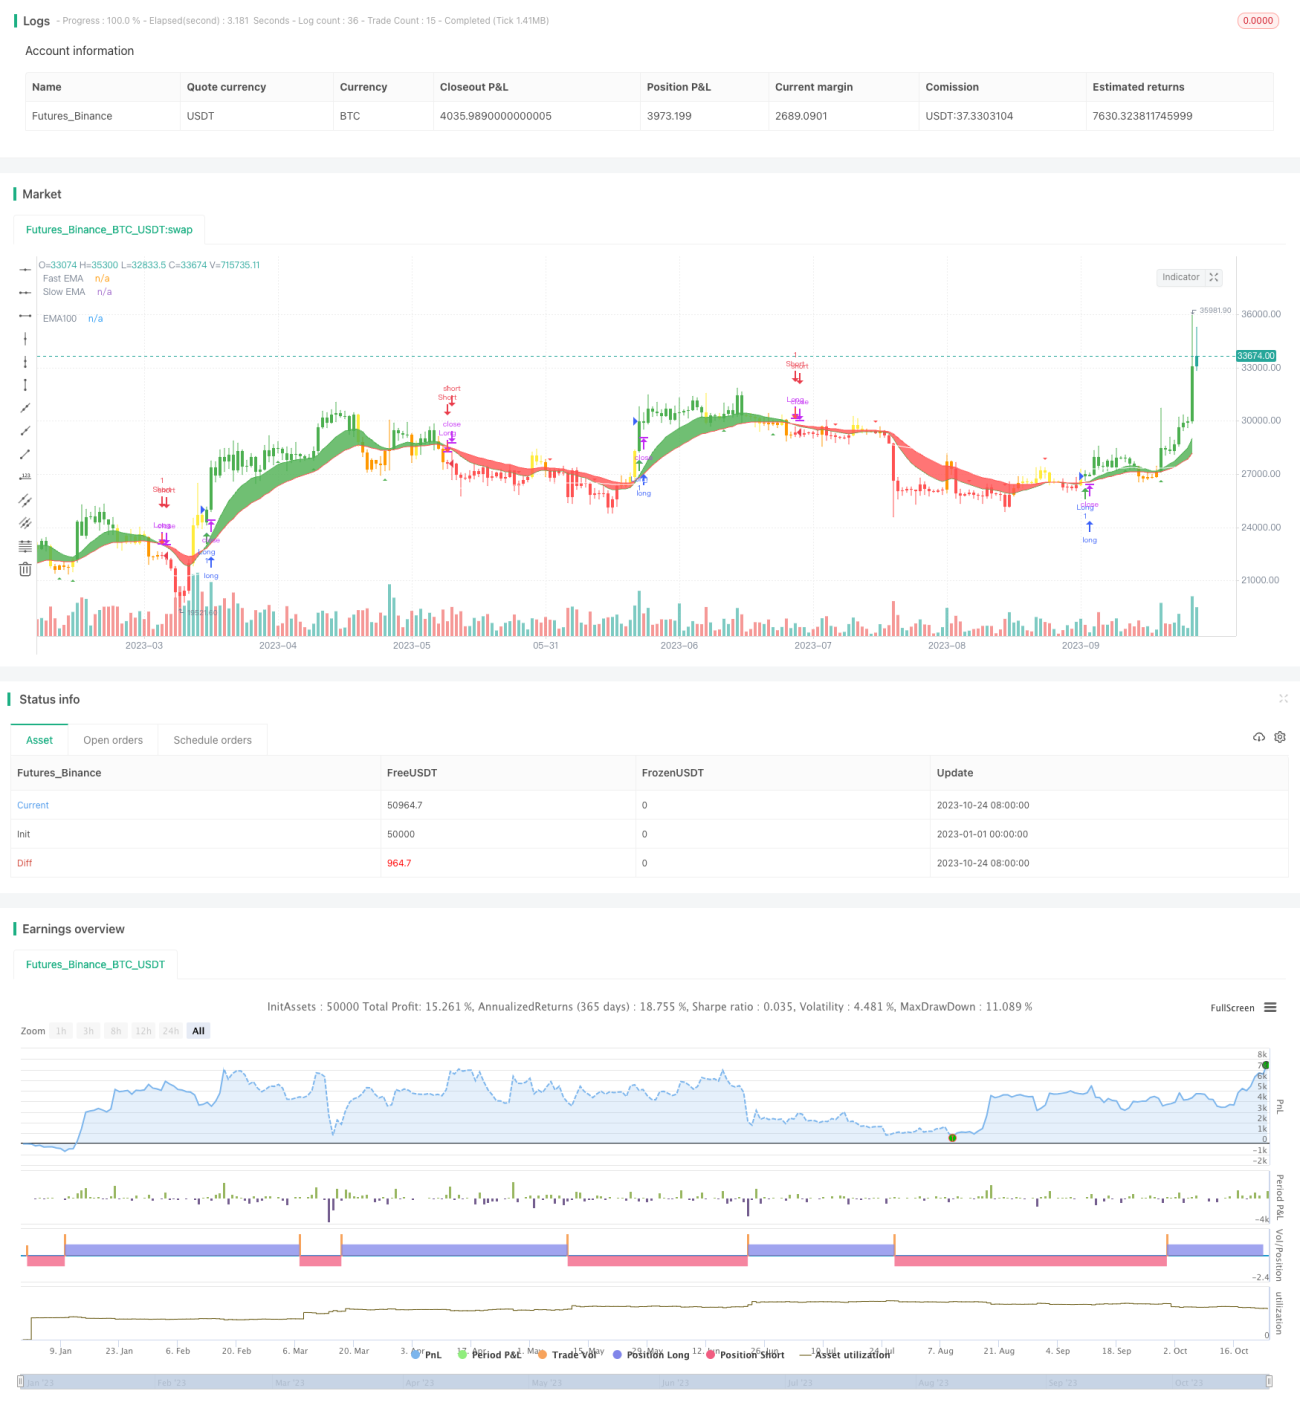
ストラテジーソースコード
/*backtest
start: 2023-01-01 00:00:00
end: 2023-10-25 00:00:00
period: 1d
basePeriod: 1h
exchanges: [{"eid":"Futures_Binance","currency":"BTC_USDT"}]
*/

// This source code is subject to the terms of the Mozilla Public License 2.0 at https://mozilla.org/MPL/2.0/
// © Vvaz_
//base-on CDC ActionZone By Piriya   a simple 2EMA and is most suitable for use with medium volatility market
//@version=4
strategy(title="Vin's Playzone" ,shorttitle="VPz", overlay=true, margin_long=4, margin_short=2)

//variable
srcf = input(title="Source",type=input.source,defval=close)
tffix = input(title="Fixed Timeframe",type=input.bool,defval=true)
tfn = input(title="Timeframe in",type=input.resolution,defval="D")
ema1 = input(title="Fast EMA",type=input.integer,defval=12)
ema2 = input(title="Slow EMA",type=input.integer,defval=26)
ema3 = input(title="EMA 100",type=input.bool,defval=true)
smooter =input(title="Smoothing period (1 = no smoothing)",type=input.integer,defval=2)
fillbar =input(title="Fill Bar Color",type=input.bool,defval=true)
emasw = input(title="Show EMA",type=input.bool,defval=true)
bssw = input(title="Show Buy-Sell signal",type=input.bool,defval=true)
plotmm = input(title="Show Buy-Sell Momentum",type=input.bool,defval=true)
plotmmsm = input(title="RSI Smoothing",type=input.integer,defval=0,minval=0,maxval=2)

//math
xcross =ema(srcf,smooter)
efast = tffix ?  ema(security(syminfo.tickerid,tfn,ema(srcf,ema1), gaps = barmerge.gaps_off,lookahead = barmerge.lookahead_on),smooter) :ema(xcross,ema1)
eslow = tffix ?  ema(security(syminfo.tickerid,tfn,ema(srcf,ema2), gaps = barmerge.gaps_off,lookahead = barmerge.lookahead_on),smooter) :ema(xcross,ema2)
ema3x = ema(xcross,100)


//Zone
Bull = efast > eslow
Bear = efast < eslow

G1 = Bull and xcross > efast //buy
G2 = Bear and xcross > efast and xcross > eslow //pre-buy1
G3 = Bear and xcross > efast and xcross < eslow //pre-buy2

R1 = Bear and xcross < efast //sell
R2 = Bull and xcross < efast and xcross < eslow //pre-sell1
R3 = Bull and xcross < efast and xcross > eslow //pre-sell2

//color
bcl =   G1 ? color.green :  G2 ? color.yellow : G3 ? color.orange :R1 ? color.red :R2 ? color.orange : R3 ? color.yellow : color.black
barcolor(color=fillbar ? bcl : na )

//plots
line1 = plot(ema3 ? ema3x : na ,"EMA100",color=color.white)
line2 = plot(emasw ? efast : na ,"Fast EMA",color=color.green)
line3 = plot(emasw ? eslow : na ,"Slow EMA",color=color.red)
fillcl = Bull ? color.green : Bear ? color.red : color.black
fill(line2,line3,fillcl)

//actions
buywhen = G1 and G1[1]==0
sellwhen = R1 and R1[1]==0

bullish = barssince(buywhen) < barssince(sellwhen)
bearish = barssince(sellwhen) < barssince(buywhen)

buy = bearish[1] and buywhen
sell = bullish[1] and sellwhen

bullbearcl = bullish ? color.green : bearish ? color.red : color.black

//plot trend
plotshape(bssw ? buy : na ,style=shape.arrowup,title="BUY",location=location.belowbar,color=color.green)
plotshape( bssw ? sell : na ,style=shape.arrowdown ,title="Sell",location=location.abovebar,color=color.red)

// Momentum Signal using StochRSI

smoothK = input(5,"StochRSI smooth K",type=input.integer,minval=1)
smoothD = input(4,"StochRSI smooth D",type=input.integer,minval=1)
RSIlen = input(14,"RSI length",type=input.integer,minval=1)
STOlen = input(14,"Stochastic length",type=input.integer,minval=1)
SRsrc = input(close,"Source for StochasticRSI",type=input.source)
OSlel = input(20,"Oversold Threshold",type=input.float,minval=0.00)
OBlel = input(80,"Oversold Threshold",type=input.float,minval=0.00)
rsil = rsi(SRsrc,RSIlen)
K = sma(stoch(rsil,rsil,rsil,STOlen),smoothK)
D = sma(K,smoothD)

buymore = iff( bullish ,iff(D < OSlel and crossover(K,D),	2,	 iff(D > OSlel and crossover(K,D),	 1,0)),0)
sellmore = iff( bearish,iff(D > OBlel and crossunder(K,D),	2,	 iff(D < OBlel and crossunder(K,D),	 1,0)),0)
//plot momentum
plotshape(plotmm ? buymore > plotmmsm ? buymore : na : na ,"Buy More!" ,style=shape.triangleup,location=location.belowbar,color=color.green)
plotshape(plotmm ? sellmore > plotmmsm ? sellmore : na : na ,"Sell More!" ,style=shape.triangledown,location=location.abovebar,color=color.red)


// === INPUT BACKTEST RANGE ===
FromYear  = input(defval = 2009, title = "From Year", minval = 2009)
FromMonth = input(defval = 1, title = "From Month", minval = 1, maxval = 12)
FromDay   = input(defval = 1, title = "From Day", minval = 1, maxval = 31)
ToYear    = input(defval = 9999, title = "To Year", minval = 2009)
ToMonth   = input(defval = 12, title = "To Month", minval = 1, maxval = 12)
ToDay     = input(defval = 31, title = "To Day", minval = 1, maxval = 31)

// === FUNCTION EXAMPLE ===
start     = timestamp(FromYear, FromMonth, FromDay, 00, 00)  // backtest start window
finish    = timestamp(ToYear, ToMonth, ToDay, 23, 59)        // backtest finish window
window()  => time >= start and time <= finish ? true : false // create function "within window of time"

//stratgy excuter
strategy.entry("Long",true,when=window() and buy or buymore)
strategy.close("Long",when=window() and sell or sellmore,comment="TP Long")
strategy.entry("Short",false,when=window() and sell or sellmore)
strategy.close("Short",when=window() and buy or buymore,comment="TP Short")