ダブルストキャスティクスと出来高加重移動平均の組み合わせ指標

概要
これは,2つのストキャスティクス指標と交差量加重移動平均を組み合わせてトレンドを識別する戦略である.この戦略は,2つの異なる周期のストキャスティクス指標,一つは短周期,一つは長周期であり,交差量加重移動平均を組み合わせて現在のトレンドの方向を判断する.
戦略原則
この戦略は,以下の部分によってトレンドを判断します.
-
周期長がinput(30),平滑参数が2である短い周期のストキャスティクス指標を計算する
-
長い周期のストキャスティクス指標を計算し,周期長がinput ((90),平滑パラメータは2
-
短周期と長周期のストキャスティクス指標を足し合わせると,総合的なストキャスティクス曲線tsが得られる.
-
交差量加重移動平均tslをts曲線に計算し,周期長がinput(30)
-
TSLの現在の値と1サイクル前の値の比較,TSLが上昇すると上昇傾向と,TSLが低下すると下降傾向と
-
ストキャスティクス曲線の位置を組み合わせて,多頭または空頭信号であるかどうかを判断します.
- tslが上昇し,tsが中間領域にあるとき,多頭信号
- tslが下がり,tsが中間領域にあるとき空頭信号
戦略的優位分析
この戦略は,トレンド判断と超買超売判断を組み合わせて,トレンドの方向を比較的に信頼的に識別することができる.具体的メリットは以下の通りである.
-
双ストキャスティクス指標は,短期的超買と長期的超売を同時に反映し,特定の信号を逃さないようにします.
-
偽の突破信号をフィルターする
-
ストキャスティクス曲線の位置は,トレンド信号の信頼性を再確認しました.
-
パラメータは調整可能で,異なる市場に応じて周期長さを適切に調整できます
-
戦略は明快で簡潔で,理解しやすく変更できます.
リスクと改善の分析
この戦略にはいくつかのリスクがあります.
-
ストキャスティクス指数は偽信号を発信しやすいため,より長い周期の指数フィルターと組み合わせる必要があります.
-
固定周期パラメータは,すべての市場状況に適応しない. 動的最適化パラメータを考慮することができる.
-
基本的要素と組み合わせた技術的な指標のみによる精度向上
-
交付量データの不正確さは結果に影響し,交付量データの品質を検証する必要があります.
-
追跡時間が短く,より長い歴史データが必要です.
-
エントリーポイントを最適化し,現在では crosses under の最小値で直接追加し,バッファローンを設定できます.
要約する
概して,この戦略は,二重ストーカスティクス指標と取引量重圧移動平均を用いてトレンド判断を行い,理論的にはトレンド転換点を比較的に信頼できる.しかし,パラメータの設定は,特定の市場に対して最適化する必要があり,ある種の偽信号のリスクがある.戦略Profit Factorを向上させるために,基本面や長期トレンドなどの他の要因と組み合わせて総合的な判断をすることが推奨されている.この戦略の構想は,シンプルで明確で,量化取引のためのテンプレートを提供し,需要に応じて変更され,最適化され,強力な応用価値を持っています.
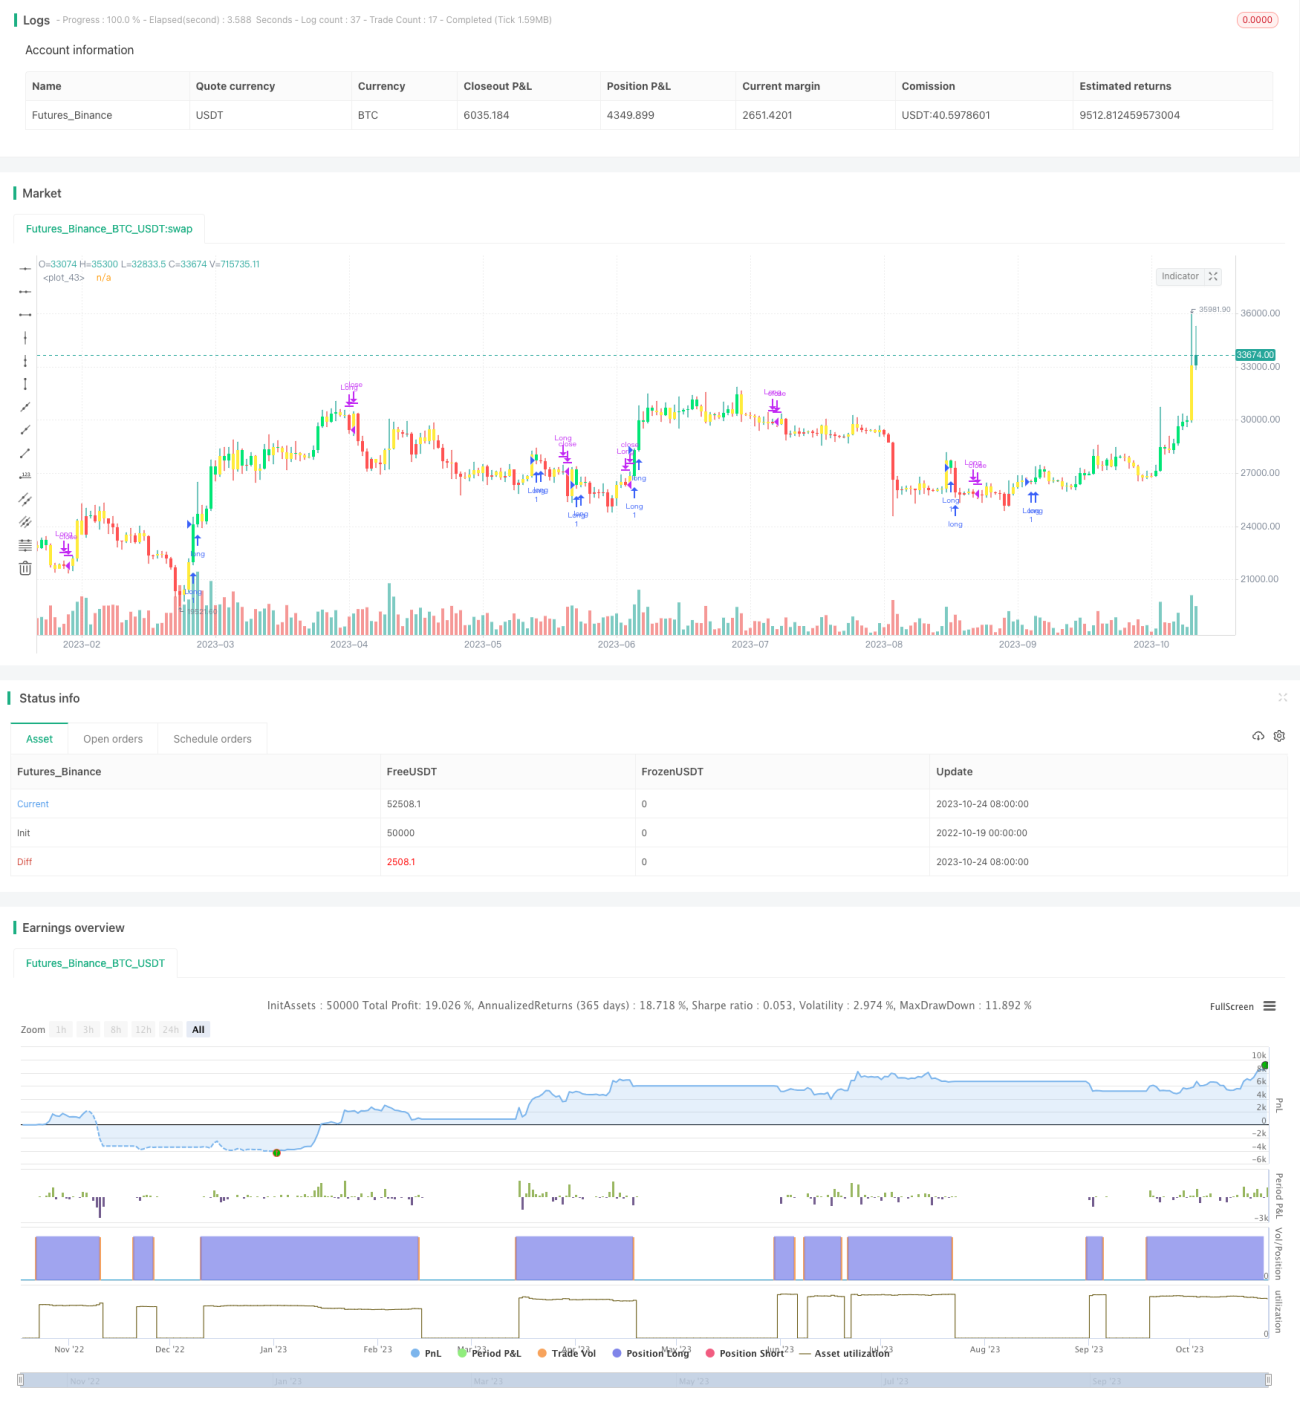
/*backtest
start: 2022-10-19 00:00:00
end: 2023-10-25 00:00:00
period: 1d
basePeriod: 1h
exchanges: [{"eid":"Futures_Binance","currency":"BTC_USDT"}]
*/

//@version=4
strategy(title="Trend Finder V2", shorttitle="TFV2", format=format.price, precision=2, overlay = true)

//----------Indicator------------//- 1