
[trans]
概要
反転安値反発戦略はシンプルかつ効果的な株式取引戦略です。安値反発の機会を捉え、株価が反転上昇するタイミングで市場に参入し、短期運用で利益を得た後、速やかに損切りして退出します。
戦略ロジック
本戦略は主に2つの指標に基づいています。エントリーのタイミングを判断する5日最安値と、イグジットのタイミングを判断する2日RSIです。
具体的な手順は次のとおりです。
- 当日の終値が前日の5日最安値を下回った場合、当日の終値でロングエントリーします。
- 2日RSIが買われ過ぎゾーン(デフォルト50)を超えて終値をつけた場合、当日の終値でポジションをクローズし利益確定します。
- エントリー後5日以内に利益確定条件が満たされなかった場合、強制損切りで退出します。
これにより、株価が反転上昇する重要なポイント付近でロングエントリーし、RSIの買われ過ぎシグナルで利益を確定するとともに、期限付きの損切りでリスクを管理します。
優位性分析
この戦略には以下の優位性があります。
- シンプルで実装が容易。2つの指標のみを監視し、明確なルールで迅速に取引判断が可能。
- トレンド反転の考え方を採用し、株価の反転上昇前に参入することで大きな値動きを捉える。
- 利益確定・損切りポイントを設定することで一回の損失を抑制し、安定した利益を実現。
- 資金回転が速く、長期間待つ必要がなく、何度も取引を繰り返せる。
- ほとんどの銘柄、特に短期的な安値反転の特徴が明確な銘柄に幅広く適用可能。
リスク分析
この戦略には以下のリスクも存在します。
- 反転のタイミングを誤ると損失につながる可能性がある。反転のタイミング判断には実際の経験が必要。
- 損切りポイントの設定が不適切だと損失を拡大させる恐れがある。適切な損切り幅を検討すべき。
- 相場が揉み合うと利益確定ポイントが発動しにくい。RSIパラメータの調整が考えられる。
- 短期取引にのみ適しており、長期保有には不向き。
- 高い回転率により取引コストとスリッページコストが増加。
改善方向
この戦略は以下の面からさらに最適化できます。
- トレンド指標(MACD、KDJなど)を組み合わせ、逆張り取引を回避する。
- 異なる日数の最安値パラメータをテストし、より適切な反転確認指標を見つける。
- RSIのパラメータをテストし、利益確定条件を最適化する。
- ATRを用いた動的損切りモジュールの追加を検討する。
- エントリータイミングの改善:反転確認後にエントリーを待ち、偽のブレイクアウトをフィルタリングする。
- 取引コストを考慮した合理的な利益確定目標を設定し、取引頻度を制御する。
まとめ
反転安値反発戦略は典型的な短期取引戦略です。安値反発の取引機会を捉え、シンプルな指標の組み合わせでエントリーとイグジットのタイミングを判断し、迅速な利益確定と損切りを実現します。バイ・アンド・ホールドと比較して、この戦略はリスク対収益率が高いという利点があります。パラメータとルールの継続的な最適化により、この戦略はほとんどの銘柄の特性に適応し、安定した収益を得ることができます。ただし、過剰な頻度の取引による取引コストの問題にも注意が必要です。総じて、反転安値反発戦略はシンプルで実用的かつ効果的な株式市場取引戦略です。
||
Overview
The Low Point Rebound strategy is a simple and effective stock trading strategy. It captures low point rebound opportunities and enters the market when stock prices reverse upwards. It aims to profit in the short term and exit quickly with stop loss.
Strategy Logic
This strategy mainly uses two indicators: the 5-day lowest price to determine entry timing and the 2-day RSI to determine exit timing.
The specific process is as follows:
-
If today's close is below yesterday's 5-day lowest price, go long at today's close.
-
If 2-day RSI closes above the overbought level (default 50), close long position at today's close to take profit.
-
If held for more than 5 days without meeting profit taking criteria, forced exit with stop loss.
This allows us to enter long around key points when prices reverse upwards. RSI overbought signals are used to lock in profits, while stop loss controls risk.
Advantage Analysis
This strategy has the following advantages:
-
Simple to implement. Only two indicators to monitor, clear rules for quick decisions.
-
Captures significant trends by entering before reversal upswings.
-
Stop loss and take profit points control single trade loss and achieve stable profits.
-
High capital turnover without long waiting times. Can repeat trades frequently.
-
Widely applicable to most stocks, especially those with clear short-term low price reversals.
Risk Analysis
There are also some risks to this strategy:
-
Picking wrong reversal timing may lead to losses. Identifying reversals needs experience.
-
Improper stop loss placement may magnify losses. Reasonable stop loss percentage should be considered.
-
Price whipsaws may prevent take profit from triggering. RSI parameters could be adjusted.
-
Only suitable for short-term trading, not long term holds.
-
High turnover increases transaction and slippage costs.
Improvement Directions
This strategy can be further optimized in the following aspects:
-
Add trend indicators to avoid counter trend trades. E.g. MACD, KDJ etc.
-
Test different lowest price lookback periods to find better reversal confirmation.
-
Optimize RSI parameters for better profit taking levels.
-
Consider dynamic stop loss module using ATR.
-
Improve entry timing with confirmation after reversal signal. Filter fake breakouts.
-
Set reasonable profit targets considering transaction costs. Control trade frequency.
Conclusion
The Low Point Rebound strategy is a typical short-term trading strategy. It capitalizes on low point reversal opportunities using simple indicators for entry and exit timing, enabling quick profit taking and stopping losses. Compared to buy and hold, it offers higher risk adjusted returns. With continuous parameter and rule optimization, this strategy can be adapted for most stocks to generate steady profits. But trading costs from high turnover should be monitored. Overall, the Low Point Rebound is an easy to use yet effective strategy for stock market trading.
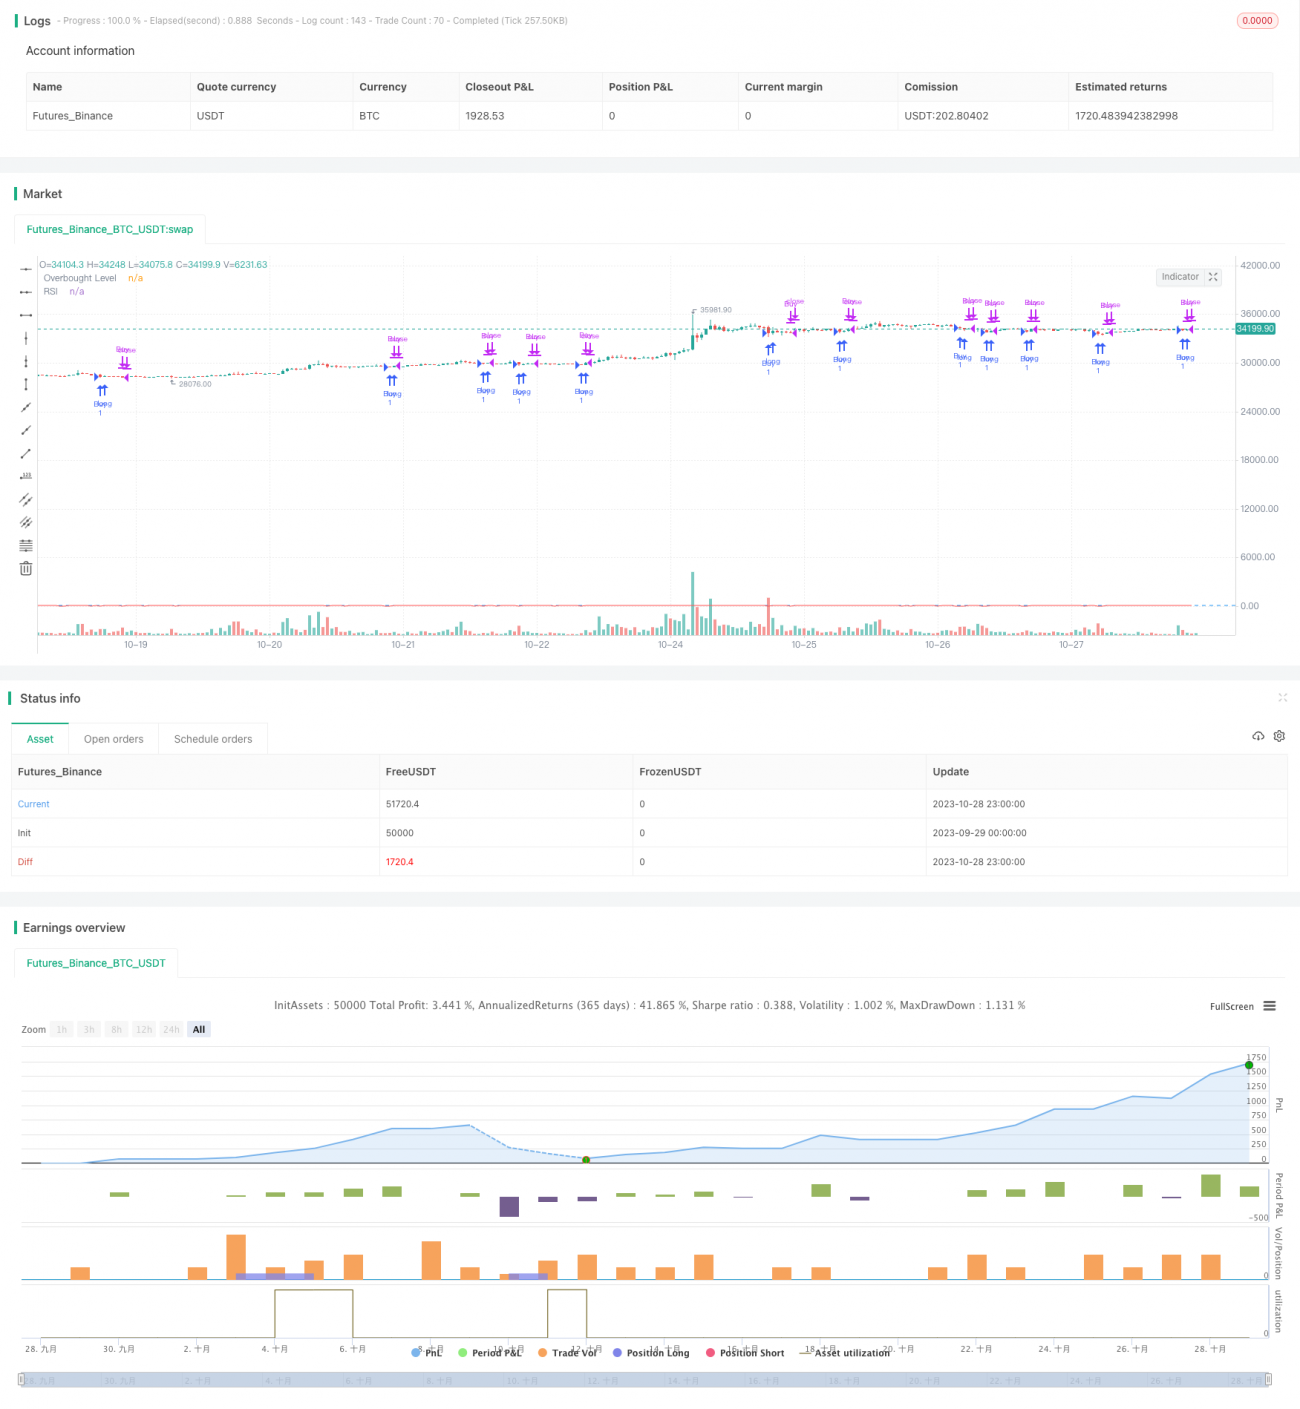
/*backtest
start: 2023-09-29 00:00:00
end: 2023-10-29 00:00:00
period: 1h
basePeriod: 15m
exchanges: [{"eid":"Futures_Binance","currency":"BTC_USDT"}]
*/

// This source code is subject to the terms of the Mozilla Public License 2.0 at https://mozilla.org/MPL/2.0/
// © hobbiecode

// If today’s close is below yesterday’s five-day low, go long at the close.- 1