ストキャスティクスRSIとEMAに基づく自律型バイスイングスキャルパー戦略

1
Follow
1779
Followers
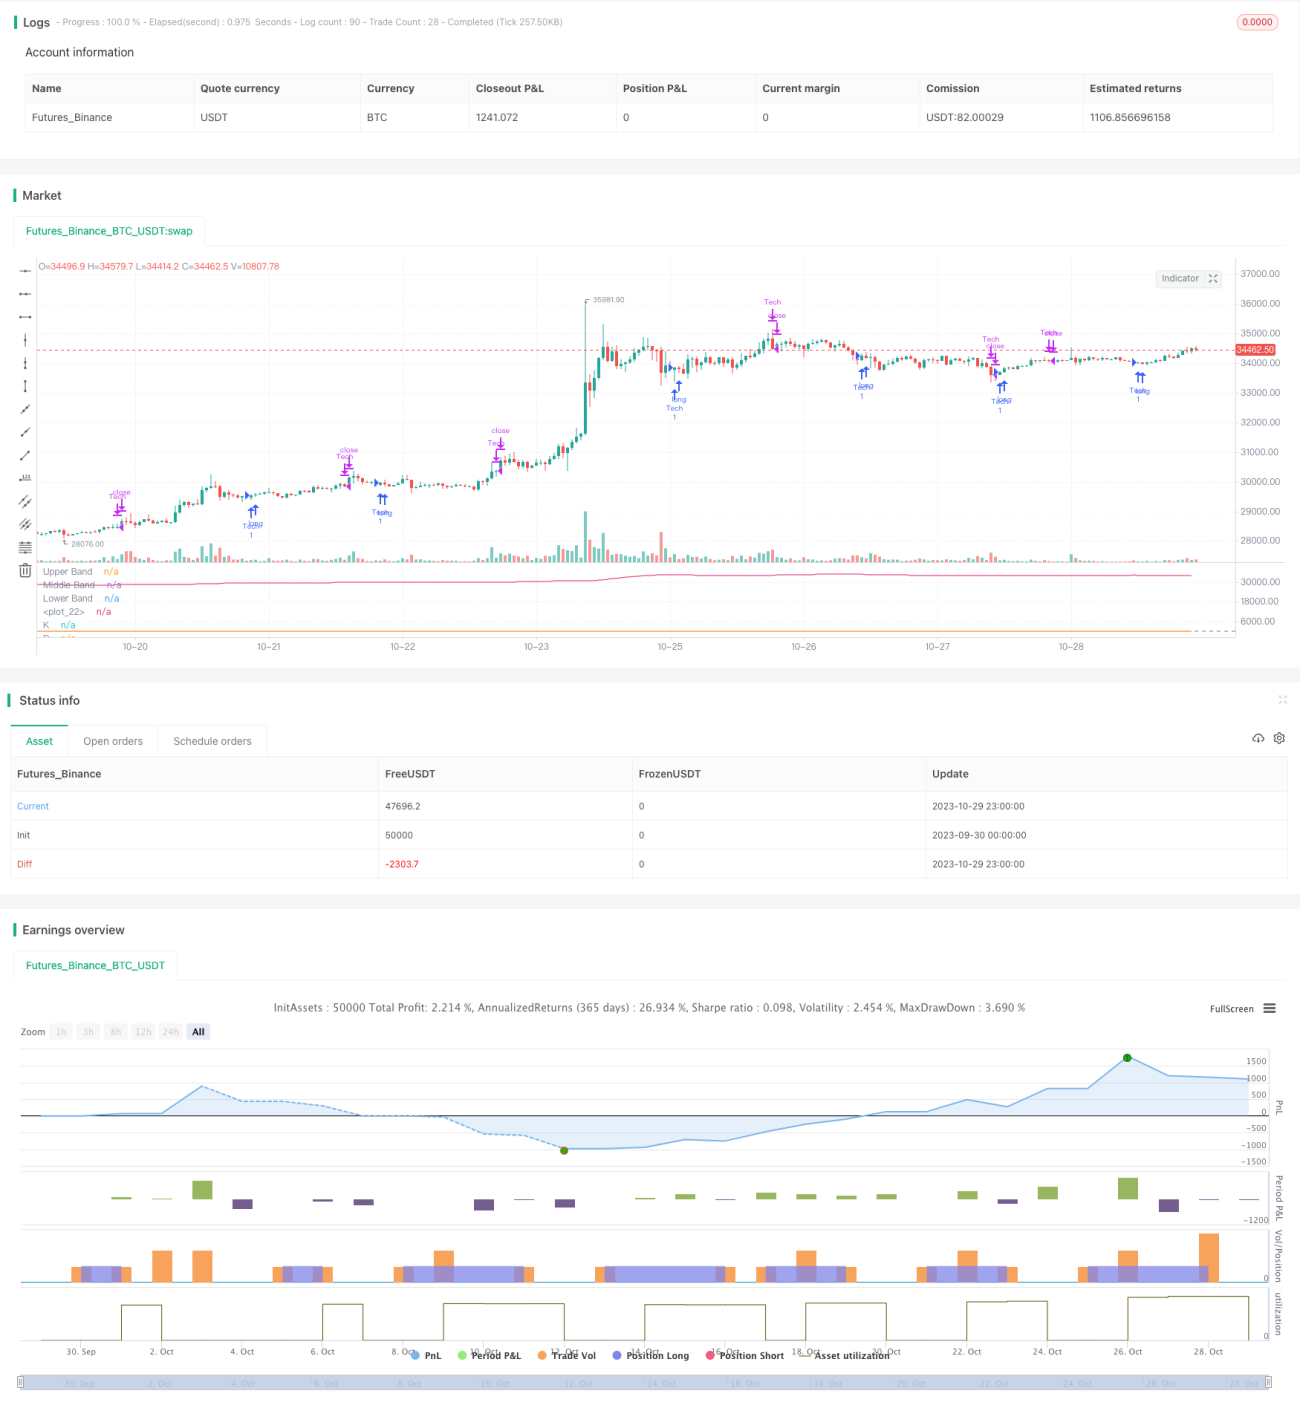
概要
この戦略は,ランダムな指数平移平均 ((RSI)) と指数移動平均 ((EMA)) の指標に基づく自主的なコインの購入と保有のスキャルパー取引戦略を実現することを目的としている.それは5分間のKラインに適用され,BTCに対して最適化されている.戦略の目的は横断または大幅な下落のないときにできるだけ多くのコインを保有することである.
戦略原則
この戦略は,RSI指標が超買超売領域にあるかどうかを判断するために使用され,ランダムなRSI指標のK値とD値の関係と組み合わせて,買入と売却のシグナルを発信する.
ランダムなRSIのK線が20を下回ると,超売りとみなされ,K線がD線より大きいときに買取シグナルが生じます.その後,3つの条件に基づいて,売却が判断されます: 1) 価格が1%以上上昇した後にEMAの反転が発生する; 2) ランダムなRSI指標のK線がD線を下回ると; 3) ストップ価格が入場価格の98.5%に達すると.
また,短期EMAが上昇後,下方へ逆転すると,売り込みの信号として判断されます.
戦略的優位性
- ランダムなRSI指標を用いて購入のタイミングを判断することはより信頼性が高く,偽の突破を効果的にフィルターすることができます.
- EMAの指標と組み合わせると,トレンドの変化のタイミングをよく判断できます.
- ストップ・ロスを採用することで,損失を効果的にコントロールできます.
- コインをできるだけ多く持っていれば,取引の頻度や手数料を減らすことができます.
戦略リスク
- RSI指標が偽信号を発する可能性.RSIパラメータを適切に調整して最適化することができる.
- ストップ・プライスを小さすぎると,損失が拡大する可能性があります. ストップ・プライスを適切に調整できます.
- EMA指標のパラメータを正しく設定しない場合,トレンドの変化のタイミングを逃す可能性があります.異なるEMA周期のパラメータをテストすることができます.
最適化の方向
- 異なるRSIとランダムなRSIパラメータの設定をテストし,最適なパラメータの組み合わせを探します.
- 損失と利益の引き戻しを防ぐために,異なるストップ・ローズを試す
- EMAの長期・短期組み合わせをテストし,トレンド変化を決定する最適のパラメータを判断する.
- 購入・売却のタイミングの判断の精度を高めるために,他の指標の追加を検討する
要約する
この戦略は,ランダムなRSIやEMAなどの複数の指標の優位性を統合し,より堅牢な方法を使用して,買いと売却のタイミングを判断する.パラメータの最適化とリスク管理により,戦略の収益率と安定性をさらに向上させることができます.全体的に,この戦略の論理は合理的で,実際の検証と最適化の価値があります.
Source
Pine
/*backtest
start: 2023-09-30 00:00:00
end: 2023-10-30 00:00:00
period: 1h
basePeriod: 15m
exchanges: [{"eid":"Futures_Binance","currency":"BTC_USDT"}]
*/

//@version=5
strategy(title="Stochastic RSI W Auto Buy Scalper Scirpt III ", shorttitle="Stoch RSI_III", format=format.price, precision=2)
smoothK = input.int(3, "K", minval=1)
smoothD = input.int(3, "D", minval=1)Strategy parameters
Related strategies
Comment
All comments (0)
No data
- 1