勢いを追うシャフトトレンドサイクル戦略

1
Follow
1779
Followers
概要
この戦略は,Schaffのトレンドサイクル指標に基づいて,Stoch RSIの超買超売原理を組み合わせて,動向指標によってトレンドの判断と追跡を実現します. 価格が超売区から超買区に突破すると,多めにします. 価格が超買区から超売区に突破すると,空っぽにします. この戦略は,価格のトレンドの変化点を捉え,ポジションを動的に調整し,価格の動きを追跡します.
戦略原則
-
- MACDを計算し,Fast Lengthのデフォルト値は23で,Slow Lengthのデフォルト値は50である.MACDは,短期と長期の移動平均の差値を反映し,価格の動きを判断するために使用される.
-
- MACDをストックRSI処理して,K値を形成し,その中のサイクル長が10のデフォルト値で,MACDの動態指標を反映した超買超売である.
-
- K値に対する重量移動平均は,D値を形成し,1st %D Lengthのデフォルト値は3で,K値内のノイズを除去する.
-
- D値をStoch RSI処理で再処理し,初期STC値を形成し,2nd %D Lengthのデフォルト値は3で,正確なオーバーバイオーバーセールシグナルを形成する.
-
- 初期 STC 値に対する重み付けの移動平均で,最終的な STC 値が得られ,範囲は0-100。 STC 75 以上は超買区,25 以下は超売区。
-
- STCが下から上へ25を突破すると,多めにやります.STCが上から下へ75を突破すると,空いてください.
戦略的優位性
-
- STC指数は,Stoch RSIの設計を組み合わせて,強烈なトレンドシグナルを形成するために,オーバーバイオーバーセール領域を明確に識別できます.
-
- ダブルストックRSIフィルターにより,偽突破を効果的にフィルターできます.
-
- STCは0-100の標準化範囲を形成し,機械化された取引信号の形成を容易にする.
-
- この戦略の反省は,視覚的なブレイクマークとテキストポップアップアラームを実現し,取引機会を明確に直感的に捉えます.
-
- 戦略は,過度に敏感な取引を避けるために,無意味な取引を効果的に制御するための最適化されたパラメータの組み合わせを採用しています.
戦略リスク
-
- STC指数はパラメータに敏感であり,異なる通貨と時間周期にパラメータの組み合わせを調整して市場の特徴に適合させる必要がある.
-
- 突破取引の戦略は簡単に騙され,リスクをコントロールするためにストップ・ロスを設定する必要があります.
-
- 低流動性の市場における偽の突破は,誤ったシグナルを誘発する可能性があるため,合成取引量などの指標を組み合わせてフィルタリングする必要があります.
-
- この戦略は,STC指数のみに基づいて,他の要因と組み合わせてトレンド確認を判断し,逆転停止を回避します.
-
- この地域での誤信号を避けるために,重要なサポートレジスタンスに注意する必要があります.
戦略最適化の方向性
-
- MACDのパラメータの組み合わせを,異なる周期と通貨に対応するように最適化します.
-
- ストック RSIのK値とD値のパラメータを最適化し,STC曲線を平ら化する。
-
- 取引量指標を組み合わせて,低流動性の市場における偽の突破を避ける.
-
- 他の指標の判断を加え,ブリン帯などのトレンドシグナルを確認する.
-
- モバイルストップまたはATRストップのようなストップメカニズムを追加します.
-
- トレンド確認を確実にするため,突破後に回調入入場などの入場位置の調整
要約する
シャフのトレンドサイクル戦略は,運動指数によって超買超売領域を判定し,これによって価格の中での短期トレンドの変化を判断する.この戦略は単純明快で,異なる市場のパラメータに応じて調整することができるが,被套のリスクも存在する.補助指標によって判断と止損を最適化して,強気なトレンドでより効果を発揮することができる.
Source
Pine
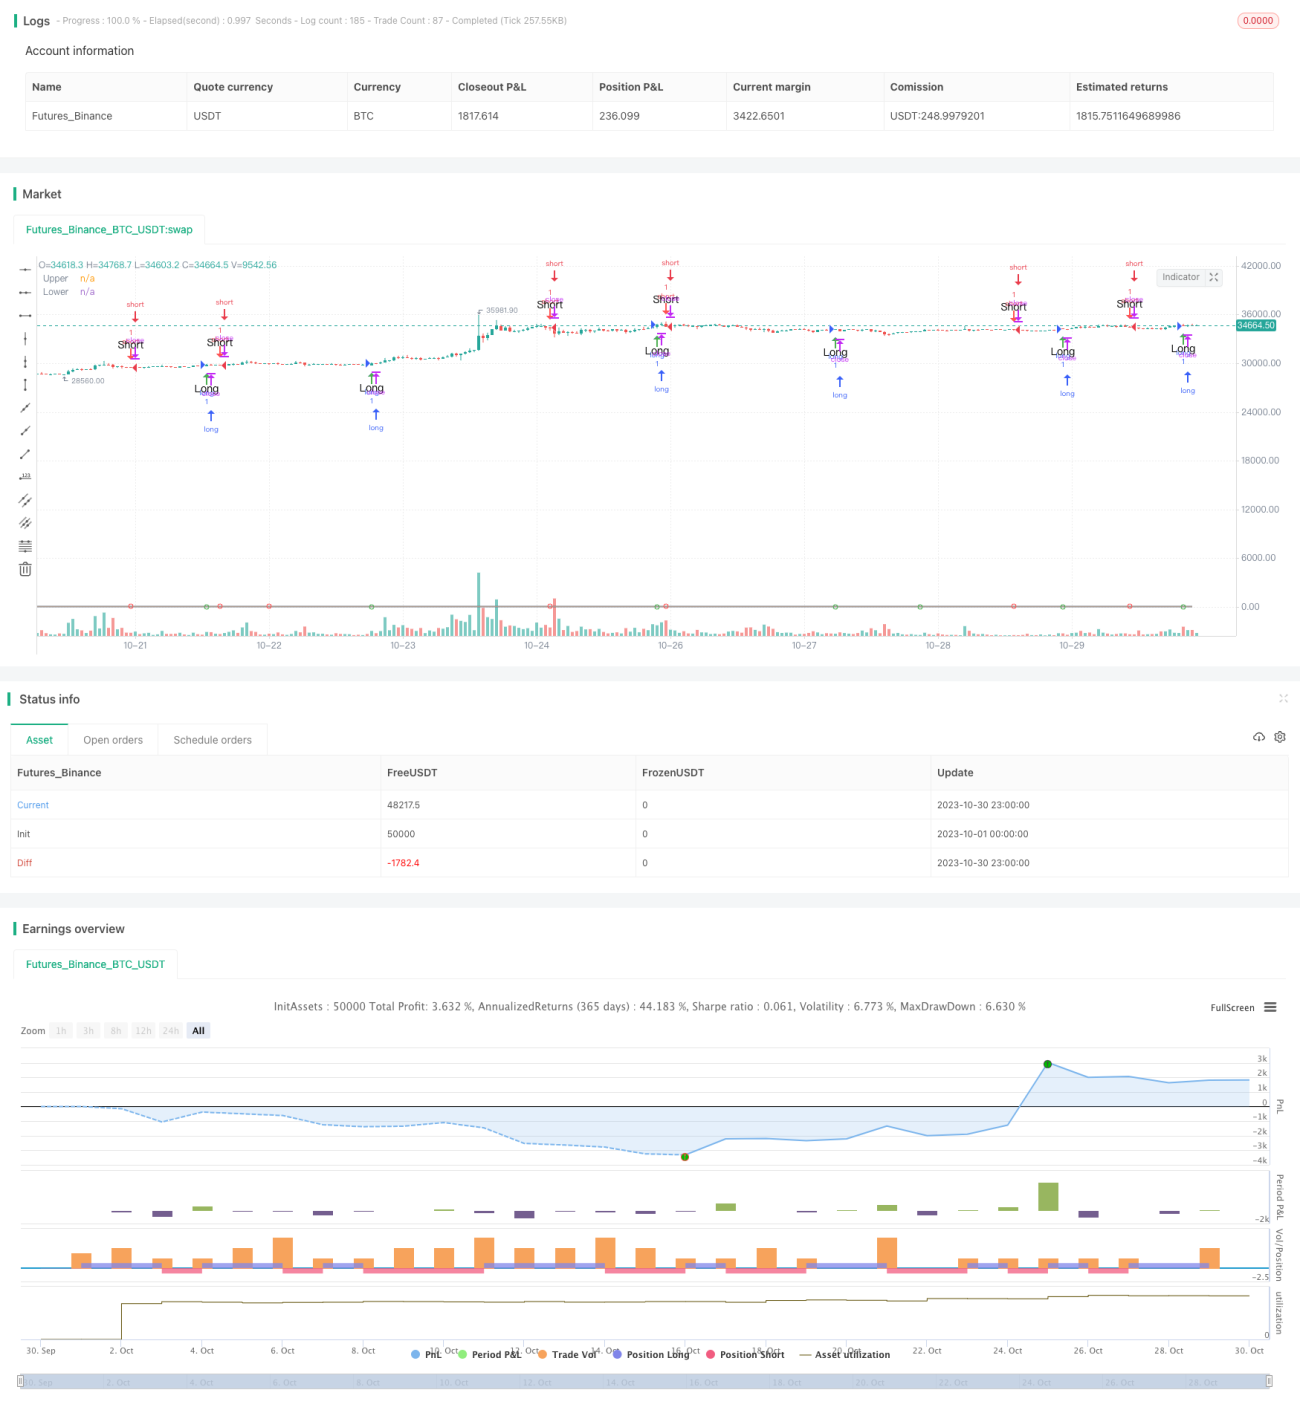
/*backtest
start: 2023-10-01 00:00:00
end: 2023-10-31 00:00:00
period: 1h
basePeriod: 15m
exchanges: [{"eid":"Futures_Binance","currency":"BTC_USDT"}]
*/

//@version=3
// Copyright (c) 2018-present, Alex Orekhov (everget)
// Schaff Trend Cycle script may be freely distributed under the MIT license.
strategy("Schaff Trend Cycle", shorttitle="STC Backtest", overlay=true)Strategy parameters
Related strategies
Comment
All comments (0)
No data
- 1