低点スキャンインテリジェント追跡方法


作成日: 2023-11-01 16:12:00 最終変更日: 2023-11-01 16:12:00
コピー: 2 クリック数: 650
1
フォロー
1617
フォロワー

低点スキャンインテリジェント追跡方法

概要

低点スキャニングスマートトラッキング法 (英:Low point scanning smart tracking method) は,反転しないForex取引戦略である.低点スキャナーを使用して最低点を探し,ハル移動平均と組み合わせて取引信号判断を行うことで,高い勝率を実現できる.

原則分析

この戦略は,まず低点スキャナーを使用して最低点を探します.低点スキャナーは,価格と取引量のRSI値を計算し,その後そのWMA曲線と比較して,RSI値がWMAより低ければ最低点であると判断します.

その後,戦略は,ハル移動平均を使って取引信号判断を行う.それは,短期のハルMAが長期のハルMAを突破するときに多し,下期のハルMAを突破するときに空し,2つの異なる周期のハルMAを計算する.

最後に,戦略は最低点のスキャンとHull MAの信号を組み合わせて,最低点のスキャンが最低点の信号を与える時のみ,Hull MAの取引信号を発信し,入場戦略を形成する.

市場最低値を特定し,トレンドを追跡することで,誤った入場タイミングを回避し,取引システムの勝率を向上させることができる.

優位分析

低点スキャニングの特徴は以下の通りです.

  1. 低点スキャナーを使用すると,市場の最低点を正確に識別し,高点で買い物を避ける.

  2. Hull MAはトレンド追跡の良い指標で,大きなトレンドを順番に捉えることができます.

  3. 低点スキャンとHull MAの相互検証を組み合わせて,大量のノイズをフィルターし,偽信号を減らすことができます.

  4. 漸進的な止損出場メカニズムは,利益を最大限にロックし,反転を避けるために使用されます.

  5. この戦略は反射指数駆動ではなく,歴史データを操作しない,真実で信頼性がある.

リスク分析

この戦略には以下のリスクがあります.

  1. 最低点スキャナーは,部分的な最低点を見逃し,取引機会を逃す可能性があります. スキャンの範囲を拡大するために,パラメータを適切に調整できます.

  2. 状況が激変して,ストープが打ち出されることがあります. ストープの範囲を適切に緩和し,ポジションの規模を合理的に制御することができます.

  3. パラメータの設定が不適切である場合,取引信号が過多または過少に発生する可能性があります.最適なパラメータの組み合わせを見つけるために,繰り返し最適化する必要があります.

  4. この策略は,トレンドが顕著なForex品種のみに適用され,整合・振動市場での取引には適さない.

最適化の方向

この戦略は以下の点で最適化できます.

  1. 低点スキャナーのパラメータを最適化して,低点をより正確に識別できるようにする.

  2. Hull MAのパラメータを最適化して,より正確にトレンドを追跡できるようにする.

  3. MACD,KDJなどの他の指標のフィルタを追加して,信号の信頼性を向上させる.

  4. 機械学習モデルの予測結果を追加し,取引シグナルの判断を補助する.

  5. 市場変動に応じて動的に調整できるように,ストップ・ローズ・メカニズムを最適化する.

  6. ポジション管理戦略を最適化して,資金管理規則に従ってポジションを動的に調整できるようにする.

要約する

低点スキャンインテリジェントトラッキング法は,高勝率の非反転のForex取引戦略である.それは,市場の最低点を正確に識別し,トレンドが明確であるときに順調に入場し,漸進的なストップロスを採用して利益をロックする.この戦略の最適化スペースは大きく,多方面から改善でき,強力な自動取引システムになる.
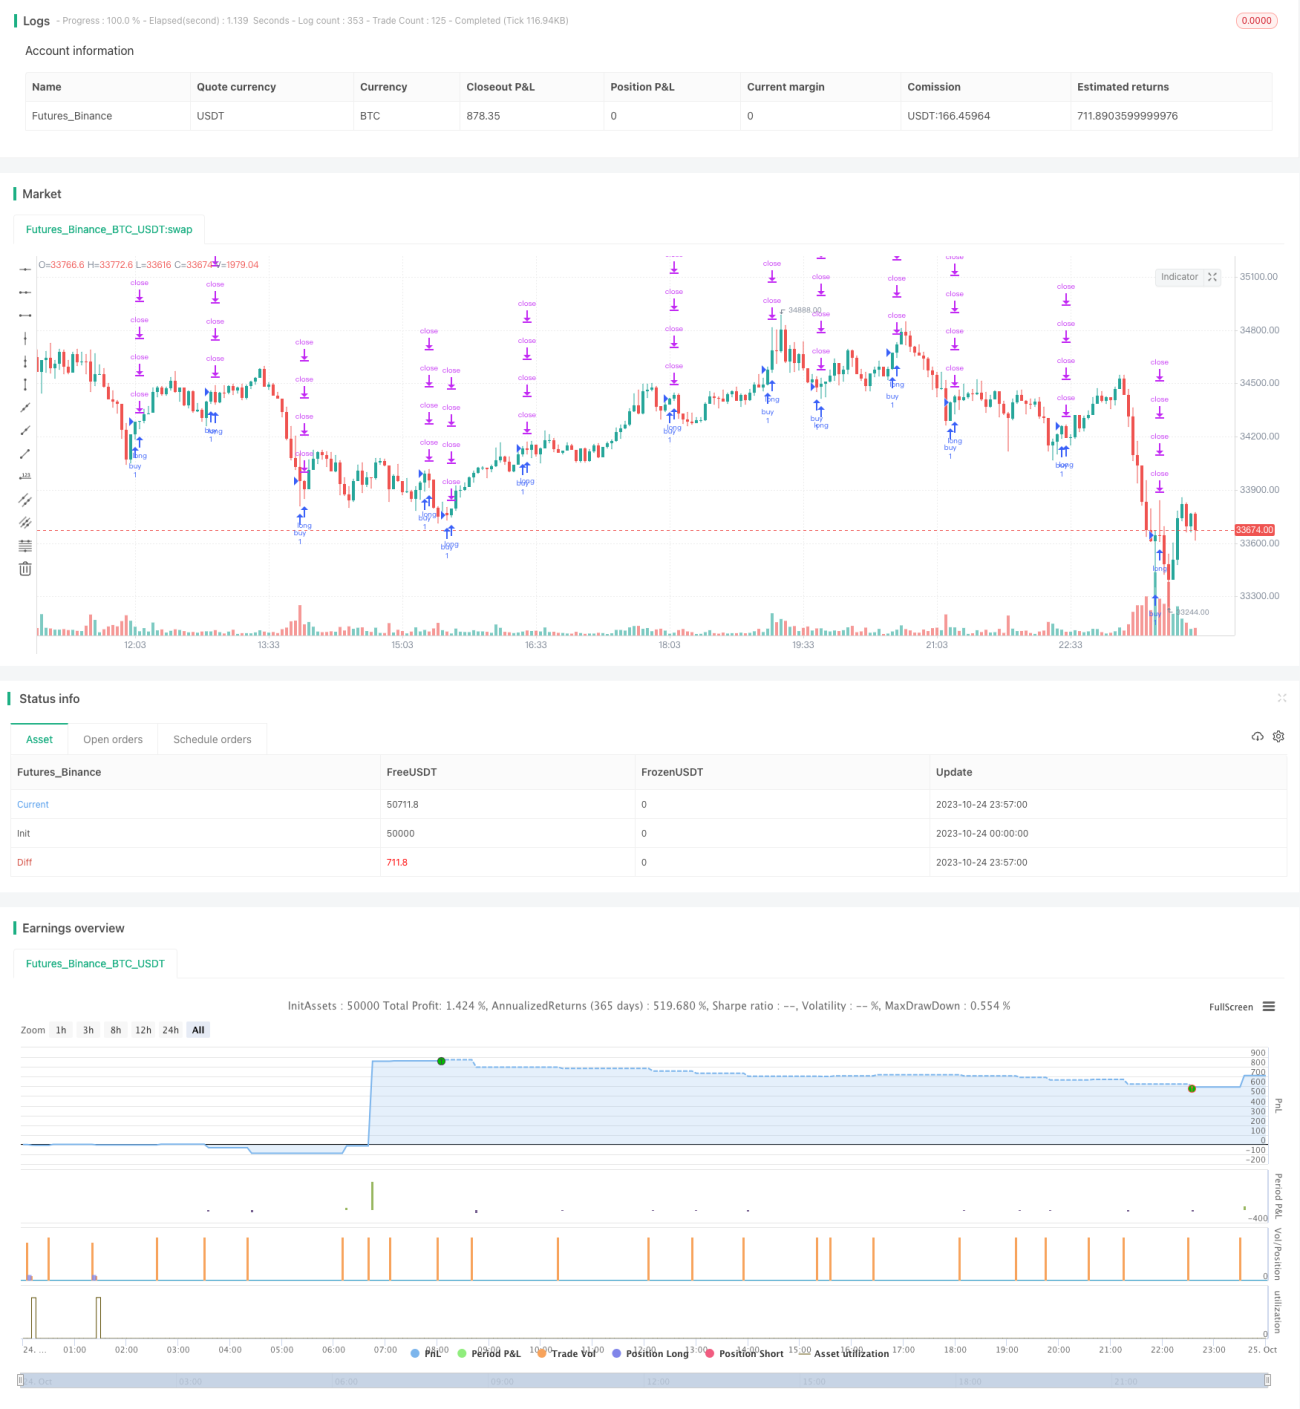
ストラテジーソースコード
/*backtest
start: 2023-10-24 00:00:00
end: 2023-10-25 00:00:00
period: 3m
basePeriod: 1m
exchanges: [{"eid":"Futures_Binance","currency":"BTC_USDT"}]
*/

// © theCrypster 2020

//@version=4
// strategy(title = "Low Scanner Forex strategy", overlay = false, pyramiding=1,initial_capital = 1000, default_qty_type= strategy.percent_of_equity, default_qty_value = 100, calc_on_order_fills=false, slippage=0,commission_type=strategy.commission.percent,commission_value=0)
strat_dir_input = input(title="Strategy Direction", defval="long", options=["long", "short", "all"])
strat_dir_value = strat_dir_input == "long" ? strategy.direction.long : strat_dir_input == "short" ? strategy.direction.short : strategy.direction.all
strategy.risk.allow_entry_in(strat_dir_value)
leng=1
p1=close[1]
min=input(1440)
len55 = timeframe.isintraday and timeframe.multiplier >= 1 ? 
   min / timeframe.multiplier * 7 : 
   timeframe.isintraday and timeframe.multiplier < 60 ? 
   60 / timeframe.multiplier * 24 * 7 : 7
//taken from https://www.tradingview.com/script/Ql1FjjfX-security-free-MTF-example-JD/
tf3 = input("W", type=input.resolution)
ti = change( time(tf3) ) != 0
T_c = fixnan( ti ? close : na )

vrsi = rsi(cum(change(T_c) * volume), leng)
pp=wma(vrsi,len55)

d=(vrsi[1]-pp[1])
min1 =input(60)
len100 = timeframe.isintraday and timeframe.multiplier >= 1 ? 
   min1 / timeframe.multiplier * 7 : 
   timeframe.isintraday and timeframe.multiplier < 60 ? 
   60 / timeframe.multiplier * 24 * 7 : 7
x=ema(d,len100)
//
zx=x/-1
col=zx > 0? color.lime : color.orange
plot(zx,color=col,linewidth=1)
//

tf10 = input("W", title = "Timeframe", type = input.resolution, options = ["1", "5", "15", "30", "60","120", "240","360","720", "D", "W"])

length = input(24, title = "Period", type = input.integer)
shift = input(1, title = "Shift", type = input.integer)

hma(_src, _length)=>
    wma((2 * wma(_src, _length / 2)) - wma(_src, _length), round(sqrt(_length)))
    
hma3(_src, _length)=>
    p = length/2
    wma(wma(close,p/3)*3 - wma(close,p/2) - wma(close,p),p)


a = security(syminfo.tickerid, tf10, hma(close, length))
b =security(syminfo.tickerid, tf10, hma3(close[1], length)[shift])
//plot(a,color=color.gray)
//plot(b,color=color.yellow)
close_price = close[0]
len = input(25)

linear_reg = linreg(close_price, len, 0)


//plot(linear_reg, color=color.blue, title="LR", linewidth=3)

buy=crossover(linear_reg, b) 
sell=crossunder(linear_reg, b) 
//
// Time period input
testStartYear = input(2016, "BACKTEST START YEAR", minval = 1980, maxval = 2222) 
testStartMonth = input(06, "BACKTEST START MONTH", minval = 1, maxval = 12)
testStartDay = input(01, "BACKTEST START DAY", minval = 1, maxval = 31)
testPeriodStart = timestamp(testStartYear,testStartMonth,testStartDay,0,0)
testStopYear = input(2222, "BACKTEST STOP YEAR", minval=1980, maxval = 2222)
testStopMonth = input(12, "BACKTEST STOP MONTH", minval=1, maxval=12)
testStopDay = input(31, "BACKTEST STOP DAY", minval=1, maxval=31)
testPeriodStop = timestamp(testStopYear, testStopMonth, testStopDay, 0, 0)
testPeriod = time >= testPeriodStart and time <= testPeriodStop ? true : false
l = crossover(zx,0) or buy
        
if l and testPeriod
    strategy.entry("buy", strategy.long)

per(pcnt) =>
    strategy.position_size != 0 ? round(pcnt / 100 * strategy.position_avg_price / syminfo.mintick) : float(na)
stoploss=input(title=" stop loss", defval=25, minval=0.01)
los = per(stoploss)
q1=input(title=" qty_percent1", defval=25, minval=1)
q2=input(title=" qty_percent2", defval=25, minval=1)
q3=input(title=" qty_percent3", defval=25, minval=1)
tp1=input(title=" Take profit1", defval=0.5, minval=0.01)
tp2=input(title=" Take profit2", defval=1, minval=0.01)
tp3=input(title=" Take profit3", defval=1.5, minval=0.01)
tp4=input(title=" Take profit4", defval=2, minval=0.01)
strategy.exit("x1", qty_percent = q1, profit = per(tp1), loss = los)
strategy.exit("x2", qty_percent = q2, profit = per(tp2), loss = los)
strategy.exit("x3", qty_percent = q3, profit = per(tp3), loss = los)
strategy.exit("x4", profit = per(tp4), loss = los)