双方向反転とモメンタム移動平均戦略


作成日: 2023-11-06 16:18:18 最終変更日: 2023-11-06 16:18:18
コピー: 0 クリック数: 639
1
フォロー
1621
フォロワー

双方向反転とモメンタム移動平均戦略

概要

この戦略は,反転戦略と動態指標を組み合わせて使用する組み合わせの戦略である.これは,双方向の反転戦略とシャンシェリ動態振動器を統合し,反転の機会を検出しながら動態信号を検証し,より信頼性の高い取引信号を実現することを目的としている.

戦略原則

この戦略は2つの部分から構成されています.

第1部は双方向逆転戦略である.これは,前2日の閉盘価格の変化を検知することによって,逆転の機会を判断する.具体的には,前2日の閉盘価格が減少し,その日の閉盘価格が前1日の閉盘価格より上昇し,ランダムな指標が設定レベルより低い場合は,買入信号である.逆に,前2日の閉盘価格が増加し,その日の閉盘価格が前1日の閉盘価格より下落し,その日の閉盘指標が設定レベルより高い場合は,売り信号である.

2つ目の部分は香動量振動器である.これは,価格の変化量と一定の周期内の平均の変化量の大小を比較して動力を判断する.動力の指標が設定された上限より高い場合は,買入信号;設定された下限より低い場合は,販売信号である.

この戦略は,反転点を判断する反転点と動量指標を検証する動量状況を統合した二方向の反転を使用し,両者の信号が同方向である場合にのみ,実際の買出信号が生じる.

戦略的優位性

  • 二重検証機構,偽信号を回避し,信号の信頼性を高める.反転策は潜在的反転点を判断し,動量指標は反転信号の有効性を検証する.

  • 逆転戦略とトレンド戦略を組み合わせて,逆転とトレンドの両方を考慮し,市場機会を柔軟に捉える.

  • 動量指標を導入し,反転の罠を回避し,動量確認時にのみ取引する.

  • 複数のパラメータを調整し,異なる市場向けに最適化できます.

戦略リスク

  • 逆回線信号は回調深度が高くなり,合理的な止損が必要となる.

  • ターニングポイントの捉え方は精度が必要で,誤判が起こりうる.

  • 動量指標が遅滞し,最適の反転時刻を逃す可能性があります.

  • パラメータの設定は,特定の市場に応じて慎重に最適化され,不適切な設定は取引リスクを増加させる可能性があります.

合理的な止損によって単一損失を制御できる.パラメータ設定を最適化し,パラメータ安定性を追求する.逆転信号の誘発条件を適切に緩和し,一定余裕を保持するなど,リスクを減らす方法がある.

戦略最適化の方向性

  • 異なる反転パラメータの組み合わせをテストし,市場の反転に敏感なパラメータ設定を探します.

  • 比較強さ指数や交差量の変化率など,様々な動力の指標を試す.

  • 突破などのフィルタリング条件を追加し,非重要な転換点の取引を避ける.

  • ストップ・ロスの戦略を評価し,最大限の撤収可能なストップ・ロスを探す.

  • ポジション管理戦略を評価し,市場状況に応じてポジションの大きさを調整する.

要約する

この戦略は,逆転戦略と動態戦略の優位性を融合し,信号信頼性が高く,市場機会を柔軟に捉える優位性を有する.パラメータ最適化,ストップダスト管理,ポジションコントロールなどの方法によってリスクを軽減し,戦略の安定性と収益性を向上させる.全体的に,この戦略は,逆転戦略とトレンド戦略の有効な組み合わせを画期的に探求し,さらなる研究と応用に値する.
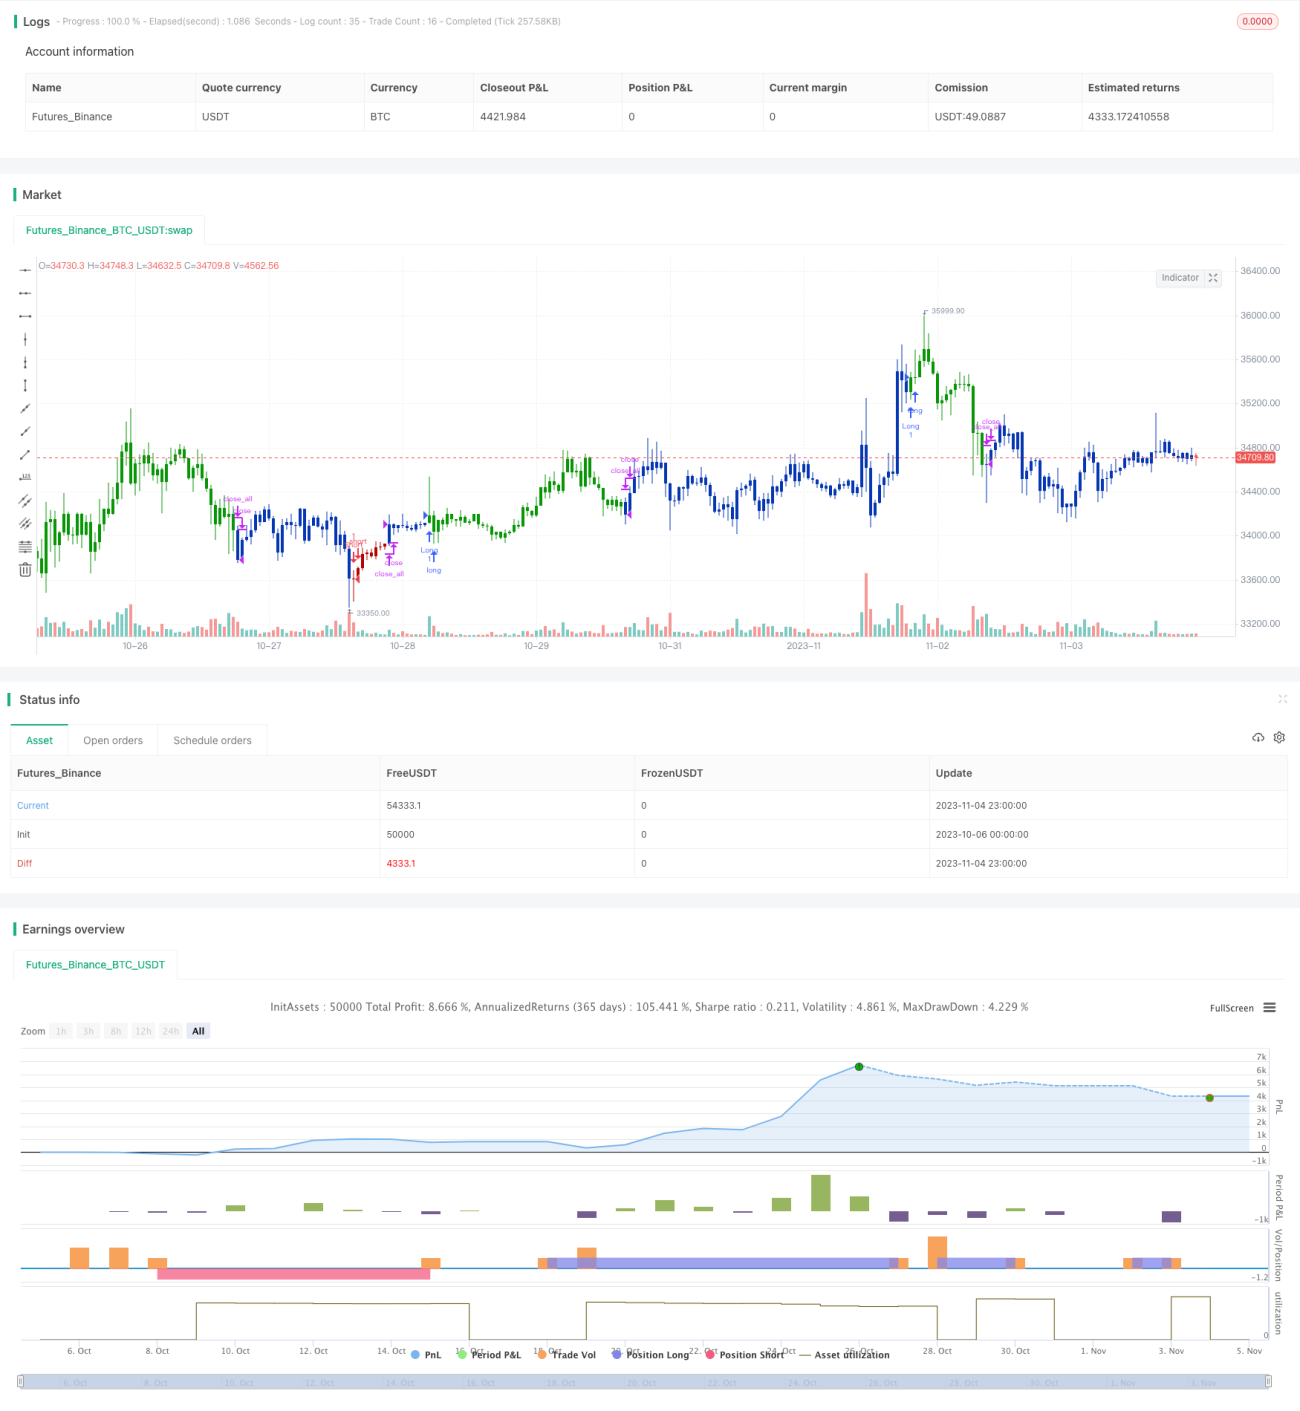
ストラテジーソースコード
/*backtest
start: 2023-10-06 00:00:00
end: 2023-11-05 00:00:00
period: 1h
basePeriod: 15m
exchanges: [{"eid":"Futures_Binance","currency":"BTC_USDT"}]
*/

//@version=4
////////////////////////////////////////////////////////////
//  Copyright by HPotter v1.0 18/08/2019
// This is combo strategies for get a cumulative signal. 
//
// First strategy
// This System was created from the Book "How I Tripled My Money In The 
// Futures Market" by Ulf Jensen, Page 183. This is reverse type of strategies.
// The strategy buys at market, if close price is higher than the previous close 
// during 2 days and the meaning of 9-days Stochastic Slow Oscillator is lower than 50. 
// The strategy sells at market, if close price is lower than the previous close price 
// during 2 days and the meaning of 9-days Stochastic Fast Oscillator is higher than 50.
//
// Second strategy
//    This indicator plots Chande Momentum Oscillator. This indicator was 
//    developed by Tushar Chande. A scientist, an inventor, and a respected 
//    trading system developer, Mr. Chande developed the CMO to capture what 
//    he calls "pure momentum". For more definitive information on the CMO and 
//    other indicators we recommend the book The New Technical Trader by Tushar 
//    Chande and Stanley Kroll.
//    The CMO is closely related to, yet unique from, other momentum oriented 
//    indicators such as Relative Strength Index, Stochastic, Rate-of-Change, 
//    etc. It is most closely related to Welles Wilder`s RSI, yet it differs 
//    in several ways:
//        - It uses data for both up days and down days in the numerator, thereby 
//          directly measuring momentum;
//        - The calculations are applied on unsmoothed data. Therefore, short-term 
//          extreme movements in price are not hidden. Once calculated, smoothing 
//          can be applied to the CMO, if desired;
//        - The scale is bounded between +100 and -100, thereby allowing you to 
//          clearly see changes in net momentum using the 0 level. The bounded scale 
//          also allows you to conveniently compare values across different securities.
//
// WARNING:
// - For purpose educate only
// - This script to change bars colors.
////////////////////////////////////////////////////////////
Reversal123(Length, KSmoothing, DLength, Level) =>
    vFast = sma(stoch(close, high, low, Length), KSmoothing) 
    vSlow = sma(vFast, DLength)
    pos = 0.0
    pos := iff(close[2] < close[1] and close > close[1] and vFast < vSlow and vFast > Level, 1,
	         iff(close[2] > close[1] and close < close[1] and vFast > vSlow and vFast < Level, -1, nz(pos[1], 0))) 
	pos

CMO(Length, TopBand, LowBand) =>
    pos = 0
    xMom = abs(close - close[1])
    xSMA_mom = sma(xMom, Length)
    xMomLength = close - close[Length]
    nRes = 100 * (xMomLength / (xSMA_mom * Length))
    pos :=  iff(nRes > TopBand, 1,
	         iff(nRes <= LowBand, -1, nz(pos[1], 0))) 
    pos

strategy(title="Combo Backtest 123 Reversal & Chande Momentum Oscillator", shorttitle="Combo", overlay = true)
Length = input(14, minval=1)
KSmoothing = input(1, minval=1)
DLength = input(3, minval=1)
Level = input(50, minval=1)
//-------------------------
LengthCMO = input(9, minval=1)
TopBand = input(70, minval=1)
LowBand = input(-70, maxval=-1)
reverse = input(false, title="Trade reverse")
posReversal123 = Reversal123(Length, KSmoothing, DLength, Level)
posCMO = CMO(LengthCMO, TopBand, LowBand)
pos = iff(posReversal123 == 1 and posCMO == 1 , 1,
	   iff(posReversal123 == -1 and posCMO == -1, -1, 0)) 
possig = iff(reverse and pos == 1, -1,
          iff(reverse and pos == -1 , 1, pos))	   
if (possig == 1) 
    strategy.entry("Long", strategy.long)
if (possig == -1)
    strategy.entry("Short", strategy.short)	 
if (possig == 0) 
    strategy.close_all()
barcolor(possig == -1 ? #b50404: possig == 1 ? #079605 : #0536b3 )