飛龍トレンド戦略


作成日: 2023-11-07 14:57:23 最終変更日: 2023-11-07 14:57:23
コピー: 0 クリック数: 847
1
フォロー
1621
フォロワー

飛龍トレンド戦略

概要

飛龍トレンド戦略は,移動平均の種類,長さ,偏移量を調整し,異なる色のトレンド帯を描画することで,トレンドの判断と取引信号の生成を実現します. この戦略は,異なる時間周期で最適なパラメータの組み合わせを見つけ,トレンド判断の正確性と取引リスクの間のバランスを取ることができます.

戦略原則

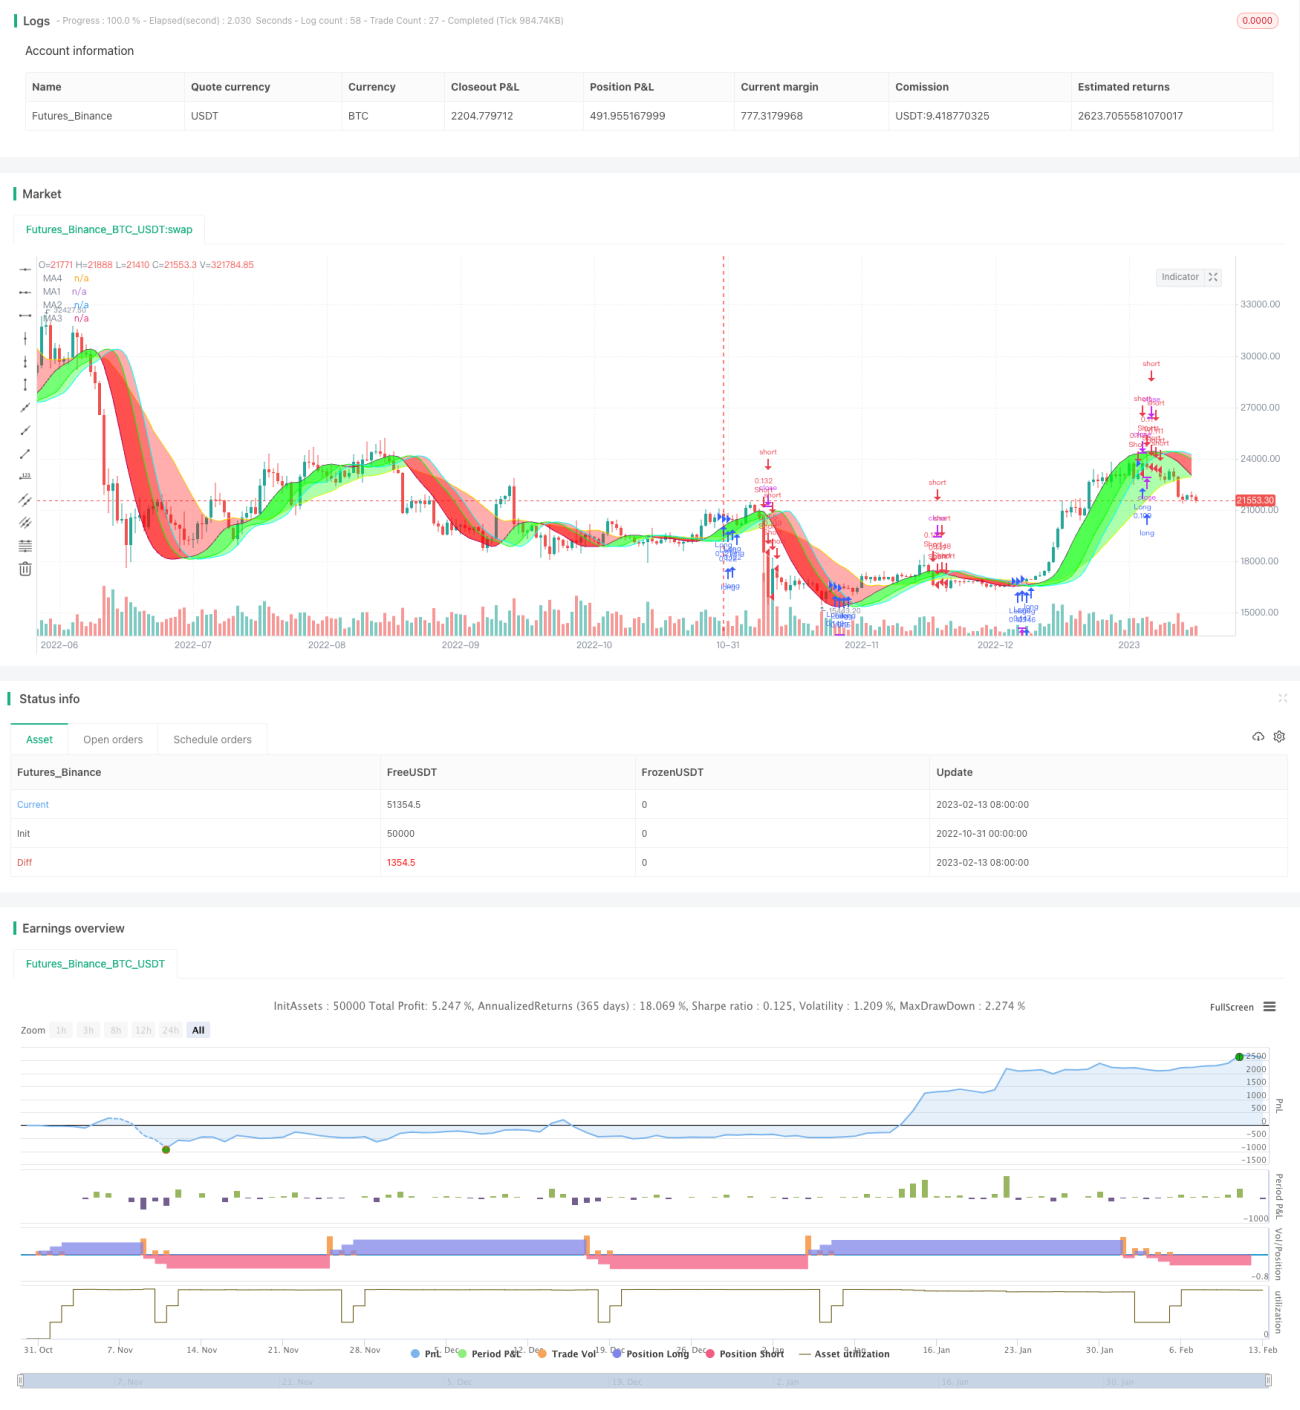
この戦略は,MA1とMA4という2つの移動平均を用いてトレンド帯を描画します.MA1は高速移動平均であり,MA4は遅い移動平均です.同時に,MA1は3つの偏移量 (オフセット1,オフセット2,オフセット3) を設定し,MA2とMA3を形成します.価格線が異なる移動平均を横断すると,異なるレベルの取引信号が形成されます.

ユーザーは5種類のリスクレベルを選択できます.異なるリスクレベルでは,異なる移動平均を横切るだけで取引信号が形成されます.リスクは,高から低い順にMA1 Offset1,MA2,MA3,MA4です.すべてのトレンド帯の色は一致しています.トレンド帯の色は現在のトレンドの方向を示し,緑は上昇傾向,赤は下降傾向です.

また,この戦略は,ストップ・ロスの使用を許可し,長ポジション,短ポジション,または双方向の取引を選択することができます.

優位分析

  • 異なる時間帯で最適なパラメータの組み合わせを見つけることができ,より広い市場環境に対応します.
  • 選択可能な移動平均の種類を多く提供し,異なる品種に最適化できます.
  • 調整可能な偏差値が戦略の核心であり,トレンドを正確に判断します.
  • リスクとリターンのバランスをとる 選択可能なリスクレベル
  • 複数のパラメータを柔軟に組み合わせ,最適化スペースを広げる
  • 視覚的なトレンド帯は,明確な視覚的な取引信号を形成します.
  • リスク管理のための Stop Loss 機能

リスク分析

  • 高リスク等級では,誤信号が発生しやすいので,リスク等級を下げるかパラメータを調整する
  • 傾向が逆転すると,連鎖的な止損の退出のリスクが生じます.
  • 異なる品種は,異なるテストと最適化パラメータを必要とし,同じパラメータをすべて適用することはできません.
  • 高頻度取引では, 遅い移動平均を導き, 速い移動平均に調整する必要があります.
  • パラメータの最適化が不適切である場合,過度に敏感または鈍化になり,テストを何度も最適化する必要があります.

リスクレベルを段階的に下げる,パラメータの組み合わせテストを増やし,異なる品種ごとにパラメータを最適化することでリスクを制御および軽減することができます.

最適化の方向

  • 移動平均の組み合わせを試してみましょう.
  • 縦軸の長さを測り,長さのパラメータを測り,最適な長さを測る
  • 偏移の調整は最適化に役立ちます
  • 異なる品種による分割最適化パラメータ
  • ストップポイントを最適化し,ストップが必要かどうかを検討する
  • 異なる取引規則の組み合わせを試す
  • フィルターに最適化が必要かどうかを評価する
  • トレンド強度指数などの追加を検討する

要約する

飛龍トレンド戦略は,移動平均線の巧妙な組み合わせによって,視覚的なトレンド取引システムを設計している.この戦略は,パラメータが調整可能であり,異なる品種,市場環境に対して細かく最適化され,安定性と敏さの間の最適なバランスをとることができる.複数のパラメータの組み合わせは,最適化のための十分なスペースを提供します.全体的に,この戦略は,新しいアイデア,論理的に合理的で,非常に強力な実用性を持っています.

ストラテジーソースコード
/*backtest
start: 2022-10-31 00:00:00
end: 2023-02-14 00:00:00
period: 1d
basePeriod: 1h
exchanges: [{"eid":"Futures_Binance","currency":"BTC_USDT"}]
*/

// This source code is subject to the terms of the Mozilla Public License 2.0 at https://mozilla.org/MPL/2.0/
// © MarkoP010 2023

//@version=5
//The basic idea of the strategy is to select the best set of MAs, types, lenghts and offsets, which draws red trend bands for downtrend (and green for uptrend).
//Strategy executes by selected risk level either when there is MA crossover with price (MA1 Offset1 on Highest risk level, MA2 on Low risk level) or three bands with the same color on at the same time (on Lowest risk level).
//Strategy plots user selectable Moving Average lines and a colored trend band between the MA lines. The trend bands can be turned off individually if required.
//The Offset option shifts the selected MA with the set number of steps to the right. That is where the Magic happens and the Dragon roars!

//Strategy version 1.0
strategy("Flying Dragon Trend Strategy", shorttitle="FD Trend Strategy", overlay=true, pyramiding=3, initial_capital=100000, default_qty_type=strategy.percent_of_equity, default_qty_value=5, commission_type=strategy.commission.cash_per_order, commission_value=10, calc_on_order_fills=false, process_orders_on_close=true)

strDirection = input.string(defval="Both", title="Strategy Direction", options=["Both", "Long", "Short"], group="Strategy") //Strategy direction selector by DashTrader
strSelection = strDirection == "Long" ? strategy.direction.long : strDirection == "Short" ? strategy.direction.short : strategy.direction.all //Strategy direction selector by DashTrader
strategy.risk.allow_entry_in(strSelection)

riskLevel = input.string(defval="Medium", title="Risk Level", options=["Highest", "High", "Medium", "Low", "Lowest"], tooltip="Strategy execution criteria. When Highest then MA1 Offset1 crossover with price, when Low then MA2 Offset crossover, when Lowest then all the Bands are the same color.", group="Strategy")

useStop = input(defval=false, title="Use Stop Loss", inline="SL", group="Strategy")
stopPrct = input.int(defval=10, title=" %", minval=0, maxval=100, step=1, inline="SL", group="Strategy") / 100

//Moving Averages function
MA(source, length, type) =>
    type == "EMA" ? ta.ema(source, length) :
     type == "HMA" ? ta.hma(source, length) :
     type == "RMA" ? ta.rma(source, length) :
     type == "SMA" ? ta.sma(source, length) :
     type == "SWMA" ? ta.swma(source) :
     type == "VWMA" ? ta.vwma(source, length) :
     type == "WMA" ? ta.wma(source, length) :
     na

//Inputs
ma1Type = input.string(defval="HMA", title="", inline="MA1", options=["EMA", "HMA", "RMA", "SMA","SWMA", "VWMA", "WMA"], group="Leading Moving Average") 
ma1Length = input.int(defval=35, title="",minval=1, inline="MA1", group="Leading Moving Average")
ma1Source = input(defval=close, title="", tooltip="For short timeframes, minutes to hours, instead of Default values try Lowest risk level and HMA75 with Offsets 0,1,4 and SMA12 with Offset 6.", inline="MA1", group="Leading Moving Average")
ma1Color  = input(defval=color.purple, title="", inline="MA-1", group="Leading Moving Average")
//useMa1Offset = input(defval=false, title="Use offset to MA-1", inline="MA1", group="Leading Moving Average")
ma1Offset = input.int(defval=0, title="Offset1 Steps", minval=0, maxval=10, step=1, tooltip="The Magic happens here! The offset to move the line to the right.", inline="MA-1", group="Leading Moving Average")
ma1 = MA(ma1Source, ma1Length, ma1Type)[ma1Offset]

ma2Color  = input(defval=color.lime, title="", inline="MA-2", group="Leading Moving Average")
//useMa2Offset = input(defval=true, title="Use offset to MA2", inline="MA-2", group="Leading Moving Average")
ma2Offset = input.int(defval=4, title="Offset2 Steps", minval=0, maxval=10, step=1, tooltip="The Magic happens here! The offset to move the line to the right.", inline="MA-2", group="Leading Moving Average")
ma2 = ma1[ma2Offset]

ma3Color  = input(defval=color.aqua, title="", inline="MA-3", group="Leading Moving Average")
//useMa3Offset = input(defval=false, title="Use offset to MA3", inline="MA-3", group="Leading Moving Average")
ma3Offset = input.int(defval=6, title="Offset3 Steps", minval=0, maxval=10, step=1, tooltip="The Magic happens here! The offset to move the line to the right.", inline="MA-3", group="Leading Moving Average")
ma3 = ma1[ma3Offset]

ma4Type = input.string(defval="SMA", title="", inline="MA4", options=["EMA", "HMA", "RMA", "SMA","SWMA", "VWMA", "WMA"], group="Lagging Moving Average") 
ma4Length = input.int(defval=22, title="",minval=1, inline="MA4", group="Lagging Moving Average")
ma4Source = input(defval=close, title="", inline="MA4", group="Lagging Moving Average")
ma4Color  = input(defval=color.yellow, title="", inline="MA-4", group="Lagging Moving Average")
//useMa4Offset = input(defval=true, title="Use offset to MA4", inline="MA-4", group="Lagging Moving Average")
ma4Offset = input.int(defval=2, title="Offset Steps", minval=0, maxval=10, step=1, tooltip="The Magic happens here! The offset to move the line to the right.", inline="MA-4", group="Lagging Moving Average")
ma4 = MA(ma4Source, ma4Length, ma4Type)[ma4Offset]

bandTransp = input.int(defval=60, title="Band Transparency", minval=20, maxval=80, step=10, group="Banding")
useBand1 = input(defval=true, title="Band 1", inline="Band", group="Banding")
band1Transp = useBand1 ? bandTransp : 100
band1clr = ma1 > ma2 ? color.new(#00ff00, transp=band1Transp) : color.new(#ff0000, transp=band1Transp)
useBand2 = input(defval=true, title="Band 2", inline="Band", group="Banding")
band2Transp = useBand2 ? bandTransp : 100
band2clr = ma1 > ma3 ? color.new(#00ff00, transp=band2Transp) : color.new(#ff0000, transp=band2Transp)
useBand3 = input(defval=true, title="Band 3", tooltip="Up trend green, down trend red. Colors get reversed if MA1 lenght is greater than MA2 lenght, or they are different type and MA2 quicker. In that case, just reverse your selections for MA1 and MA2, or let it be as is.", inline="Band", group="Banding")
band3Transp = useBand3 ? bandTransp : 100
band3clr = ma1 > ma4 ? color.new(#00ff00, transp=band3Transp) : color.new(#ff0000, transp=band3Transp)

//Graphs
piirto1 = plot(ma1, color = ma1Color, title="MA1")
piirto2 = plot(ma2, color = ma2Color, title="MA2")
piirto3 = plot(ma3, color = ma3Color, title="MA3")
piirto4 = plot(ma4, color = ma4Color, title="MA4")

fill(piirto1, piirto2, color=band1clr)
fill(piirto1, piirto3, color=band2clr)
fill(piirto1, piirto4, color=band3clr)

//Strategy entry and stop conditions

longCondition = riskLevel == "Highest" ? ma1Source > ma1 : riskLevel == "High" ? ma1Source > ma2 : riskLevel == "Medium" ? ma1Source > ma3 : riskLevel == "Low" ? ma1Source > ma4 : riskLevel == "Lowest" ? ma1 > ma2 and ma1 > ma3 and ma1 > ma4 : na
shortCondition = riskLevel == "Highest" ? ma1Source < ma1 : riskLevel == "High" ? ma1Source < ma2 : riskLevel == "Medium" ? ma1Source < ma3 : riskLevel == "Low" ? ma1Source < ma4 : riskLevel == "Lowest" ? ma1 < ma2 and ma1 < ma3 and ma1 < ma4 : na

stopLprice = useStop == true ? strategy.position_avg_price * (1-stopPrct) : na
stopSprice = useStop == true ? strategy.position_avg_price * (1+stopPrct) : na

if (longCondition)
    strategy.entry("Long",strategy.long)
    strategy.exit("Long Stop", "Long", stop=stopLprice)    
if (shortCondition)
    strategy.entry("Short",strategy.short)
    strategy.exit("Short Stop", "Short", stop=stopSprice)

//End