RSI移動平均クロスオーバー戦略

概要
RSI均線交差戦略は,暗号通貨取引に適用される戦略である.この戦略は,移動平均をRSI指標に適用し,RSIとその移動平均の交差に応じて買入と売却の信号を発する.
戦略原則
この戦略は,まずRSIを計算する. RSIは,価格の強さや弱さを反映した,一定の時間周期における上昇変化に基づいている. RSIは,70を超えると超買区,30を超えると超売り区である.
この戦略は,RSI指標に基づいて移動平均を適用します.移動平均は,ランダムな波動をフィルターして,トレンドの方向を判断します.ここでは,10サイクルRSI移動平均が設定されています.
RSI上の移動平均を突破すると,買入シグナルとみなされ,RSI下の移動平均を突破すると,売出シグナルとみなされます. この2つのシグナルに基づいて取引されます.
コードでは,まず length周期のRSI指標を計算します. そして,10周期のRSIの移動平均を計算します.
さらに,コードは,rsi,ma の線形図と,rsi-ma の柱形図を描いています.rsi=70,rsi=30 の境界線を描いています.そして,買取と販売の際に,図に対応する信号矢印をマークしています.
戦略的優位分析
- RSIは,超買いと超売りを判断し,移動平均はランダムな波動をフィルターし,両者を組み合わせてトレンド転換点を発見できます.
- RSI平均線交差は,より成熟した取引戦略であり,偽の信号をフィルターすることができます.
- この戦略コードはシンプルでわかりやすく,理解しやすい. 図の機能は完全で,取引信号を明確に観察することができます.
- この戦略は,トレンドがより顕著な暗号通貨に適用され,より効果的です.
戦略的リスク分析
- RSIと移動平均の周期パラメータは不適切であり,誤った信号が過剰に発生する可能性があります.
- 交差する指標だけでは,完全には回避できない.トレンド分析と組み合わせる必要がある.
- 取引費用は収益に一定影響を及ぼします. ポジション管理を最適化する必要があります.
- 仮想通貨の市場が波動しやすいため,ストップダウンのリスクに注意が必要です.
リスクに応じて,パラメータを調整し,指数の効果を最適化し,ポジションを適切に短縮し,ストップ・ローンを設定し,トレンド分析と連携してシグナルをフィルターすることができます.
戦略最適化の方向性
- RSIと平均線の最適な組み合わせを研究できる
- トレンドが強い時,ポジションを大きくし,トレンドがわからない時,ポジションを小さくすることができます.
- 動的ストップを設定し,トレンドをストップします.
- 他の指標とRSIを組み合わせて新しい取引シグナルを作成することができます.
- この戦略を基にした機械学習モデルを探索し,戦略の勝利率を向上させることができます.
要約する
RSI均線交差戦略は,トレンド指標とフィルター指標の優位性を組み合わせ,比較的成熟した信頼性がある.この戦略の論理は簡単で分かりやすく,コードの実装も完全で,全体的に言えば,より良い暗号通貨取引戦略である.しかし,どんな戦略にも最適化が必要な場所があり,継続的にテストして調整し,トレンド判断を補助して,より良い戦略効果を得る必要がある.
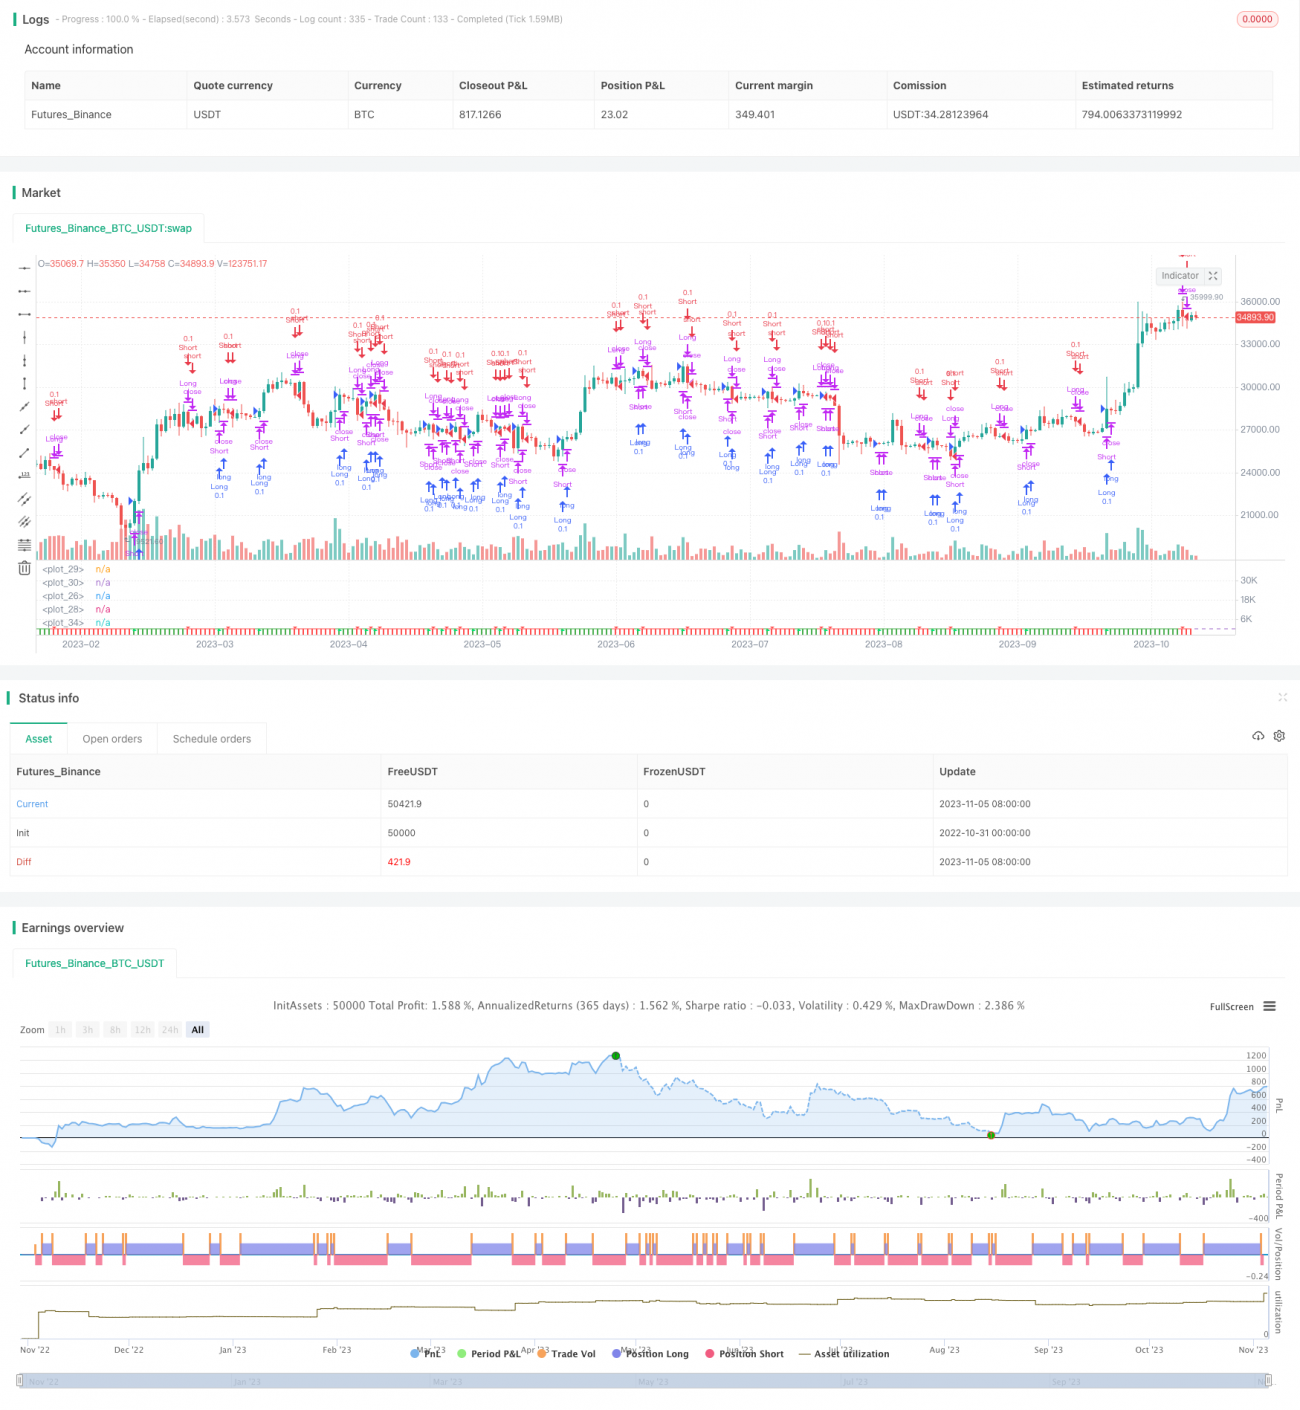
/*backtest
start: 2022-10-31 00:00:00
end: 2023-11-06 00:00:00
period: 1d
basePeriod: 1h
exchanges: [{"eid":"Futures_Binance","currency":"BTC_USDT"}]
*/

//@version=4
strategy("RSI w MA Strategy", shorttitle="RSI w MA Strategy", overlay=false, initial_capital=10000, currency='USD',process_orders_on_close=true)

//TIME FRAME AND BACKGROUND CONTROL/////////////////////////////////////////////- 1