
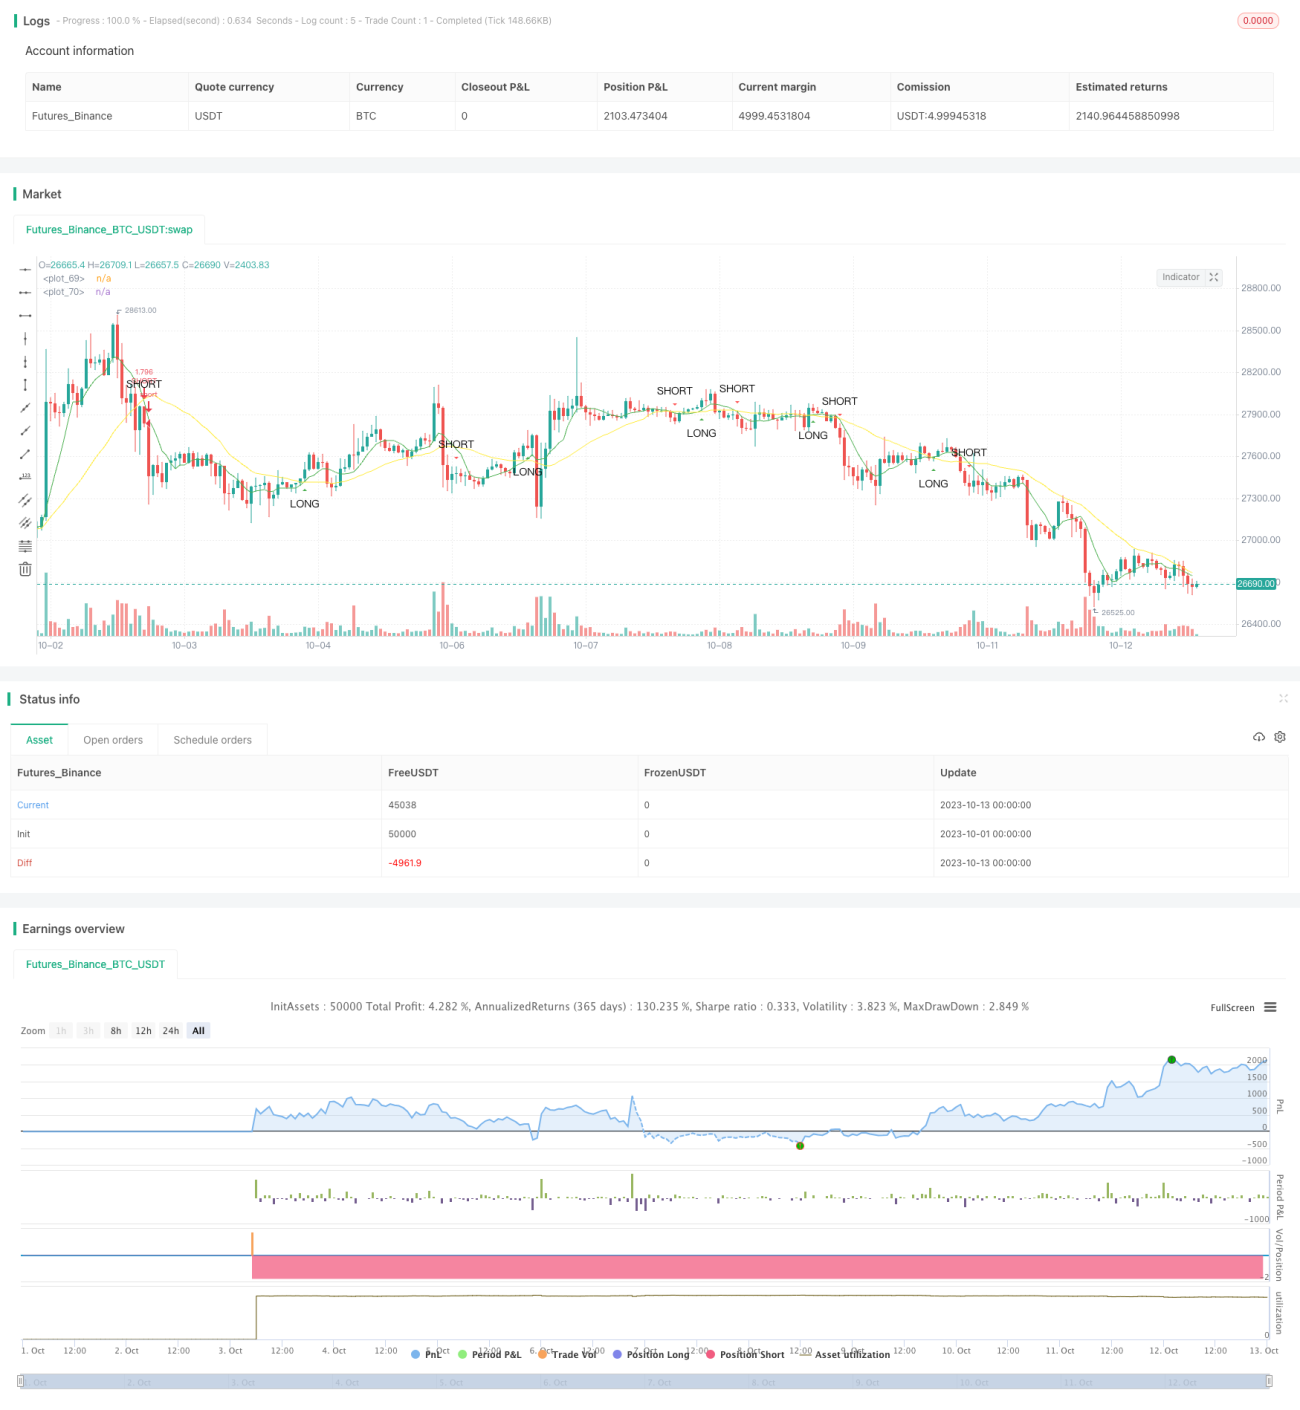
この戦略は,高速移動平均と遅い移動平均の交差原理に基づいて取引信号を生成する. 急速移動平均が,下から遅い移動平均を横断すると,買入信号を生成する. 急速移動平均が,上から下から遅い移動平均を横断すると,売り信号を生成する.
この策略は,sma関数を使用して,高速移動平均と遅い移動平均を計算する. fast_SMAは高速移動平均で,周期長がfast_SMA_input; slow_SMAは遅い移動平均で,周期長がslow_SMA_inputである.
策略は,クロスとクロスアンダー関数を使用して,高速移動平均と遅い移動平均の交差を判断します.LONGの変数は,高速移動平均の上にゆっくり移動平均を穿越すると,trueであり,購入シグナルを生成します.SHORTの変数は,高速移動平均の下のゆっくり移動平均を穿越すると,trueであり,セールシグナルを生成します.
この戦略の利点は以下の通りです.
この戦略には以下のリスクもあります.
リスク管理方法:
この戦略は以下の点で最適化できます.
この戦略は,移動平均の優位性を利用して,簡単に効率的に取引信号を生成する.いくつかのリスクがあるが,パラメータ最適化,フィルタ条件の追加などの方法で改善することができる.移動平均の交差戦略は,さらなる研究と適用に値する.
/*backtest
start: 2023-10-01 00:00:00
end: 2023-10-13 00:00:59
period: 1h
basePeriod: 15m
exchanges: [{"eid":"Futures_Binance","currency":"BTC_USDT"}]
*/
//@author Jacques Grobler
//
// SIMPLE CROSS OVER BOT
// =====================
//
// This is a simple example of how to set up a strategy to go long or short
// If you make any modifications or have any suggestions, let me know
// When using this script, every section marked back testing should be
// uncommented in order to use for back testing, same goes for using the script portion
///////////////////////////////////////////////////////////////////////////////////////
//// INTRO
//// -----
// BACKTESTING
//@version=4
strategy(title="SimpleCrossOver_Bot_V1_Backtester", overlay=true, default_qty_type=strategy.percent_of_equity, default_qty_value=100, pyramiding=0, commission_type=strategy.commission.percent, commission_value=0.1)
// SIGNALS
//study(title="SimpleCrossOver_Bot_V1_Signals", overlay = true)
///////////////////////////////////////////////////////////////////////////////////////
//// INPUTS
//// ------
// BACKTESTING
dateSart_Year = input(2018, title="Start Year", minval=2000)
dateSart_Month = input(1, title="Start Month", minval=1, maxval=12)
dateSart_Day = input(1, title="Start Day", minval=1, maxval=31)
dateEnd_Year = input(2019, title="End Year", minval=2000)
dateEnd_Month = input(1, title="End Month", minval=1, maxval=12)
dateEnd_Day = input(1, title="End Day", minval=1, maxval=31)
// BACKTESTING AND SIGNALS
fast_SMA_input = input(7, title="SMA Fast")
slow_SMA_input = input(25, title="SMA Slow")
///////////////////////////////////////////////////////////////////////////////////////
//// INDICATORS
//// ----------
fast_SMA = sma(close, fast_SMA_input)
slow_SMA = sma(close, slow_SMA_input)
///////////////////////////////////////////////////////////////////////////////////////
//// STRATEGY
//// --------
LONG = cross(fast_SMA, slow_SMA) and fast_SMA > slow_SMA
stratLONG() => crossover(fast_SMA, slow_SMA)
SHORT = cross(fast_SMA, slow_SMA) and fast_SMA < slow_SMA
stratSHORT() => crossunder(fast_SMA, slow_SMA)
///////////////////////////////////////////////////////////////////////////////////////
//// TRIGGERS
//// --------
// BACKTESTING
testPeriodStart = timestamp(dateSart_Year, dateSart_Month, dateSart_Day, 0, 0)
testPeriodStop = timestamp(dateEnd_Year, dateEnd_Month, dateEnd_Day, 0, 0)
timecondition = true
strategy.entry(id="LONG", long = true, when=timecondition and stratLONG())
strategy.entry(id="SHORT", long = false, when=timecondition and stratSHORT())
// SIGNALS
//alertcondition(LONG, title="LONG")
//alertcondition(SHORT, title="SHORT")
///////////////////////////////////////////////////////////////////////////////////////
//// PLOTS
//// -----
// BACKTESTING AND SIGNALS
plot(fast_SMA, color=green, linewidth=1)
plot(slow_SMA, color=yellow, linewidth=1)
plotshape(LONG, title="LONG", style=shape.triangleup, text="LONG", location=location.belowbar, size=size.small, color=green)
plotshape(SHORT, title="SHORT", style=shape.triangledown, text="SHORT", location=location.abovebar, size=size.small, color=red)