
この戦略は,ブリン線とATR指標をEMA平均線と組み合わせて判断し,動力の突破取引戦略を形成する.価格がブリン上線を突破し,EMA平均線を素早く突破すると,買入シグナルを生成する.価格がブリン下線を突破し,EMA平均線を素早く下落すると,売出シグナルを生成する.同時にATR指標を利用してストップする.
ブリン線の中線,上線,下線を計算する. 中線はn周期のSMA平均線で,上線は中線+m*n周期標準差,下軌道は中線−m*n周期標準差.
ストップ・ロスを追跡するためのATR指標を計算する.
1サイクルとnサイクルのEMA平均線を計算し,価格動向を判断する.
価格がブリン上線を突破し,n周期のEMA平均線を素早く突破すると,買取シグナルが生成される。
価格がブリン下線を突破し,n周期EMA平均線を素早く突破すると,売り込みシグナルが生成されます.
ATR指標は,ストップ・ロスを設定し,価格の突破方向を追跡し,を避けるために使用されます.
ブリンラインはATRの停止と組み合わせて,リスクを効果的にコントロールできます.
EMAは動きの方向を平均線で判断し,偽突破を避ける.
戦略のパラメータは,異なる市場環境に適用して調整できます.
取引頻度が高い,明快な買い売りシグナルで,ショートライン取引に適しています.
ATRの指数で止損を追跡し,その間に止損を行うことができます.
ブリンラインの範囲が狭すぎると,より多くの騒音取引が起こる可能性があります.
ATRのパラメータは小さすぎるので,ストップダメージ距離が非常に近い状態になる可能性があります.
EMAパラメータは周期調整が必要で,周期によって効果は異なります.
震災区間市では取引が増える可能性があり,注意が必要です.
ストップ・トラッキングは時に過度に激しくなり,損失を拡大する可能性があります.
他の指標と組み合わせて取引シグナルをフィルタリングできます.例えば,RSI指標は超買超売を判断し,KDJ指標は偏離を判断します.
ATRの動向に合わせてブリンラインのパラメータを調整して,価格変動に適したブリンラインを考える.
異なるEMA周期パラメータの効果をテストして,最適なパラメータの組み合わせを見つけることができる.
ATRパラメータを波動率に合わせて調整し,極端な止損を避ける.
ディープ・ラーニング・モデルの導入は 購入や売却のタイミングを判断するのに役立ちます.
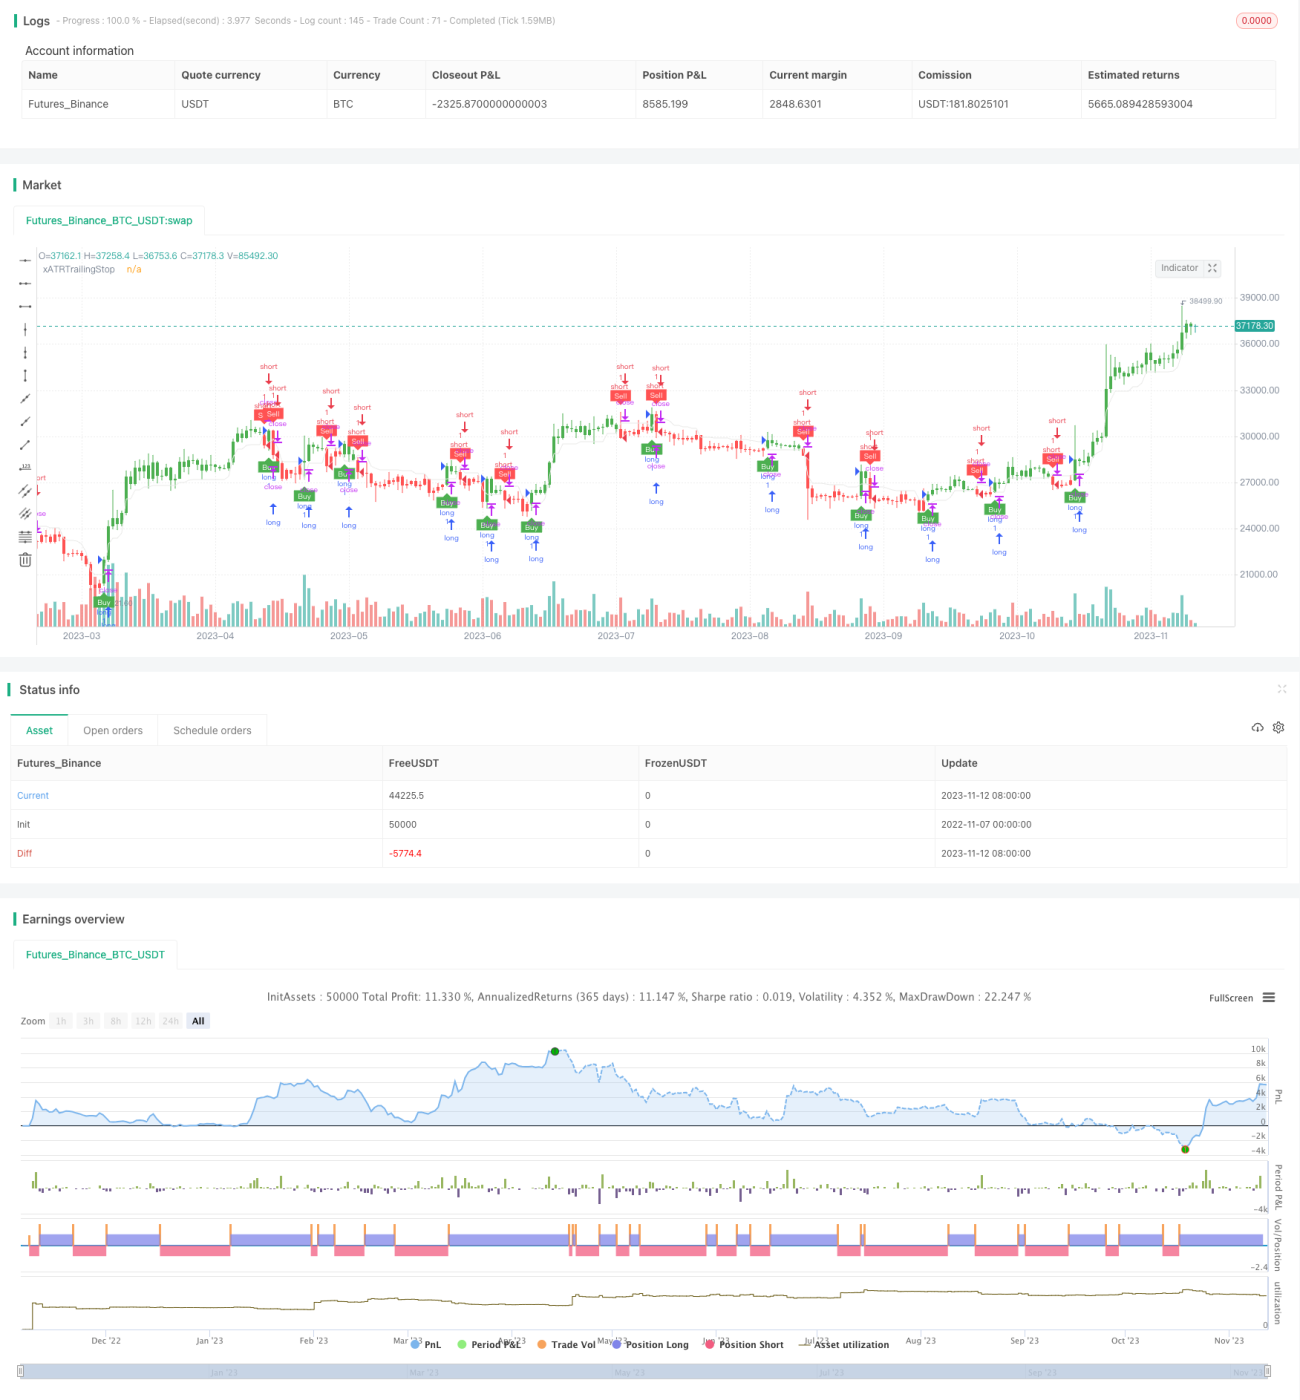
この戦略の全体的な考え方は明確で,ブリンラインを利用して価格突破を捕捉し,ATRはストップレードを設定し,EMAは動力の方向を判断し,突破の動力の全方位判断を効果的に行うことで,ショートラインの価格トレンドを効果的に捕捉することができる.同時に,複数の指標を組み合わせて総合的な判断を行うことで,信号の質を向上させることができる.しかし,いくつかの最適化可能な方向もあります.パラメータ調整,指標組み合わせなどの方法により,この戦略をさらに完善し,より安定し,より弾力的にすることができる.
/*backtest
start: 2022-11-07 00:00:00
end: 2023-11-13 00:00:00
period: 1d
basePeriod: 1h
exchanges: [{"eid":"Futures_Binance","currency":"BTC_USDT"}]
*/
//@version=4
strategy(title="UT Bot Strategy", overlay = true)
//CREDITS to HPotter for the orginal code. The guy trying to sell this as his own is a scammer lol.
// Inputs
a = input(1, title = "Key Vaule. 'This changes the sensitivity'")
c = input(10, title = "ATR Period")
h = input(false, title = "Signals from Heikin Ashi Candles")
src = h ? security(heikinashi(syminfo.tickerid), timeframe.period, close, lookahead = false) : close
length = input(20, minval=1)
mult = input(2.0, minval=0.001, maxval=50, title="StdDev")
basis = sma(src, length)
dev = mult * stdev(src, length)
upper = basis + dev
lower = basis - dev
bbr = (src - lower)/(upper - lower)
// plot(bbr, "Bollinger Bands %B", color=#26A69A)
// band1 = hline(1, "Overbought", color=#787B86, linestyle=hline.style_dashed)
// hline(0.5, "Middle Band", color=color.new(#787B86, 50))
// band0 = hline(0, "Oversold", color=#787B86, linestyle=hline.style_dashed)
// fill(band1, band0, color=color.rgb(38, 166, 154, 90), title="Background")
xATR = atr(c)
nLoss = a * xATR
xATRTrailingStop = 0.0
xATRTrailingStop := iff(src > nz(xATRTrailingStop[1], 0) and src[1] > nz(xATRTrailingStop[1], 0), max(nz(xATRTrailingStop[1]), src - nLoss),
iff(src < nz(xATRTrailingStop[1], 0) and src[1] < nz(xATRTrailingStop[1], 0), min(nz(xATRTrailingStop[1]), src + nLoss),
iff(src > nz(xATRTrailingStop[1], 0), src - nLoss, src + nLoss)))
pos = 0
pos := iff(src[1] < nz(xATRTrailingStop[1], 0) and src > nz(xATRTrailingStop[1], 0), 1,
iff(src[1] > nz(xATRTrailingStop[1], 0) and src < nz(xATRTrailingStop[1], 0), -1, nz(pos[1], 0)))
xcolor = pos == -1 ? color.red: pos == 1 ? color.green : color.blue
ema = ema(src,1)
emaFast = ema(src,144)
emaSlow = ema(src,576)
sma = sma(src, c)
above = crossover(ema, xATRTrailingStop)
below = crossover(xATRTrailingStop, ema)
smaabove = crossover(src, sma)
smabelow = crossover(sma, src)
buy = src > xATRTrailingStop and above and (bbr>20 or bbr<80)
sell = src < xATRTrailingStop and below and (bbr>20 or bbr<80)
// buy = src > xATRTrailingStop
// sell = src < xATRTrailingStop
barbuy = src > xATRTrailingStop
barsell = src < xATRTrailingStop
// plot(emaFast , color = color.rgb(243, 206, 127), title="emaFast")
plot(xATRTrailingStop, color = color.rgb(233, 233, 232), title="xATRTrailingStop")
plotshape(buy, title = "Buy", text = 'Buy', style = shape.labelup, location = location.belowbar, color= color.green, textcolor = color.white, transp = 0, size = size.tiny)
plotshape(sell, title = "Sell", text = 'Sell', style = shape.labeldown, location = location.abovebar, color= color.red, textcolor = color.white, transp = 0, size = size.tiny)
// plotshape(buy, title = "Sell", text = 'Sell', style = shape.labelup, location = location.belowbar, color= color.green, textcolor = color.white, transp = 0, size = size.tiny)
// plotshape(sell, title = "buy", text = 'buy', style = shape.labeldown, location = location.abovebar, color= color.red, textcolor = color.white, transp = 0, size = size.tiny)
barcolor(barbuy ? color.green : na)
barcolor(barsell ? color.red : na)
// strategy.entry("short", false, when = buy)
// strategy.entry("long ", true, when = sell)
strategy.entry("long", true, when = buy)
strategy.entry("short ", false, when = sell)