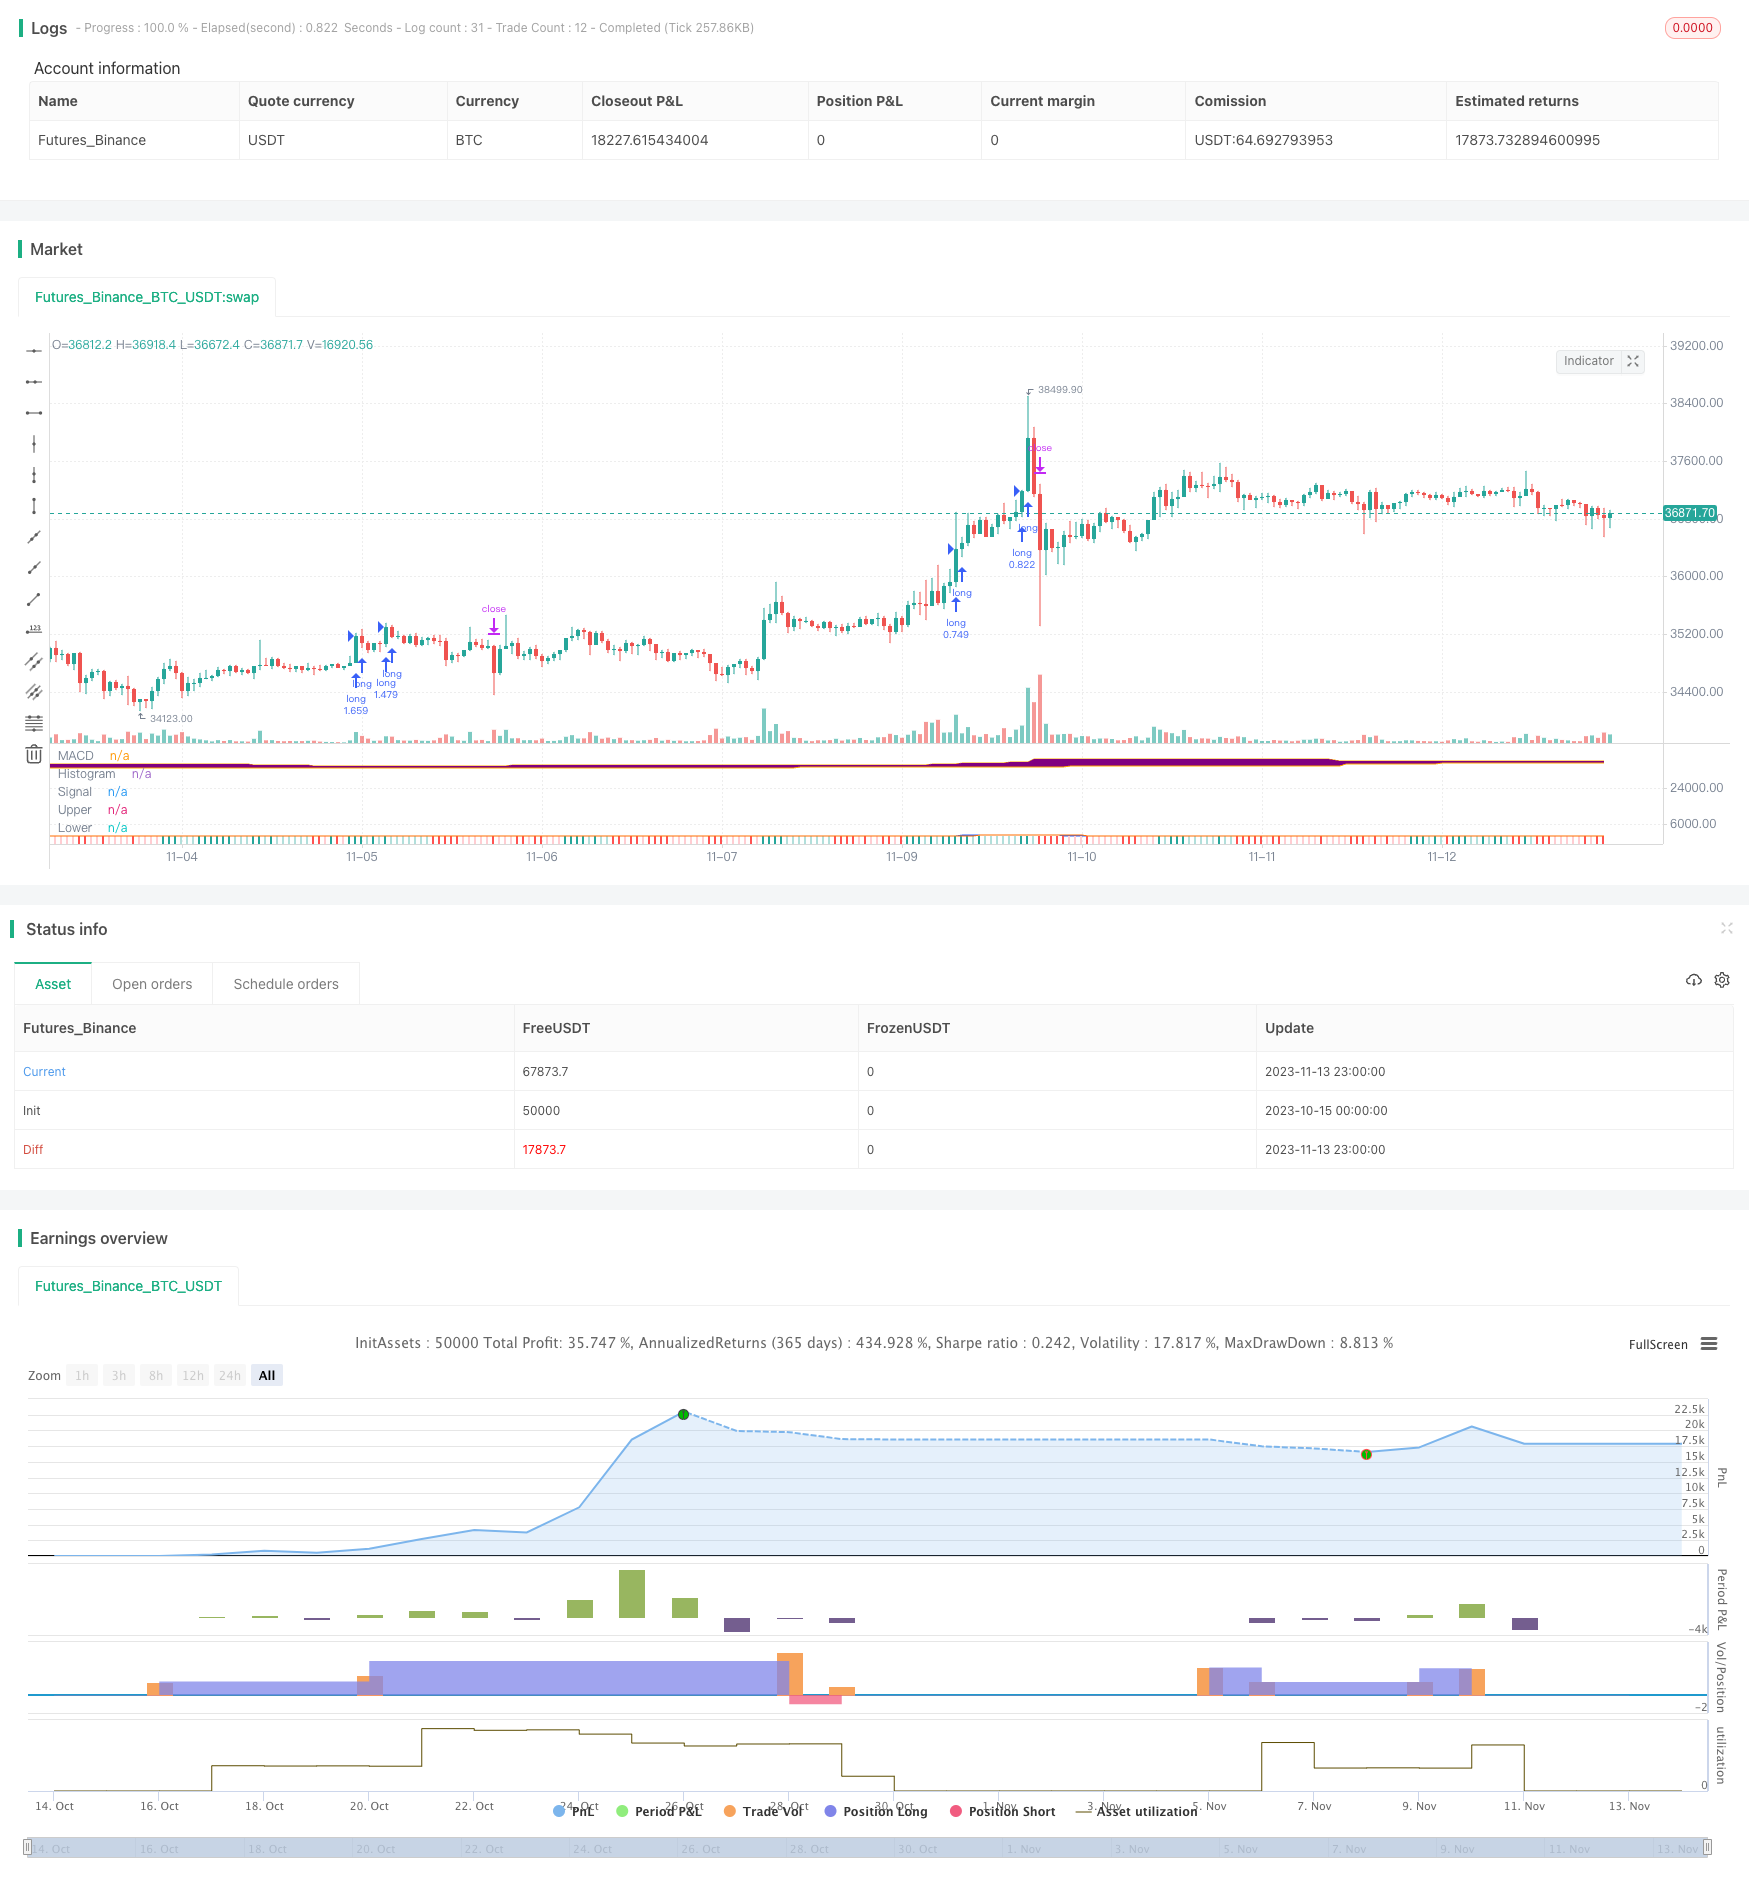
MACDに基づく拡散チャネルトレンドフォロー戦略

概要
この戦略は,分散チャネル指標とMACD指標を組み合わせてトレンドを判断し,典型的なトレンド追跡戦略に属します.価格が上線を突破し,MACD指標が金叉を現したとき,多めに行います.価格が下線を突破し,MACD指標が死叉を現したとき,空白を空けて,ATR指標を使用してストップロスを計算します.
戦略原則
快線,慢線,ヒストグラムを含むMACD指標を計算する.
上下拡散チャネルを計算する。上線はN日間の最高価格,下線はN日間の最低価格。
価格が上線を突破し,MACDの快線が上線を突破すると,さらに多くを行う.
価格が下落し,MACD速線が下向きに遅い線を突破すると空白する.
ATR指標を使用して,この戦略のストップ・ロスを計算し,価格からストップ・ロスの距離であるATRの値に係数掛けて設定します.
逆転のシグナルが出ると,現在のポジションを平らにする.
優位分析
この戦略は,トレンド判断指標とチャネル指標を組み合わせて,トレンドを効果的に追跡できます. MACD指標は価格の傾向と強さを判断し,分散チャネル指標は方向を判断します. ATRのストップは単一の損失を制限します.
利点としては,
戦略のパラメータはシンプルで簡単に実行できます.
市場を動かすために,市場を動かすために,市場を動かすために,
ATRの停止はリスクをコントロールする.
撤退は制御できる.
リスク分析
この戦略にはいくつかのリスクがあります.
散布チャネルのパラメータを誤って設定すると,偽信号が発生する可能性があります.
MACDパラメータの不適切な設定は,Viticulture Administration Systemの提示信号の遅延を引き起こす可能性があります.
損失を拡大する可能性がある.
ビジネスが急激に逆転すると,損失を招く可能性があります.
この戦略は過剰取引を招く可能性が高い.
対応方法:
株価を慎重に選択する.
ストップ・ストップ・ストップ・ストップ・ストップ
ポジション管理を適切に調整する.
最適化の方向
この戦略は以下の点で最適化できます.
MACDパラメータを最適化して,指標の感度を向上させる.
ストップ・ロスのアルゴリズムを最適化し,ストップ・ロスを価格に近いものにしました.
ポジション管理の仕組みを増やし,トレンドの強さや弱さに応じてポジションを調整する.
フィルタリング条件を追加して,偽信号を回避する.
取引品種に対する選択基準の追加
取引の時間帯に対する判断を増やす.
要約する
この戦略は全体的に典型的なトレンド追跡戦略である。この戦略は,分散チャネル指標がトレンド判断方向とMACD指標がトレンド判断強度とを融合している。順番として,リスクを効果的に制御することができる。パラメータ設定,ストップ・ロスの方法,ポジション管理などの最適化によって,戦略の安定性と収益率をさらに強化することができる。この戦略は,トレンド判断に高い要求を持つ投資家の使用に適している。
/*backtest
start: 2023-10-15 00:00:00
end: 2023-11-14 00:00:00
period: 1h
basePeriod: 15m
exchanges: [{"eid":"Futures_Binance","currency":"BTC_USDT"}]
*/

// This source code is subject to the terms of the Mozilla Public License 2.0 at https://mozilla.org/MPL/2.0/
// © Robrecht99

//@version=5
strategy("Trend Following with Donchian Channels and MACD", overlay=false, margin_long=100, margin_short=100, pyramiding=3)

// MACD //
fast_length = input(title="Fast Length", defval=12)
slow_length = input(title="Slow Length", defval=26)
src = input(title="Source", defval=close)
signal_length = input.int(title="Signal Smoothing",  minval = 1, maxval = 50, defval = 9)
sma_source = input.string(title="Oscillator MA Type",  defval="EMA", options=["SMA", "EMA"])
sma_signal = input.string(title="Signal Line MA Type", defval="EMA", options=["SMA", "EMA"])

col_macd = input(#2962FF, "MACD Line  ", group="Color Settings", inline="MACD")
col_signal = input(#FF6D00, "Signal Line  ", group="Color Settings", inline="Signal")
col_grow_above = input(#26A69A, "Above   Grow", group="Histogram", inline="Above")
col_fall_above = input(#B2DFDB, "Fall", group="Histogram", inline="Above")
col_grow_below = input(#FFCDD2, "Below Grow", group="Histogram", inline="Below")
col_fall_below = input(#FF5252, "Fall", group="Histogram", inline="Below")

fast_ma = sma_source == "SMA" ? ta.sma(src, fast_length) : ta.ema(src, fast_length)
slow_ma = sma_source == "SMA" ? ta.sma(src, slow_length) : ta.ema(src, slow_length)
macd = fast_ma - slow_ma
signal = sma_signal == "SMA" ? ta.sma(macd, signal_length) : ta.ema(macd, signal_length)
hist = macd - signal
plot(hist, title="Histogram", style=plot.style_columns, color=(hist>=0 ? (hist[1] < hist ? col_grow_above : col_fall_above) : (hist[1] < hist ? col_grow_below : col_fall_below)))
plot(macd, title="MACD", color=col_macd)
plot(signal, title="Signal", color=col_signal)

// Donchian Channels //

Length1 = input.int(title="Length Upper Channel", defval=50, minval=1, group="Donchian Channels Inputs")
Length2 = input.int(title="Length Lower Channel", defval=50, minval=1, group="Donchian Channels Inputs")
h1 = ta.highest(high[1], Length1)
l1 = ta.lowest(low[1], Length2)
fillColor = input.color(color.new(color.purple, 95), title = "Fill Color", group = "Donchian Channels Inputs")
upperColor = input.color(color.new(color.orange, 0), title = " Color Upper Channel", group = "Donchian Channels Inputs", inline = "upper")
lowerColor = input.color(color.new(color.orange, 0), title = " Color Lower Channel", group = "Donchian Channels Inputs", inline = "lower")
u = plot(h1, "Upper", color=upperColor)
l = plot(l1, "Lower", color=upperColor)
fill(u, l, color=fillColor)

//ATR and Position Size //
strategy.initial_capital = 50000
length = input.int(title="ATR Period", defval=14, minval=1, group="ATR Inputs")
risk = input(title="Risk Per Trade", defval=0.01, group="ATR Inputs")
multiplier = input(title="ATR Multiplier", defval=2, group="ATR Inputs")
atr = ta.atr(length)
amount = (risk * strategy.initial_capital / (multiplier * atr))

// Buy and Sell Conditions //

entrycondition1 = ta.crossover(macd, signal)
entrycondition2 = macd > signal
entrycondition3 = macd and signal > hist
sellcondition1 = ta.crossover(signal, macd)
sellcondition2 = signal > macd
sellcondition3 = macd and signal < hist

// Buy and Sell Signals //

if (close > h1 and entrycondition2 and entrycondition3)
    strategy.entry("long", strategy.long, qty=amount)
    stoploss = close - atr * 4
    strategy.exit("exit sl", stop=stoploss, trail_offset=stoploss)
if (sellcondition1 and sellcondition2 and sellcondition3)
    strategy.close(id="long")

if (close < l1 and sellcondition2 and sellcondition3)
    strategy.entry("short", strategy.short, qty=amount)
    stoploss = close + atr * 4
    strategy.exit("exit sl", stop=stoploss, trail_offset=stoploss)
if (entrycondition1 and entrycondition2 and entrycondition3)
    strategy.close(id="short")