複数の移動平均ギャップ双方向取引戦略


作成日: 2023-11-15 16:22:07 最終変更日: 2023-11-15 16:22:07
コピー: 0 クリック数: 822
1
フォロー
1617
フォロワー

複数の移動平均ギャップ双方向取引戦略

概要

この戦略は,ウィリアムズ新高新低指数を使用して多空反転信号を識別し,多重均線と組み合わせて亀裂取引を行い,さらにRSI指数で偽信号をフィルタリングして,高効率の双方向取引を実現します.

戦略原則

  1. ウィリアムズ新高新低指数は,一定の周期内の最高価格と最低価格判断により,ターニングポイントが発生し,買入と売却のシグナルを発する.

  2. 20日,50日,100日均線は,複数の均線を構成し,価格が2つの均線を突破すると取引信号を発する.

  3. RSIは,不確実な信号をフィルタリングするために使用されます.

  4. 戦略は,価格がどの2つの平均線を突破するかを判断し,ウィリアムズ指数信号とRSIフィルタリングを組み合わせて,安定した買出信号を生成します.

  5. 入場判断:短周期平均線が中長期平均線を下から上へと突破し,ウィリアムズの新低とRSI低のシグナルが同時に現れる時,多めに行きます.短周期平均線が中長期平均線を上から下へと突破し,ウィリアムズの新高とRSI高のシグナルが同時に現れる時,空きとなります.

  6. 止損止:固定比例の止損止を設定する.

戦略的優位性

  1. ウィリアムズ指数は,重要なサポート抵抗を正確に判断し,反転信号を識別する.

  2. 複数の均線突破判断,単一の均線振動による誤信号を避ける.

  3. RSIは偽信号をフィルターし,入場時間をより正確かつ信頼性のあるものにします.

  4. 固定ストップ・ストップ・ストップ・システムによるリスク管理により,利益と損失がより明確になります.

  5. 逆転指数とトレンド指数の二重確認を組み合わせて,取引信号をより正確かつ信頼性のあるものにします.

戦略リスク

  1. 取引品種選択は不適切で,異なる品種のパラメータは調整する必要がある.

  2. 周期選択は不合理で,異なる周期に対応してパラメータを調整する必要がある.

  3. 固定ストップは市場の変化に合わせて調整できないため,早すぎるストップまたは不十分なストップになる可能性があります.

  4. 平均線が振動すると誤信号が生じやすい.

  5. 標識が散らばると信号が遅れる.

戦略最適化の方向性

  1. 異なる取引品種による動的最適化パラメータ.

  2. 自動調節ストップ・ストップ・システムが追加され,損失を合理的にします.

  3. MACD,ストキャスティックなどのフィルターを追加し,誤信号を減らす.

  4. 機械学習のアルゴリズムが追加され,最適な取引タイミングを自動で識別します.

  5. 動向を判断する指標と,動向を判断する指標を組み合わせて,動向を識別する.

要約する

この戦略は,ウィリアムズ指数,平均線指数,RSI指数などの複数の技術分析ツールを総合的に使用し,二重確認により誤信号を減らす,反転の機会を効果的に捕捉し,固定されたストップ・ストップの制御リスクと連携し,全体的に見ると,信頼性の高い実用的な双方向取引戦略である.次のステップは,パラメータ最適化,ストップ・ストップ・オプティメーション,モデル統合などの方法によって戦略の効果をさらに強化する.
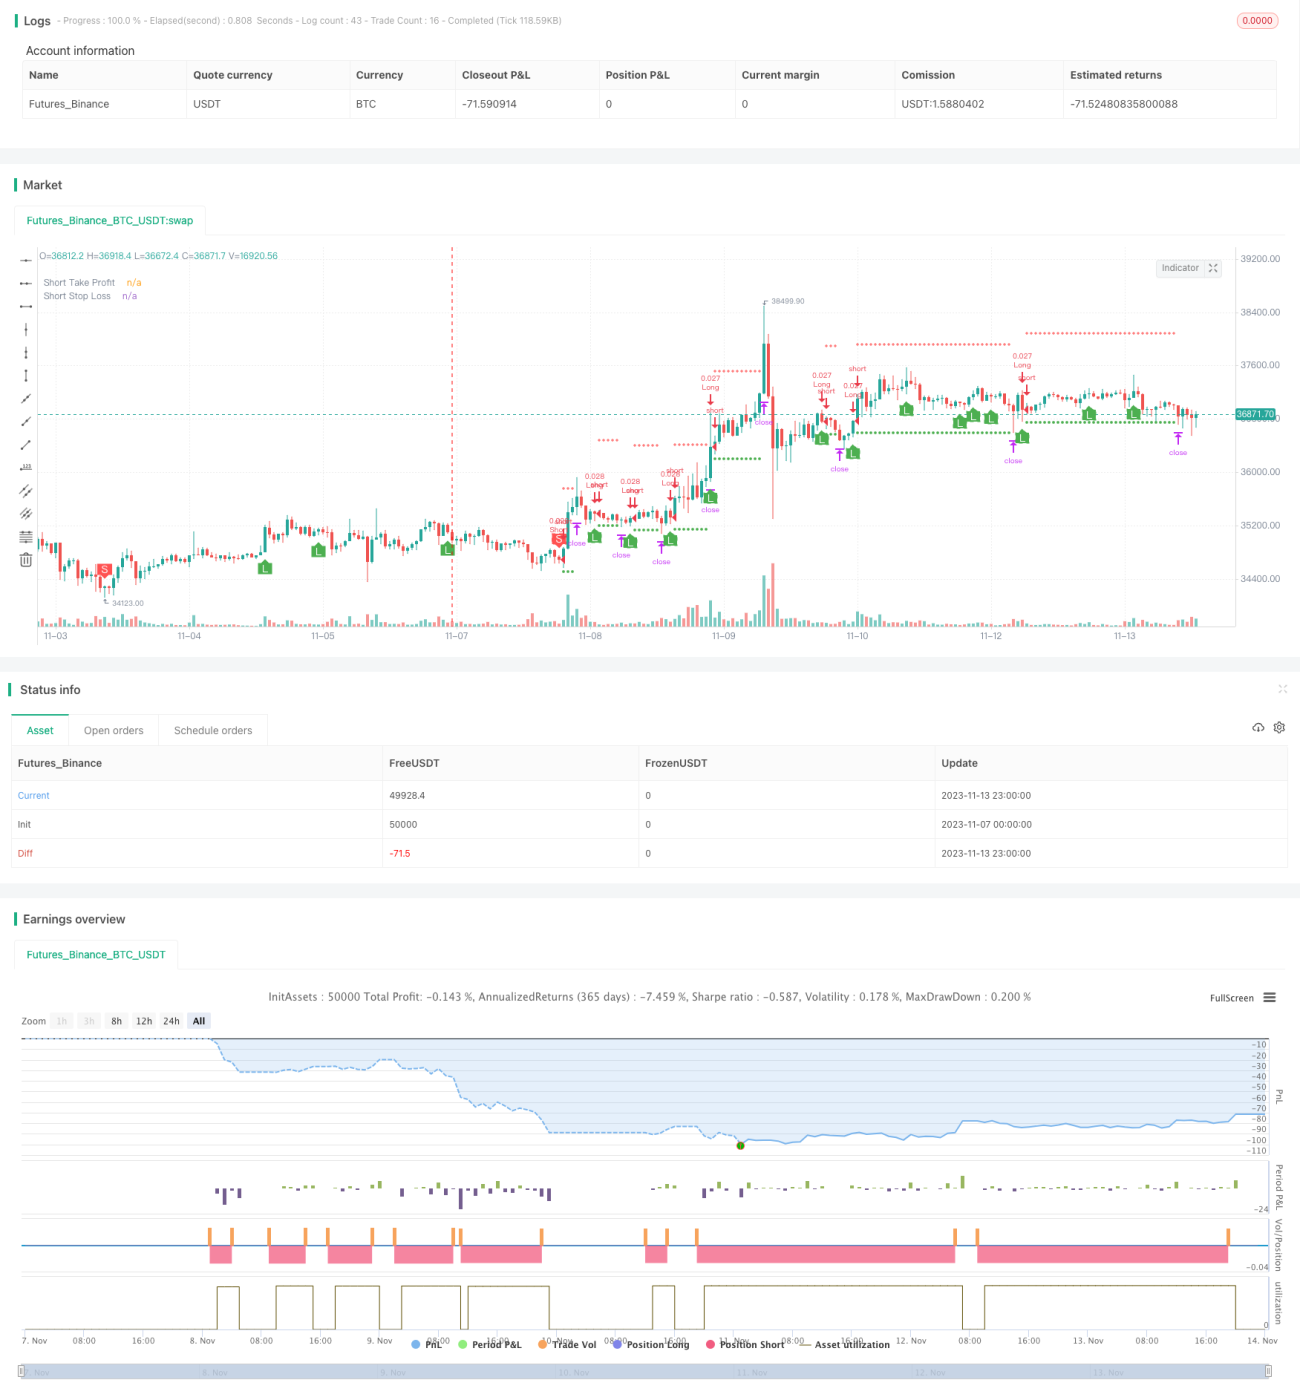
ストラテジーソースコード
/*backtest
start: 2023-11-07 00:00:00
end: 2023-11-14 00:00:00
period: 1h
basePeriod: 15m
exchanges: [{"eid":"Futures_Binance","currency":"BTC_USDT"}]
*/

// This source code is subject to the terms of the Mozilla Public License 2.0 at https://mozilla.org/MPL/2.0/
// © B_L_A_C_K_S_C_O_R_P_I_O_N
// v 1.1

//@version=4
strategy("Williams Fractals Strategy by ȼhąţhµяąɲǥą", overlay=true, default_qty_type=strategy.cash, default_qty_value=1000, currency='USD')

// *************Appearance*************
theme = input(type=input.string, defval="dark", options=["light","dark"], group="Appearance")
show_fractals = input(false, "Show Fractals", group="Appearance")
show_ema = input(false, "Show EMAs", group="Appearance")

// *************colors*************
color_green = color.green
color_red = color.red
color_yellow = color.yellow
color_orange = color.orange
color_blue = color.blue
color_white = color.white

// *************WF*************
// Define "n" as the number of periods and keep a minimum value of 2 for error handling.
n = input(title="Fractal Periods", defval=2, minval=2, type=input.integer, group="Williams Fractals")

// UpFractal
bool upflagDownFrontier = true
bool upflagUpFrontier0 = true
bool upflagUpFrontier1 = true
bool upflagUpFrontier2 = true
bool upflagUpFrontier3 = true
bool upflagUpFrontier4 = true

for i = 1 to n
    upflagDownFrontier := upflagDownFrontier and (high[n-i] < high[n])
    upflagUpFrontier0 := upflagUpFrontier0 and (high[n+i] < high[n])
    upflagUpFrontier1 := upflagUpFrontier1 and (high[n+1] <= high[n] and high[n+i + 1] < high[n])
    upflagUpFrontier2 := upflagUpFrontier2 and (high[n+1] <= high[n] and high[n+2] <= high[n] and high[n+i + 2] < high[n])
    upflagUpFrontier3 := upflagUpFrontier3 and (high[n+1] <= high[n] and high[n+2] <= high[n] and high[n+3] <= high[n] and high[n+i + 3] < high[n])
    upflagUpFrontier4 := upflagUpFrontier4 and (high[n+1] <= high[n] and high[n+2] <= high[n] and high[n+3] <= high[n] and high[n+4] <= high[n] and high[n+i + 4] < high[n])
flagUpFrontier = upflagUpFrontier0 or upflagUpFrontier1 or upflagUpFrontier2 or upflagUpFrontier3 or upflagUpFrontier4

upFractal = (upflagDownFrontier and flagUpFrontier)

// downFractal
bool downflagDownFrontier = true
bool downflagUpFrontier0 = true
bool downflagUpFrontier1 = true
bool downflagUpFrontier2 = true
bool downflagUpFrontier3 = true
bool downflagUpFrontier4 = true

for i = 1 to n
    downflagDownFrontier := downflagDownFrontier and (low[n-i] > low[n])
    downflagUpFrontier0 := downflagUpFrontier0 and (low[n+i] > low[n])
    downflagUpFrontier1 := downflagUpFrontier1 and (low[n+1] >= low[n] and low[n+i + 1] > low[n])
    downflagUpFrontier2 := downflagUpFrontier2 and (low[n+1] >= low[n] and low[n+2] >= low[n] and low[n+i + 2] > low[n])
    downflagUpFrontier3 := downflagUpFrontier3 and (low[n+1] >= low[n] and low[n+2] >= low[n] and low[n+3] >= low[n] and low[n+i + 3] > low[n])
    downflagUpFrontier4 := downflagUpFrontier4 and (low[n+1] >= low[n] and low[n+2] >= low[n] and low[n+3] >= low[n] and low[n+4] >= low[n] and low[n+i + 4] > low[n])
flagDownFrontier = downflagUpFrontier0 or downflagUpFrontier1 or downflagUpFrontier2 or downflagUpFrontier3 or downflagUpFrontier4

downFractal = (downflagDownFrontier and flagDownFrontier)

plotshape(downFractal and show_fractals, style=shape.triangleup, location=location.belowbar, offset=-n, color=color_green)
plotshape(upFractal and show_fractals, style=shape.triangledown, location=location.abovebar, offset=-n, color=color_red)

// *************EMA*************
len_a = input(20, minval=1, title="EMA Length A", group="EMA")
src_a = input(close, title="EMA Source A", group="EMA")
offset_a = input(title="EMA Offset A", type=input.integer, defval=0, minval=-500, maxval=500, group="EMA")
out_a = ema(src_a, len_a)
plot(show_ema ? out_a : na, title="EMA A", color=color_green, offset=offset_a)

len_b = input(50, minval=1, title="EMA Length B", group="EMA")
src_b = input(close, title="EMA Source B", group="EMA")
offset_b = input(title="EMA Offset B", type=input.integer, defval=0, minval=-500, maxval=500, group="EMA")
out_b = ema(src_b, len_b)
ema_b_color = (theme == "dark") ? color_yellow : color_orange
plot(show_ema ? out_b : na, title="EMA B", color=ema_b_color, offset=offset_b)

len_c = input(100, minval=1, title="EMA Length C", group="EMA")
src_c = input(close, title="EMA Source C", group="EMA")
offset_c = input(title="EMA Offset C", type=input.integer, defval=0, minval=-500, maxval=500, group="EMA")
out_c = ema(src_c, len_c)
ema_c_color = (theme == "dark") ? color_white : color_blue
plot(show_ema ? out_c : na, title="EMA C", color=ema_c_color, offset=offset_c)

// *************RSI*************
rsi_len = input(14, minval=1, title="RSI Length", group="RSI")
rsi_src = input(close, "RSI Source", type = input.source, group="RSI")
up = rma(max(change(rsi_src), 0), rsi_len)
down = rma(-min(change(rsi_src), 0), rsi_len)
rsi = down == 0 ? 100 : up == 0 ? 0 : 100 - (100 / (1 + up / down))

// *************Calculation*************
long = (out_a > out_b) and (out_a > out_c) and downFractal and low[2] > out_c and rsi[2] < rsi
short = (out_a < out_b) and (out_a < out_c) and upFractal and high[2] < out_c and rsi[2] > rsi

plotshape(long, style=shape.labelup, color=color_green, location=location.belowbar, title="long label", text= "L", textcolor=color_white)
plotshape(short, style=shape.labeldown, color=color_red, location=location.abovebar, title="short label", text= "S", textcolor=color_white)

// *************End of Signals calculation*************

// Make input options that configure backtest date range
startDate = input(title="Start Date", type=input.integer,
     defval=1, minval=1, maxval=31, group="Orders")
startMonth = input(title="Start Month", type=input.integer,
     defval=1, minval=1, maxval=12, group="Orders")
startYear = input(title="Start Year", type=input.integer,
     defval=2018, minval=1800, maxval=2100, group="Orders")

endDate = input(title="End Date", type=input.integer,
     defval=1, minval=1, maxval=31, group="Orders")
endMonth = input(title="End Month", type=input.integer,
     defval=12, minval=1, maxval=12, group="Orders")
endYear = input(title="End Year", type=input.integer,
     defval=2022, minval=1800, maxval=2100, group="Orders")

// Look if the close time of the current bar
// falls inside the date range
inDateRange =  true

// Make inputs that set the take profit % (optional)
longProfitPerc = input(title="Long Take Profit (%)",
     type=input.float, minval=0.0, step=0.1, defval=0.5, group="Orders") * 0.01

shortProfitPerc = input(title="Short Take Profit (%)",
     type=input.float, minval=0.0, step=0.1, defval=0.5, group="Orders") * 0.01

// Figure out take profit price
longExitPrice  = strategy.position_avg_price * (1 + longProfitPerc)
shortExitPrice = strategy.position_avg_price * (1 - shortProfitPerc)

// Plot take profit values for confirmation
plot(series=(strategy.position_size > 0) ? longExitPrice : na,
     color=color_green, style=plot.style_circles,
     linewidth=1, title="Long Take Profit")
plot(series=(strategy.position_size < 0) ? shortExitPrice : na,
     color=color_green, style=plot.style_circles,
     linewidth=1, title="Short Take Profit")

// Submit entry orders
if (inDateRange and long and strategy.opentrades == 0)
    strategy.entry(id="Long", long=true)

if (inDateRange and short and strategy.opentrades == 0)
    strategy.entry(id="Short", long=false)

// Submit exit orders based on take profit price
// if (strategy.position_size > 0)
//     strategy.exit(id="LTP", limit=longExitPrice)

// if (strategy.position_size < 0)
//     strategy.exit(id="STP", limit=shortExitPrice)
    
// Set stop loss level with input options (optional)
longLossPerc = input(title="Long Stop Loss (%)",
     type=input.float, minval=0.0, step=0.1, defval=3.1, group="Orders") * 0.01

shortLossPerc = input(title="Short Stop Loss (%)",
     type=input.float, minval=0.0, step=0.1, defval=3.1, group="Orders") * 0.01

// Determine stop loss price
longStopPrice  = strategy.position_avg_price * (1 - longLossPerc)
shortStopPrice = strategy.position_avg_price * (1 + shortLossPerc)

// Plot stop loss values for confirmation
plot(series=(strategy.position_size > 0) ? longStopPrice : na,
     color=color_red, style=plot.style_cross,
     linewidth=1, title="Long Stop Loss")
plot(series=(strategy.position_size < 0) ? shortStopPrice : na,
     color=color_red, style=plot.style_cross,
     linewidth=1, title="Short Stop Loss")

// Submit exit orders based on calculated stop loss price
if (strategy.position_size > 0)
    strategy.exit(id="ExL",limit=longExitPrice, stop=longStopPrice)

if (strategy.position_size < 0)
    strategy.exit(id="ExS", limit=shortExitPrice, stop=shortStopPrice)

// Exit open market position when date range ends
if (not inDateRange)
    strategy.close_all()