デュアル移動平均クロスオーバーデイトレード先物戦略


作成日: 2023-11-15 16:48:02 最終変更日: 2023-11-15 16:48:02
コピー: 2 クリック数: 686
1
フォロー
1621
フォロワー

デュアル移動平均クロスオーバーデイトレード先物戦略

概要

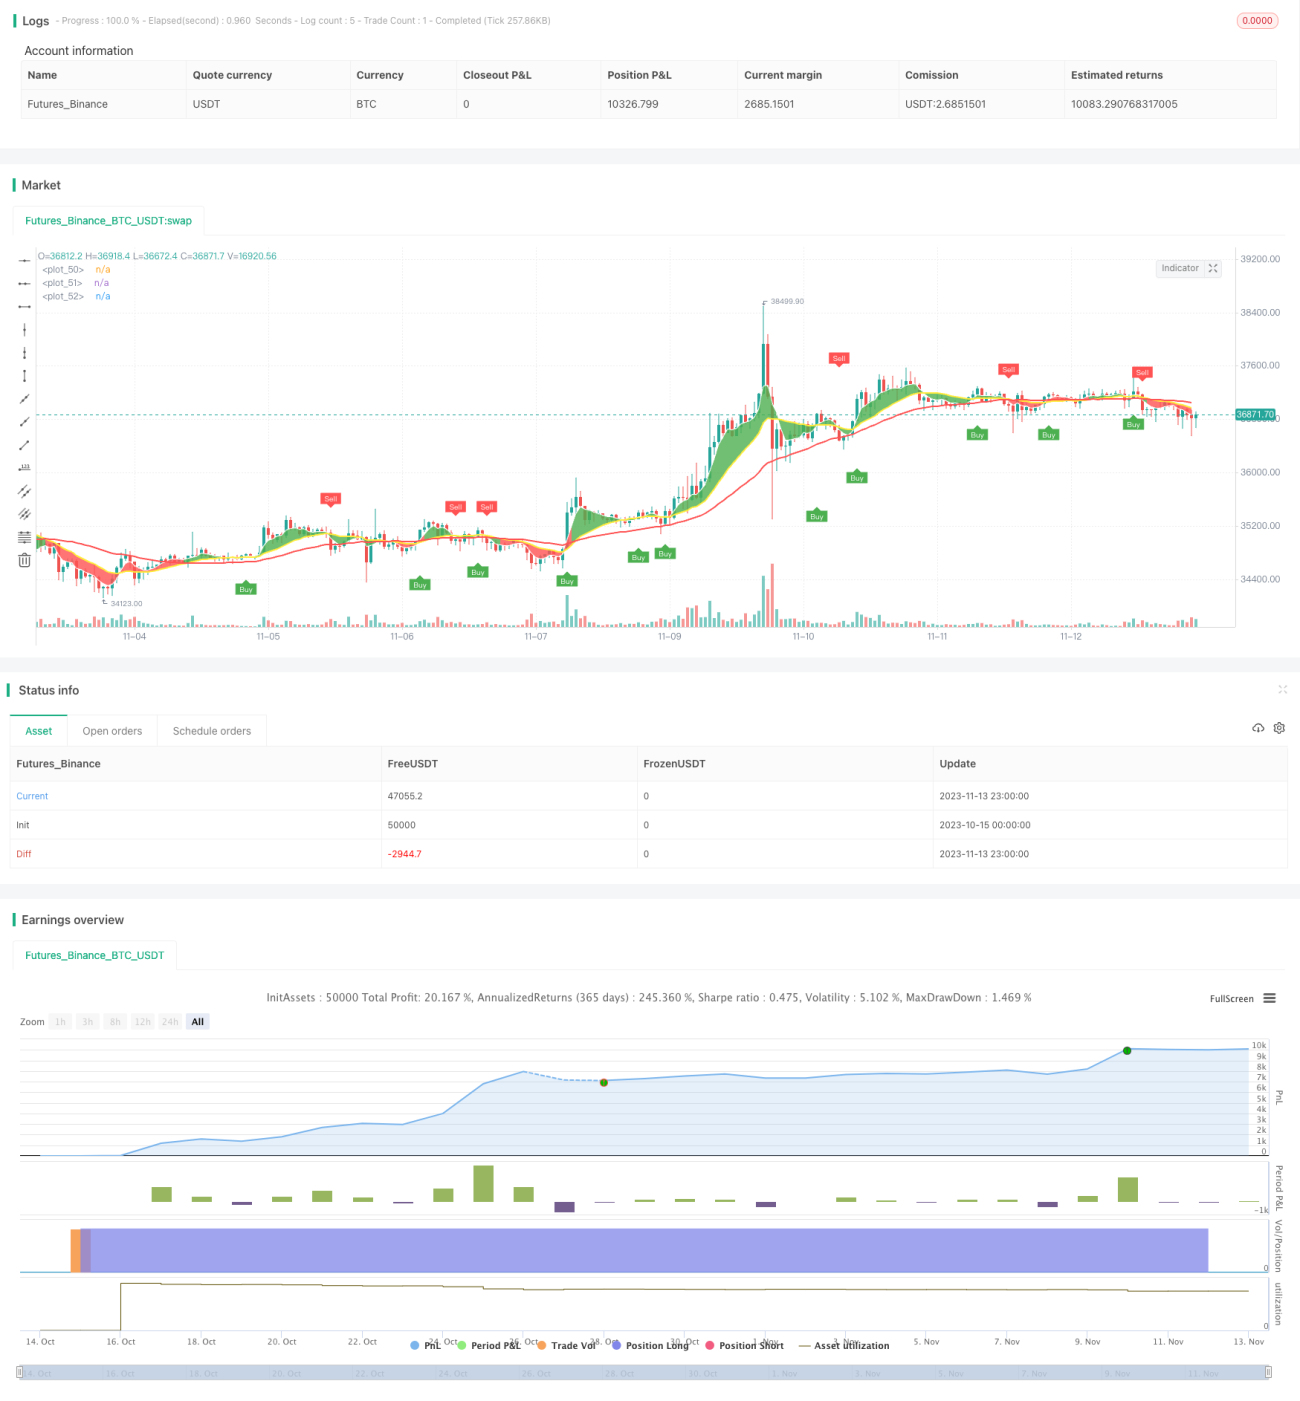
この戦略は,二均線交差の原理を適用し,ATR指標とストップ・ロストを設定し,取引時間制御を補助し,日取引期貨契約に適した戦略を設計した. 戦略は単純明快で,容易に掌握し,初心者向けに適している.

戦略原則

この戦略は,5周期と20周期のWMA平均線交差を入場信号として使用する. 5周期線が下から20周期線を突破すると,多行する. 5周期線が上から20周期線を突破すると,空きをする. 同時に,戦略は50周期WMA平均線を用い,トレンドの方向を判断する. 価格が平均線を突破する方向が大トレンドの方向と一致する時のみ,取引信号が生じる.

さらに,戦略は,ATR指標を用い,ストップ・ストップ・ポジションを設定する.ATR指標は,動的に市場の変動幅を反映する.戦略は,ATR指標の数値を,倍数 (例えば3倍) で掛け,ストップ・ストップ・ポジションを決定し,単一損失を制御する.

最後に,戦略は,米国取引時間 ((9:00~14:30 CST) のみで取引シグナルをトリガーすること.これは,開市と閉市の時間帯で取引を避けるため,これらの時間帯の波動が大きいため,偽信号が形成されやすいからです.

優位分析

この戦略の利点は以下の通りです.

  1. 双均線交差を使用すると,トレンドの転換点を効果的に捕捉し,タイムリーに入場できます.

  2. 大トレンドを判断し,ノイズ取引信号の一部をフィルタリングし,逆操作を避ける.

  3. ATR指標を適用して,ストップ・ローズを動的に調整し,単一損失を効果的に制御する.

  4. 市場開盤と閉盤の激しい波動を避けるため,取引時間を制限します.

  5. 戦略のルールはシンプルでわかりやすく,理解しやすく,実行しやすく,初心者にも適しています.

  6. 平均線周期,ATR倍数,取引時間など,カスタマイズ可能なパラメータ,最適化戦略.

リスク分析

この戦略には以下のリスクもあります.

  1. 震災の場合は,より大きな被害が起こる可能性があります.

  2. 双均線交差には遅延があり,短線突破を逃す可能性があります.

  3. ATRパラメータを正しく設定しない場合,止損が大きすぎたり小さすぎたりする可能性があります.

  4. 基本情報を見逃して,技術的な指標にだけ頼る.

  5. 取引の種類や周期が不適切であることも戦略の効果に影響します.

  6. 機械取引システムには,利回りの危険性があります.

  7. 異なる取引時間帯のパラメータは調整する必要があります.

これは,パラメータ最適化,指標組み合わせ,適切な人工介入などの方法によって改善する必要があります.

最適化の方向

この戦略は以下の点で最適化できます.

  1. EMA,DMAなどの異なる均線システムを試してください.

  2. MACD,RSIなどの他の技術指標のフィルターを追加します.

  3. ATRパラメータを最適化して,止損ストップを合理的にする.

  4. 取引量指数と組み合わせた高効率のエントリーポイントを検索する

  5. 異なる品種特性に合わせてパラメータを調整する。

  6. 基本的要素を組み合わせて,反市場操作を避ける.

  7. 機械学習の要素を加え,ニューラルネットワークを使ってデータをモデル化する.

  8. 複数のサイクルを組み合わせて,より多くの取引機会を模索する.

  9. 戦略の組み合わせと安定性を構築する

要約する

この戦略は,全体的に比較的シンプルで,初心者の実地での練習に適しています.同時に,多くの技術指標や機械学習方法を導入して改善する大きな最適化余地があります.また,異なる取引品種特性と市場環境に応じてパラメータを調整することも重要です.要するに,この戦略は,量化取引初心者にとって参考枠を提供していますが,実態に応じて継続的にテストして最適化する必要があります.

ストラテジーソースコード
/*backtest
start: 2023-10-15 00:00:00
end: 2023-11-14 00:00:00
period: 1h
basePeriod: 15m
exchanges: [{"eid":"Futures_Binance","currency":"BTC_USDT"}]
*/

// This source code is subject to the terms of the Mozilla Public License 2.0 at https://mozilla.org/MPL/2.0/
// © james4392010

//@version=4

strategy(title="DayTradingFutures Cross-Strategy", overlay=true)


// === GENERAL INPUTS ===
Periods = input(title="ATR Period", type=input.integer, defval=10)
src = input(hl2, title="Source")
Multiplier = input(title="ATR Multiplier", type=input.float, step=0.1, defval=3.0)
changeATR= input(title="Change ATR Calculation Method ?", type=input.bool, defval=true)
showsignals = input(title="Show Buy/Sell Signals ?", type=input.bool, defval=true)
//highlighting = input(title="Highlighter On/Off ?", type=input.bool, defval=true)
atr2 = sma(tr, Periods)
atr= changeATR ? atr(Periods) : atr2
up=src-(Multiplier*atr)
up1 = nz(up[1],up)
up := close[1] > up1 ? max(up,up1) : up
dn=src+(Multiplier*atr)
dn1 = nz(dn[1], dn)
dn := close[1] < dn1 ? min(dn, dn1) : dn


wmaFastSource   = input(defval = close, title = "Fast WMA Source")
wmaFastLength   = input(defval = 5, title = "Fast WMA Period")
wmaSlowSource   = input(defval = close, title = "Slow WMA Source")
wmaSlowLength   = input(defval = 20, title = "Slow WMA Period")
wmaDirectionSource  = input(defval = close, title = "Trend 50 Period Source")
wmaDirectionLength  = input(defval = 50, title = "Trend 50 Period")
timeinrange(res, sess) => time(res, sess) != 0


// === SERIES SETUP ===
/// a couple of ma's..
wmaFast = wma(close, 5)
wmaSlow = wma(close, 20)
wmaDirection = wma(close, 50)


// === PLOTTING ===
fast = plot(series=wmaFast, color=color.white, linewidth=2)
slow = plot(series=wmaSlow, color=color.yellow, linewidth=2)
direction = plot(series=wmaDirection, color=color.red, linewidth=2)


// === INPUT BACKTEST RANGE ===

//fromDay = input(defval = 1, title = "From Day", minval = 1, maxval = 31)
//fromMonth = input(defval = 1, title = "From Month", minval = 1, maxval = 12)
//fromYear = input(defval = 2022, title = "From Year", minval = 2022)
 
// To Date Inputs
//toDay = input(defval = 1, title = "To Day", minval = 1, maxval = 31)
//toMonth = input(defval = 1, title = "To Month", minval = 1, maxval = 12)
//toYear = input(defval = 2022, title = "To Year", minval = 2022)
//startDate = timestamp(fromYear, fromMonth, fromDay)
//finishDate = timestamp(toYear, toMonth, toDay)
//inDateRange= (time >= fromDay, fromMonth, fromYear and time <= toDay, toMonth, toYear) 


// === FUNCTION EXAMPLE ===
//inDateRange = (time >= fromDay, fromMonth, fromYear) and (time <= toDay, toMonth, toYear)


// === LOGIC ===

enterLong = crossover(wmaFast, wmaSlow) and close > wmaDirection and timeinrange(timeframe.period, "0900-1430")
enterShort = crossunder(wmaFast, wmaSlow) and close < wmaDirection and timeinrange(timeframe.period, "0900-1430")

//trend := nz(trend[1], trend)
//trend := trend == -1 and close > dn1 ? 1 : trend == 1 and close < up1 ? -1 : trend
//upPlot = plot(trend == 1 ? up : na, title="Up Trend", style=plot.style_linebr, linewidth=2, color=color.green)

buySignal = enterLong 
//plotshape(enterLong ? up : na, title="UpTrend Begins", location=location.absolute, style=shape.circle, size=size.tiny, color=color.green)
plotshape(enterLong and showsignals ? up : na, title="Buy", text="Buy", location=location.absolute, style=shape.labelup, size=size.tiny, color=color.green, textcolor=color.white)
//dnPlot = plot(trend == 1 ? na : dn, title="Down Trend", style=plot.style_linebr, linewidth=2, color=color.red)

sellSignal = enterShort
//plotshape(enterShort ? dn : na, title="DownTrend Begins", location=location.absolute, style=shape.circle, size=size.tiny, color=color.red)
plotshape(enterShort and showsignals ? dn : na, title="Sell", text="Sell", location=location.absolute, style=shape.labeldown, size=size.tiny, color=color.red, textcolor=color.white)
//mPlot = plot(ohlc4, title="", style=plot.style_circles, linewidth=0)
//longFillColor = highlighting ? (trend == 1 ? color.green : color.white) : color.white
//shortFillColor = highlighting ? (trend == -1 ? color.red : color.white) : color.white
//fill(mPlot, upPlot, title="UpTrend Highligter", color=longFillColor)
//fill(mPlot, dnPlot, title="DownTrend Highligter", color=shortFillColor)
alertcondition(buySignal, title="Buy", message="Buy!")
alertcondition(sellSignal, title="Sell", message="Sell!")
//changeCond = trend != trend[1]
//alertcondition(changeCond, title="SuperTrend Direction Change", message="SuperTrend has changed direction!")


// Entry for strategy //

//tp=input(25,title="TakeProfit")
//sl=input(40,title="StopLoss")

strategy.entry("Long",1, when=buySignal)
//strategy.exit("Exit",profit=tp,loss=sl)
//strategy.exit("TakeProfit",profit=tp)
//strategy.exit("StopLoss",loss=sl)

strategy.entry("Short",1, when=sellSignal)
//strategy.exit("Exit",profit=tp,loss=sl)
//strategy.exit("TakeProfit",profit=tp)
//strategy.exit("StopLoss",loss=sl)
//strategy.exit("Exit", wmaFastwmaSlow)

//Buy and Sell Signals

//strategy.close_all(when =not timeinrange(timeframe.period, "1000-1430"))   


// === FILL ====

fill (fast, slow, color = wmaSlow > wmaDirection ? color.green : color.red)
//fill(when=enterLong, tp, color = color.new(color.green, 90), title = "Profit area")
//fill(when=enterLong, sl, color = color.new(color.red, 90), title = "Loss area")
//fill(when=enterShort, tp, color = color.new(color.green, 90), title = "Profit area")
//fill(when=enterShort, sl, color = color.new(color.red, 90), title = "Loss area")