トレンドフォロー型短期取引戦略


作成日: 2023-11-16 11:11:32 最終変更日: 2023-11-16 11:11:32
コピー: 0 クリック数: 667
1
フォロー
1617
フォロワー

トレンドフォロー型短期取引戦略

概要

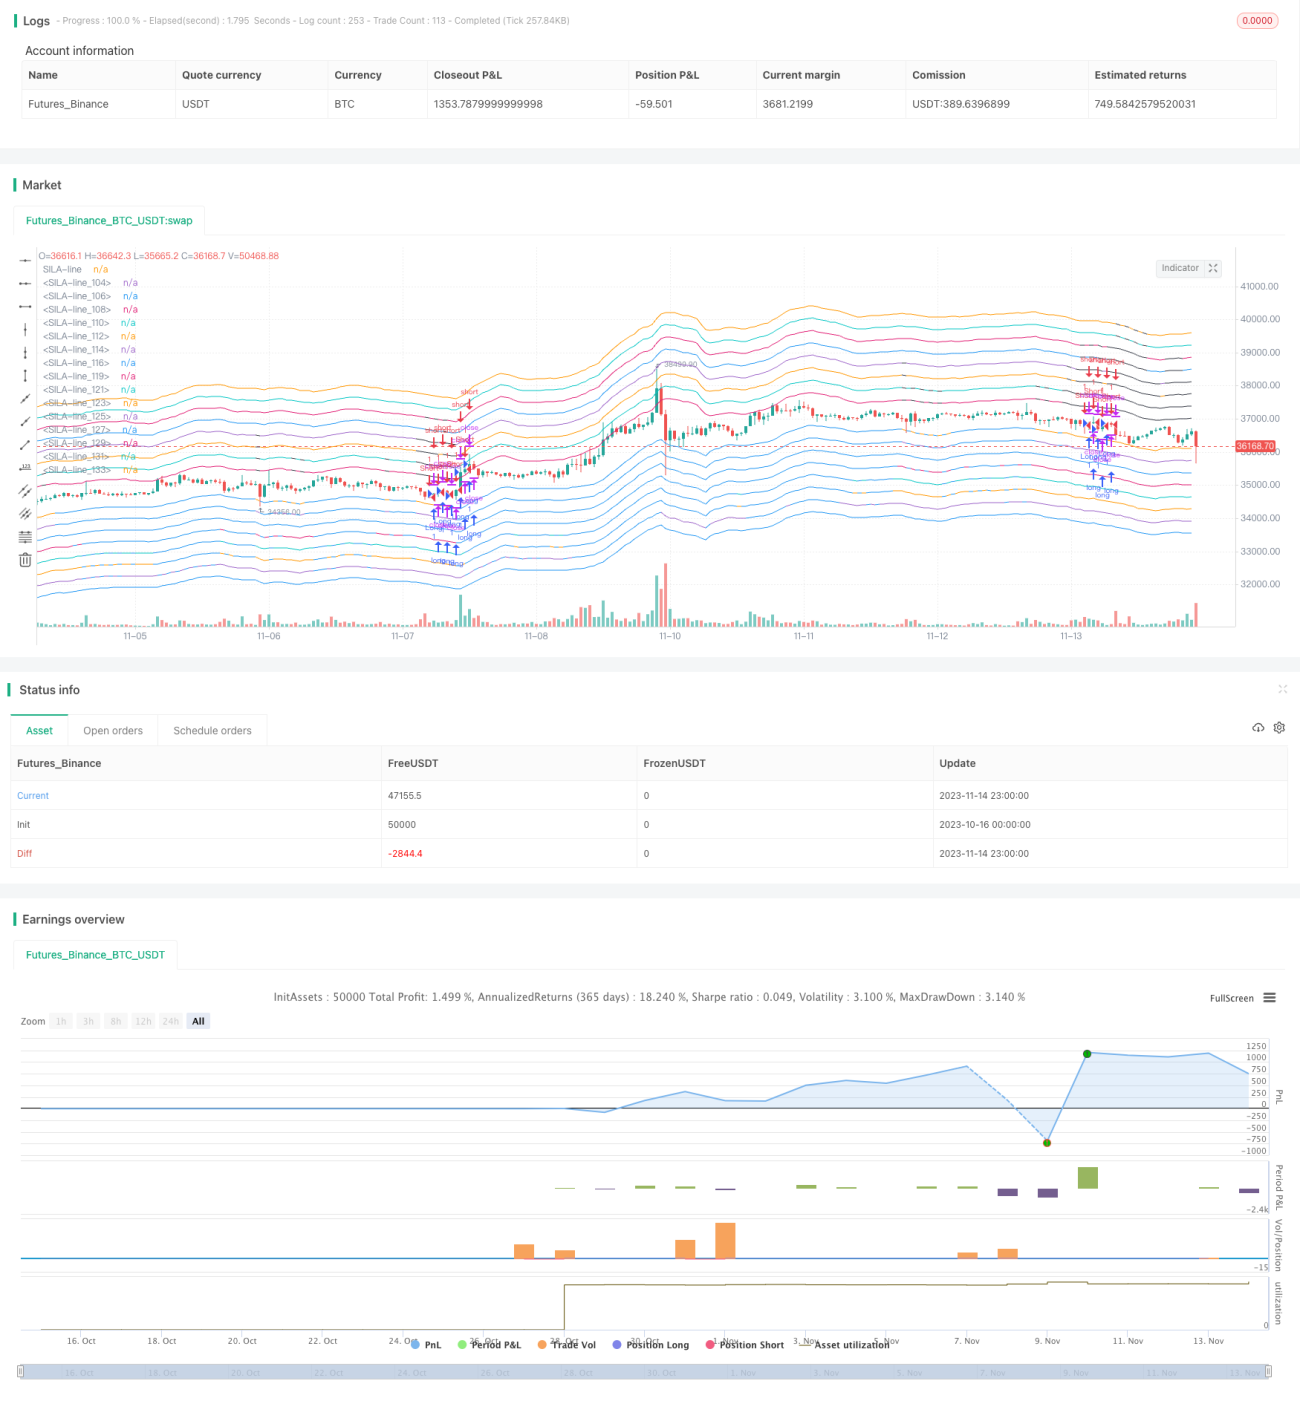
この戦略は,複数の指標に基づいてトレンドを判断するショートラインの取引戦略である.これは,WOW,BMA,BarColor,SuperTrend,DI,TTS,RSI,WTOなどの8つの指標を総合的に使用してトレンドの方向を判断し,購入と販売の決定を下す.

戦略原則

この戦略は,WOW,BMA,BarColor,SuperTrend,DI,TTS,RSI,WTOの8つの指標のトレンド方向を計算して判断します.

WOW指数は,価格内の実体位置に基づいて多空トレンドを判断する.実体位置が上線に近づくと,看板;下線に近づくと,下落である.

BMA指数は,SMA多空関係に基づいてトレンドを判断する.SMAの閉盘価格がSMAの開盘価格を看板として穿越し,下折は看板として穿越する.

BarColor指数は,K線の色によってトレンドを判断し,連続した陽線が看板で,陰線は下落である.

スーパートレンド指数は,平均波動範囲に基づいて価格トレンドを判断する. 上線上では看板,下線下では下落である.

DI指標は多頭動量大小関係によってトレンドを判断する.多頭動量が空頭動量より大きいと看板,逆は看板である.

TTS指数は,価格と平均線の位置関係に基づいて多空傾向を判断する.

RSIは,相対的に強い指標の位置からトレンドの方向を判断します.

WTO指標は波動性指標の多空によってトレンドの方向を判断する.

この戦略は,この8つの指標の看板の数を統計化し,それに基づいてSILAの看板サポートラインと下落レジスタンスラインを階層的に描きます. サポートラインとレジスタンスラインの数が多くなるほど,トレンド信号が強くなります.

複数の指標が上向きであるとき,閉盘価格が最低レベルのサポートラインの上にある場合は,買入シグナルが生じます.複数の指標が下向きであるとき,閉盘価格が最低レベルのレジスタンスラインの下にある場合は,売出シグナルが生じます.

さらに,この戦略は,短期的な回収の機会を判断するために,K線形状を利用し,トレンドが逆転したときにより有利な入場点を探します.

戦略的優位性

  1. 複数の指標の判断傾向を統合し,判断の正確性を向上させる

この戦略は単一の指標に依存するのではなく,一般的な8つのトレンド判断指標を総合的に使用し,トレンドの多面的な判断を行うことで,判断の正確性と信頼性を向上させることができます.

  1. SILAシステムは,トレンド信号の強さを認識するために,抵抗を分級して描画する.

この戦略は,複数の指標の看板・看板信号に基づいて,SILAシステムを使用して,複数の分級のサポートラインとレジスタンスラインを描画する.線の数が多くなるほど,トレンドシグナルが強くなる.これは,トレーダーが信号の強さをさらに識別するのに役立ちます.

  1. K線形を組み合わせてリコールチャンスを探し,入場ポイントが優れている.

この戦略は,トレンド指標による方向判断だけでなく,K線形状と組み合わせて,短期的な回調の機会を探し,トレンドが逆転した時点で入場し,より優れている入場ポイントの位置を争うことができる.

戦略リスク

  1. 複数の指標の違いがある場合

この戦略は,複数の指標を採用しており,これらの指標の間の判断は,特定の状況で不一致が生じ,トレーダー自身のバランスを必要とし,意思決定の難易度を高めています.

  1. 値の設定は,最適化する必要があります.

この策略の多くの指標は,デフォルトパラメータを使用しており,実際のアプリケーションでは,最適な効果を得るためにパラメータを最適化する必要があり得る.

  1. システム上のリスクも考慮すべきです

大規模なブラック・スヴァン事件が発生した場合,システムリスクは通常の技術指標を無効にすることになり,市場のシステムリスクの評価に注意する必要があります.

  1. リスクの撤回

トレンドに沿った取引の撤回は,拡大段階ではより大きくなる可能性があり,撤回を制限するために単一の取引の規模を制御する注意が必要です.

戦略最適化の方向性

  1. 指数パラメータのテスト最適化

周期長さ,数値の大きさなどの各指標のパラメータを,より体系的な方法によって最適化して,最適なパラメータの組み合わせを探すことができる.

  1. 損失を抑える方法

移動ストップまたはパーセンテージストップを追加して撤回を制御することを考えることができます.

  1. 結合量能指数

MAVP,OBV等量能指標をトレンド指標と組み合わせて導入し,戦術的決定の正確性を向上させることができる.

  1. ポジション管理の最適化

異なる市場段階における保有比率を研究して,トレンドがより明るくなる時にポジションを拡大することができる.

要約する

この戦略Overallは,複数の指標を集約してトレンドの方向を判断し,SILAシステムを使用して信号の強さを認識し,K線形でのエントリーを最適化します.この戦略は,判断の正確性を向上させることができますが,異なる指標の差異のリスクに注意する必要があります.次のステップは,パラメータ最適化,ストップ損失最適化,量能結合などの方法により,この戦略をさらに改善することができます.

ストラテジーソースコード
/*backtest
start: 2023-10-16 00:00:00
end: 2023-11-15 00:00:00
period: 1h
basePeriod: 15m
exchanges: [{"eid":"Futures_Binance","currency":"BTC_USDT"}]
*/

// (c) Noro
//2017

//@version=2

strategy(title="Noro's SILA v1.6L Strategy", shorttitle="SILA v1.6L str", overlay=true)

//settings
sensup = input(5, title="Uptrend-sensivity", minval = -8, maxval = 8)
sensdn = input(5, title="Downtrend-sensivity", minval = -8, maxval = 8)
usewow = input(true, title="Use trend-indicator WOW?")
usebma = input(true, title="Use trend-indicator BestMA?")
usebc = input(true, title="Use trend-indicator BarColor?")
usest = input(true, title="Use trend-indicator SuperTrend?")
usedi = input(true, title="Use trend-indicator DI?")
usetts = input(true, title="Use trend-indicator TTS?")
usersi = input(true, title="Use trend-indicator RSI?")
usewto = input(true, title="Use trend-indicator WTO?")
dist = input(100, title="Distance SILA-lines", minval = 0, maxval = 100)
usetl = input(true, title="Need SILA-lines?")
usebgup = input(true, title="Need uptrend-background?")
usebgdn = input(true, title="Need downtrend-background?")
usealw = input(true, title="Need background always?")
usearr = input(true, title="Need new-trend-arrows?")
useloco = input(true, title="Need locomotive-arrows?")
usemon = input(true, title="Need money?") //joke

// WOW 1.0 method
lasthigh = highest(close, 30)
lastlow = lowest(close, 30)
center = (lasthigh +lastlow) / 2
body = (open + close) / 2
trend1 = body > center ? 1 : body < center ? -1 : trend1[1]
trend2 = center > center[1] ? 1 : center < center[1] ? -1 : trend2[1]
WOWtrend = usewow == true ? trend1 == 1 and trend2 == 1 ? 1 : trend1 == -1 and trend2 == -1 ? -1 : WOWtrend[1] : 0

// BestMA 1.0 method
SMAOpen = sma(open, 30)
SMAClose = sma(close, 30)
BMAtrend = usebma == true ? SMAClose > SMAOpen ? 1 : SMAClose < SMAOpen ? -1 : BMAtrend[1] : 0

// BarColor 1.0 method
color = close > open ? 1 : 0
score = color + color[1] + color[2] + color[3] + color[4] + color[5] + color[6] + color[7]
BARtrend = usebc == true ? score > 5 ? 1 : score < 3 ? -1 : BARtrend[1] : 0

// SuperTrend mehtod
Up = hl2 - (7 * atr(3))
Dn = hl2 + (7 * atr(3))
TrendUp = close[1] > TrendUp[1] ? max(Up, TrendUp[1]) : Up
TrendDown = close[1] < TrendDown[1] ? min(Dn, TrendDown[1]) : Dn
SUPtrend = usest == true ? close > TrendDown[1] ? 1: close < TrendUp[1]? -1 : SUPtrend[1] : 0

//DI method
th = 20
TrueRange = max(max(high-low, abs(high-nz(close[1]))), abs(low-nz(close[1])))
DirectionalMovementPlus = high-nz(high[1]) > nz(low[1])-low ? max(high-nz(high[1]), 0): 0
DirectionalMovementMinus = nz(low[1])-low > high-nz(high[1]) ? max(nz(low[1])-low, 0): 0
SmoothedTrueRange = nz(SmoothedTrueRange[1]) - (nz(SmoothedTrueRange[1])/14) + TrueRange
SmoothedDirectionalMovementPlus = nz(SmoothedDirectionalMovementPlus[1]) - (nz(SmoothedDirectionalMovementPlus[1])/14) + DirectionalMovementPlus
SmoothedDirectionalMovementMinus = nz(SmoothedDirectionalMovementMinus[1]) - (nz(SmoothedDirectionalMovementMinus[1])/14) + DirectionalMovementMinus
DIPlus = SmoothedDirectionalMovementPlus / SmoothedTrueRange * 100
DIMinus = SmoothedDirectionalMovementMinus / SmoothedTrueRange * 100
DItrend = usedi == true ? DIPlus > DIMinus ? 1 : -1 : 0

//TTS method (Trend Trader Strategy)
//Start of HPotter's code
//Andrew Abraham' idea
avgTR      = wma(atr(1), 21)
highestC   = highest(21)
lowestC    = lowest(21)
hiLimit = highestC[1]-(avgTR[1] * 3)
loLimit = lowestC[1]+(avgTR[1] * 3)
ret = iff(close > hiLimit and close > loLimit, hiLimit, iff(close < loLimit and close < hiLimit, loLimit, nz(ret[1], 0)))
pos =	iff(close > ret, 1, iff(close < ret, -1, nz(pos[1], 0))) 
//End of HPotter's code

TTStrend = usetts == true ? pos == 1 ? 1 : pos == -1 ? -1 : TTStrend[1] : 0

//RSI method
RSIMain = (rsi(close, 13) - 50) * 1.5
rt = iff(RSIMain > -10, 1, iff(RSIMain < 10, -1, nz(pos[1], 0))) 
RSItrend = usersi == true ? rt : 0

//WTO ("WaveTrend Oscilator") method by LazyBear
//Start of LazyBear's code
esa = ema(hlc3, 10)
d = ema(abs(hlc3 - esa), 10)
ci = (hlc3 - esa) / (0.015 * d)
tci = ema(ci, 21)
//End of LazyBear's code

WTOtrend = usewto == true ? tci > 0 ? 1 : tci < 0 ? -1 : 0 : 0

//plots
trends = usemon == true ? WOWtrend + BMAtrend + BARtrend + SUPtrend + DItrend + TTStrend + RSItrend + WTOtrend: -1 * (WOWtrend + BMAtrend + BARtrend + SUPtrend + DItrend + TTStrend + RSItrend + WTOtrend)
pricehi = sma(high, 10)
pricelo = sma(low, 10)
per = usetl == 1 ? dist / 10000 : 0

color1 = usetl == true ? trends > 0 ? blue : na : na
plot(pricelo * (1 - per), color=color1, linewidth=1, title="SILA-line")
color2 = usetl == true ? trends > 1 ? blue : na : na
plot(pricelo * (1 - 2 * per), color=color2, linewidth=1, title="SILA-line")
color3 = usetl == true ? trends > 2 ? blue : na : na
plot(pricelo * (1 - 3 * per), color=color3, linewidth=1, title="SILA-line")
color4 = usetl == true ? trends > 3 ? blue : na : na
plot(pricelo * (1 - 4 * per), color=color4, linewidth=1, title="SILA-line")
color5 = usetl == true ? trends > 4 ? blue : na : na
plot(pricelo * (1 - 5 * per), color=color5, linewidth=1, title="SILA-line")
color6 = usetl == true ? trends > 5 ? blue : na : na
plot(pricelo * (1 - 6 * per), color=color6, linewidth=1, title="SILA-line")
color7 = usetl == true ? trends > 6 ? blue : na : na
plot(pricelo * (1 - 7 * per), color=color7, linewidth=1, title="SILA-line")
color8 = usetl == true ? trends > 7 ? blue : na : na
plot(pricelo * (1 - 8 * per), color=color8, linewidth=1, title="SILA-line")

color10 = usetl == true ? trends < 0 ? black : na : na
plot(pricehi * (1 + per), color=color10, linewidth=1, title="SILA-line")
color11 = usetl == true ? trends < -1 ? black : na : na
plot(pricehi * (1 + 2 * per), color=color11, linewidth=1, title="SILA-line")
color12 = usetl == true ? trends < -2 ? black : na : na
plot(pricehi * (1 + 3 * per), color=color12, linewidth=1, title="SILA-line")
color13 = usetl == true ? trends < -3 ? black : na : na
plot(pricehi * (1 + 4 * per), color=color13, linewidth=1, title="SILA-line")
color14 = usetl == true ? trends < -4 ? black : na : na
plot(pricehi * (1 + 5 * per), color=color14, linewidth=1, title="SILA-line")
color15 = usetl == true ? trends < -5 ? black : na : na
plot(pricehi * (1 + 6 * per), color=color15, linewidth=1, title="SILA-line")
color16 = usetl == true ? trends < -6 ? black : na : na
plot(pricehi * (1 + 7 * per), color=color16, linewidth=1, title="SILA-line")
color17 = usetl == true ? trends < -7 ? black : na : na
plot(pricehi * (1 + 8 * per), color=color17, linewidth=1, title="SILA-line")

//background
col = usebgup == true and trends >= sensup ? 1 : usebgdn == true and trends <= (-1 * sensdn) ? -1 : usealw == true ? col[1] : 0
bgcolor = col == 1 ? lime : col == -1 ? red : na
//bgcolor(bgcolor, transp=70)

//arrows
posi = trends >= sensup ? 1 : trends <= (-1 * sensdn) ? -1 : posi[1]
arr = usearr == true ? posi == 1 and posi[1] < 1 ? 1 : posi == -1 and posi[1] > -1 ? -1 : na : na
//plotarrow(arr == 1 ? 1 : na, title="UpArrow", colorup=blue, maxheight=60, minheight=50, transp=0)
//plotarrow(arr == -1 ? -1 : na, title="DnArrow", colordown=blue, maxheight=60, minheight=50, transp=0)

//locomotive
bar = close > open ? 1 : close < open ? -1 : 0
locotop = bar == -1 and bar[1] == 1 and bar[2] == 1 ? 1 : 0
locobot = bar == 1 and bar[1] == -1 and bar[2] == -1 ? 1 : 0
entry = useloco == false ? 1 : posi == posi[1] ? (locotop == 1 and posi == -1) or (locobot == 1 and posi == 1) ? 1 : entry[1] : 0
//plotarrow(locobot == 1 and entry[1] == 0 and posi == 1 ? 1 : na, title="UpLocomotive", colorup=yellow, maxheight=60, minheight=50, transp=0)
//plotarrow(locotop == 1 and entry[1] == 0 and posi == -1 ? -1 : na, title="DnLocomotive", colordown=yellow, maxheight=60, minheight=50, transp=0)

longCondition = arr == 1
if (longCondition)
    strategy.entry("Long", strategy.long)

shortCondition = arr == -1
if (shortCondition)
    strategy.entry("Short", strategy.short)