ダブルスーパートレンドフォローストップロス戦略

概要
この戦略は,超強指数平滑移動平均と相対的に強い指数に基づいて,二重トレンド追跡機構を設計し,トレンドを正確に判断し,合理的な止損停止点を設定します.この戦略は,トレンドを基準にストップ・ロスト・ストップ・ストップの設定,二重トレンド判断などの特性を有し,個々の取引のリスクを効果的に制御し,トレンドの状況で超強の利益を得ることができます.
戦略原則
-
超強指数平移平均を計算して,主要トレンドの方向を判断する。超強指数平移平均は,トレンドの方向を正確に判断し,理想的な入場点を与える。
-
比較強弱指数 (RSI) を計算し,トレンドの判断に役立つ指標である. RSI高値が超買い区で,牛市トレンドを表す. RSI低値が超売り区で,熊市トレンドを表す.
-
閉店価格が超強指数平移平均線を越えたとき,多めに;閉店価格が超強指数平移平均線を下回ったとき,空っぽに.
-
合理的にストップ・ロスを設定する. オーバー・タイムでは,超強指数平移平均をストップ・ラインとして,超強指数平移平均と合理的な利益のストップ・ポイントとして;空いている時は,超強指数平移平均をストップ・ラインとして,超強指数平移平均と合理的な利益のストップ・ポイントとして.
-
ストップ・ロスは,市場の変動に合わせて浮動する.市場が有利な方向に進むと,ストップ・ロスは有利な方向に移動し,利益を確保する.
-
RSIが超強指数平移平均線方向と一致するときは,現在のトレンドが強いことを示す.この時点で戦略は入場する. RSIが超強指数平移平均線方向と一致しないときは,トレンドの転換の可能性を示し,この時点で戦略は一時的に出場する.
優位分析
-
双重トレンド判定メカニズムにより,誤信号が減り,戦略の安定性が向上する.
-
ストップ・ロスはトレンドに沿って動き,利益を最大限に固定し,過早なストップ・ロスを回避します.
-
RSIの指標は,弱点のある取引信号をフィルタリングします.
-
利潤を最大化するために,合理的な停止位置を設定します.
-
戦略のパラメータは調整可能で,異なる品種や状況の特徴に応じて最適化できます.
-
戦略の撤回は制御可能で,リスク管理能力は高い.
リスク分析
-
重要な政策発表などの突発的な事件が発生した場合,市場が激しく波動し,止損点が突破され,大きな損失を招く可能性があります. 止損点を適切に緩めることができるか,または重大なリスクイベントが起こる前に,時間内に退場することができます.
-
パラメータ設定が不適切で,ストップ・ストップ・ポイントが不合理に設定され,損失を拡大したり,利益を縮小したりする可能性があります.
-
多空混戦段階では,RSIと超強指数平滑移動平均は一定偏差が発生し,戦略が誤った取引シグナルを生じさせる可能性があります.この時には一時的に取引を中止し,明確なトレンドが再開されるのを待つことができます.
最適化の方向
-
ATR周期のパラメータを最適化して,異なる品種の特性に合わせる.
-
RSIパラメータの設定を最適化して,より安定した信頼性の高い補助トレンド判断条件を見つける.
-
ブリン帯,KDJなどの他の指標判断と組み合わせて,より正確な出場入場基準を設定する.
-
トラッキングストップ,階段ストップ,シャットラインストップなどの様々なストップ戦略をテストし,利益レベルを最適化します.
-
ポジション管理戦略を反省結果に合わせて調整し,単一取引のリスクを低減する.
要約する
この戦略は,全体として強い安定性および継続的な収益性を持っています. 二重トレンド判断機構は,ノイズを効果的にフィルターし,止損ストップ戦略は,利益をロックし,リスクを制御することができます. パラメータ設定と入場出場条件を継続的に最適化することにより,戦略は,異なる市場環境で良好なパフォーマンスを得ることができます. 全体として,この戦略は,量化取引の優れた戦略のテンプレートとして,研究と適用を重点にすることができます.
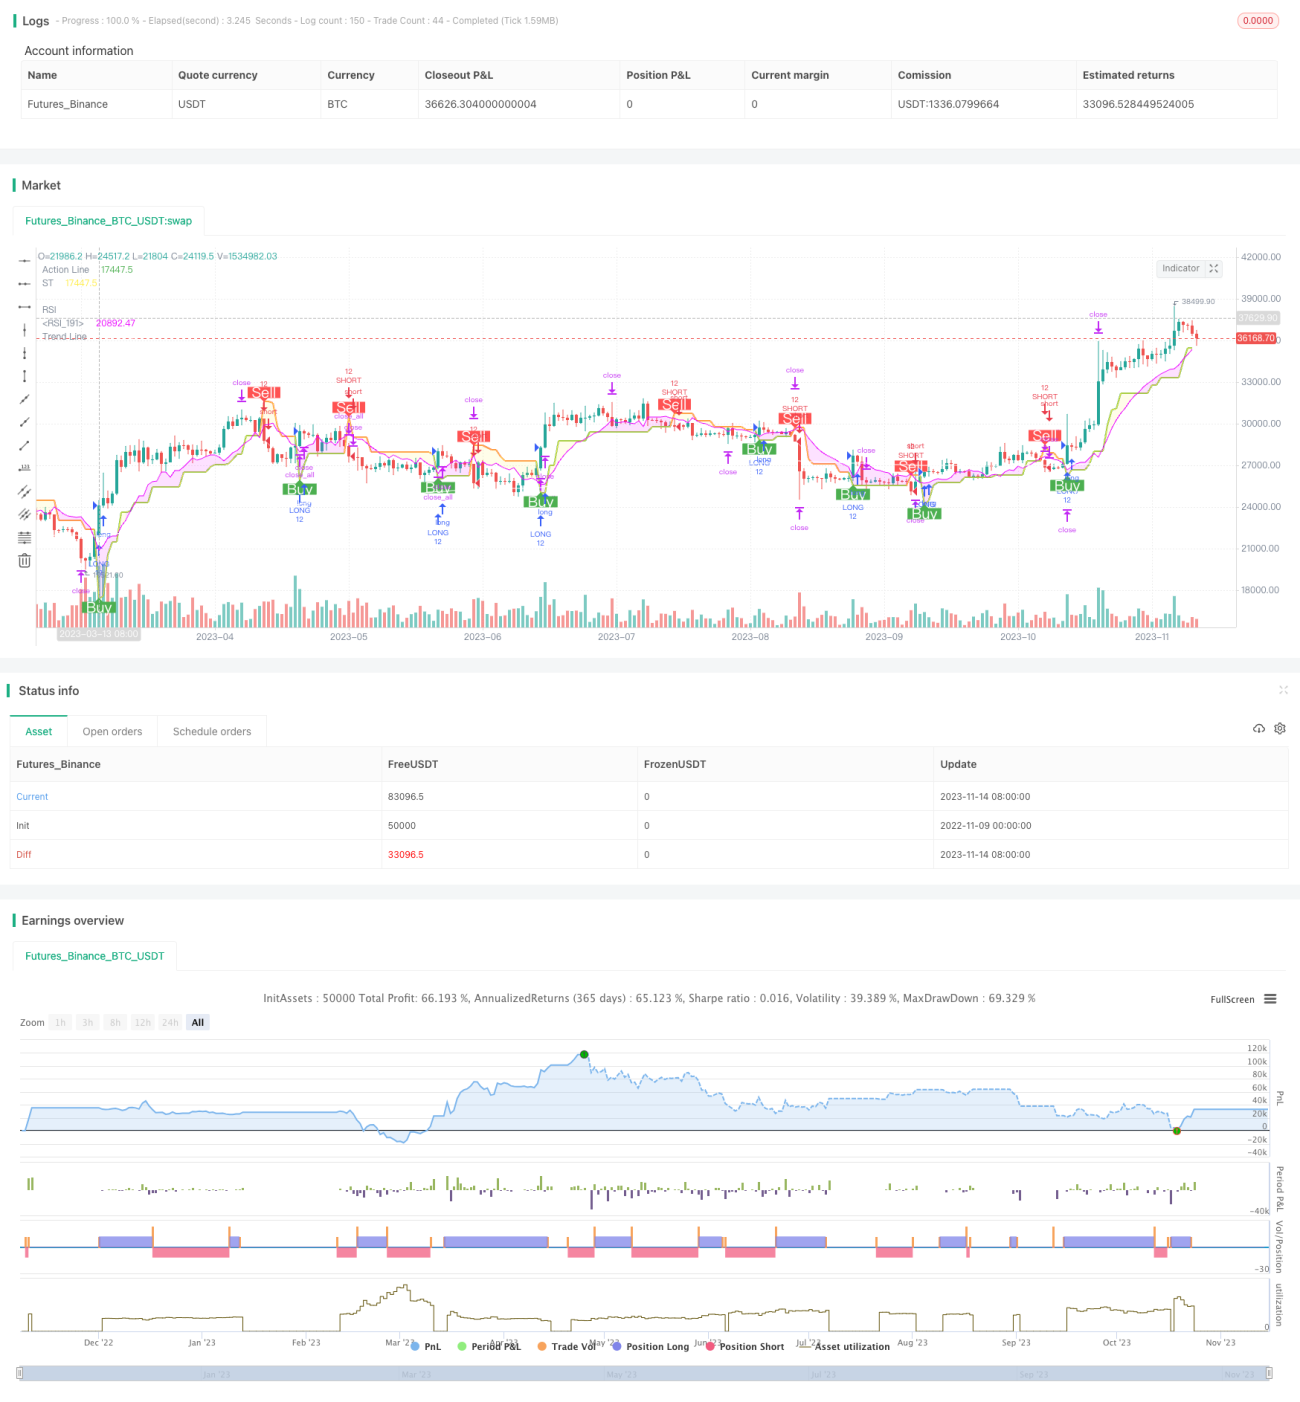
/*backtest
start: 2022-11-09 00:00:00
end: 2023-11-15 00:00:00
period: 1d
basePeriod: 1h
exchanges: [{"eid":"Futures_Binance","currency":"BTC_USDT"}]
*/

//@version=5
//
// ▒▒▒▒▒▒▒▒▒▒▒▒▒▒▒▒▒▒▒▒▒▒▒▒▒▒▒▒▒▒▒▒▒▒▒▒▒▒▒▒▒▒▒▒▒▒▒▒▒▒▒▒▒▒▒▒▒▒▒▒▒▒▒▒▒▒▒▒▒▒▒▒▒▒▒▒▒▒▒▒▒▒▒▒▒▒▒▒▒▒▒▒▒▒▒▒▒▒▒▒▒▒▒▒▒▒▒▒▒▒▒▒▒▒
// ------------------------------------------------------------------------------ 1