ダブル移動平均クロスオーバー戦略


作成日: 2023-11-16 17:50:52 最終変更日: 2023-11-16 17:50:52
コピー: 0 クリック数: 688
1
フォロー
1617
フォロワー

ダブル移動平均クロスオーバー戦略

概要

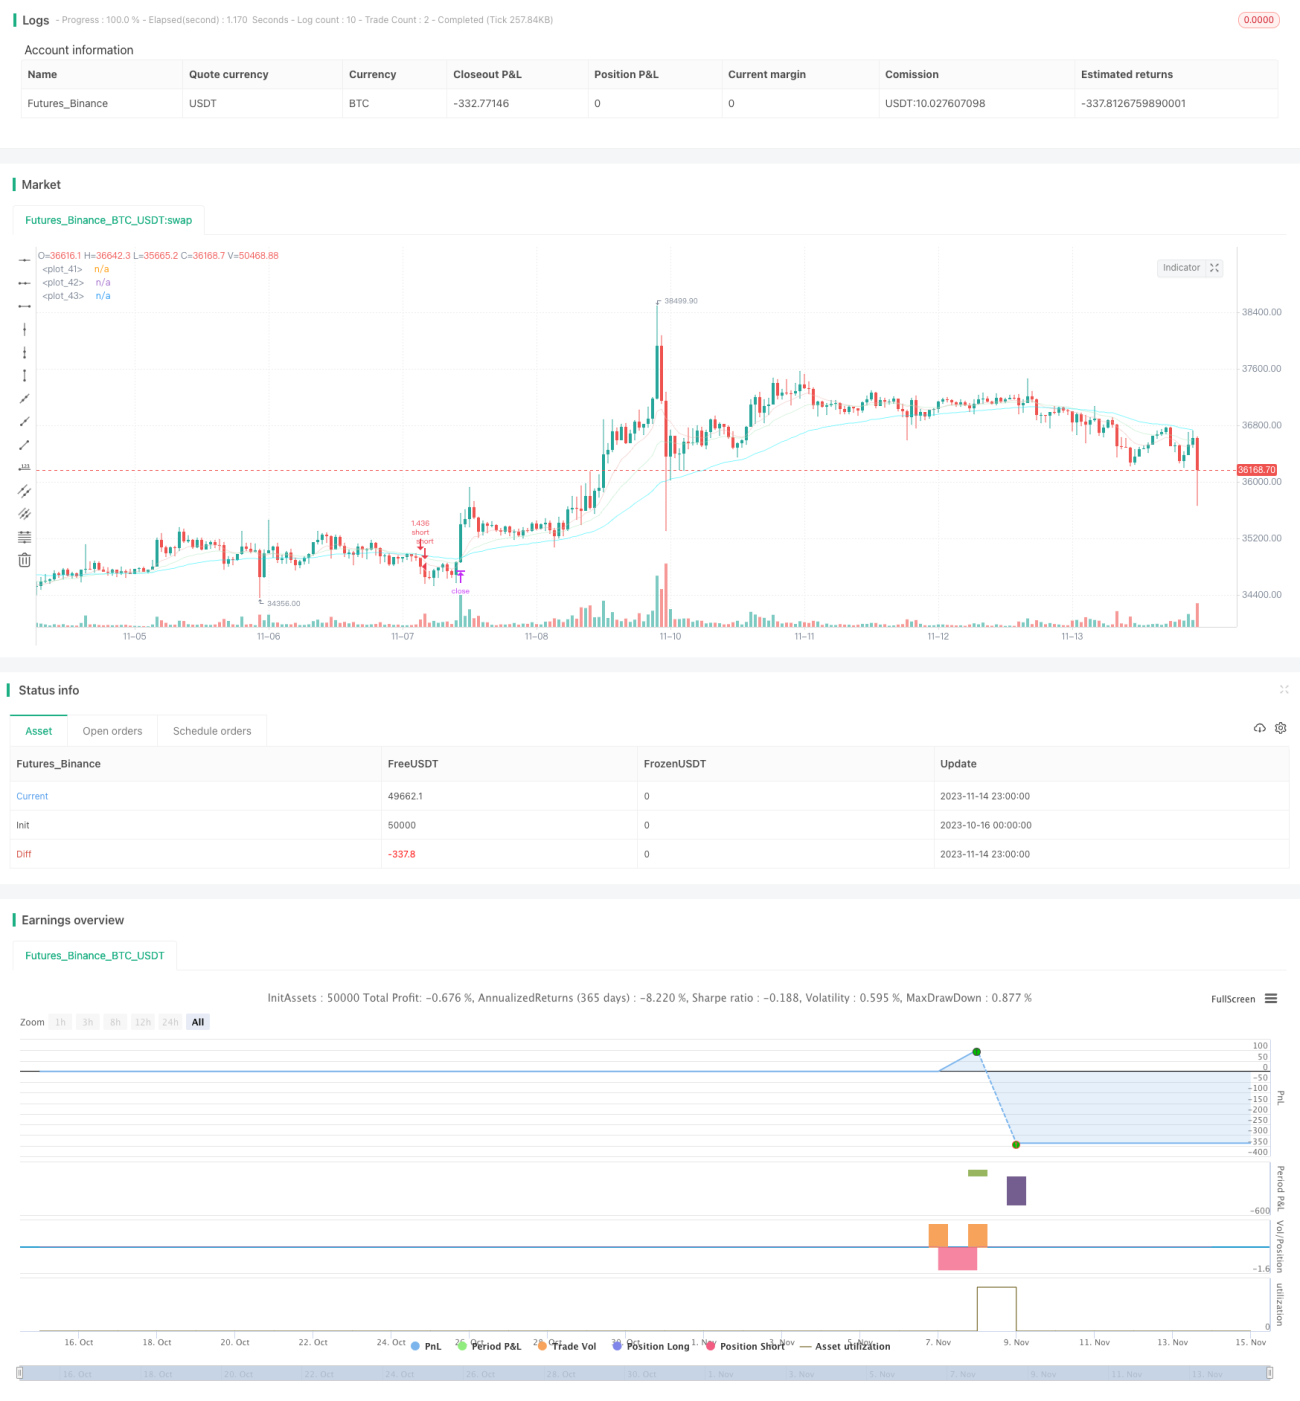
双移動平均線交差策は,異なる周期の移動平均線を計算して,価格の傾向方向を判断し,トレンド追跡を実現する.短周期平均線上を長周期平均線に横切るときに多行し,短周期平均線下を長周期平均線に横切るときに空行する.これは典型的なトレンド追跡策である.

戦略原則

この戦略は,9周期,21周期,および50周期のインデックス移動平均線 (EMA) に基づいている.このうち,9周期EMAは短期トレンドを表し,21周期EMAは中期トレンドを表し,50周期EMAは長期トレンドを表す.

9周期EMA上から21周期EMAを通過すると,短期トレンドが上昇に転移し,多額になる. 9周期EMA下から21周期EMAを通過すると,短期トレンドが低下して空白になる. 交差関数crossover () を用いて平均線の交差を判断する.

コードには,長仓と空仓の開仓,停止,止損の論理が設定されている.開仓条件は均線上穿戴または下穿戴である.多頭ストップは入場価格×(1+の入力ストップの比率),空頭ストップは入場価格×(1-の入力ストップの比率である.多頭ストップは入場価格×1-の入力ストップの比率),空頭ストップは入場価格×(1+の入力ストップの比率である.

さらに,コードには,トレンドフィルター,均線上下を通過する前のK線が振動しないように要求するフィルター,および,戦略権益がN日均線以下にならないように要求する資金活用率フィルターなどのフィルタリング条件が追加されています.これらのフィルタリング条件は,偽信号を一定程度に防ぐことができます.

全体として,この戦略は,価格のトレンド方向を判断するために双 EMA の交差を用い,合理的なストップ・ストップ・ロスのロジックを使用して,中長線トレンドを捕捉できます.しかし,単一の要因戦略として,そのシグナルは,さらに最適化できるほど安定していない可能性があります.

優位分析

  • 双移動均線交差を用いてトレンドの方向を判断する.原理はシンプルで,容易に理解できる.
  • 長期短期トレンドを判断するために,異なる周期的なEMAを使用します.
  • ストップ・ストップ・損失の論理を設定し,利益をロックし,リスクを制御する.
  • フィルタリング条件を追加すると,偽信号を一定程度にフィルタリングできます.
  • パラメータを自由に設定し,サイクル組み合わせを最適化し,異なる市場環境に適応する.

リスク分析

  • 単一要素戦略として,取引シグナルが十分に安定しない場合がある. 価格が揺れ動いているとき,無意味な取引が複数発生する可能性があります.
  • EMAが交差する時には,価格が一定距離を走っている可能性があり,追いつくリスクがあります.
  • 取引コストを考慮しない場合,現金での収益は減少する可能性があります.
  • ストップ・ロストが設定されず,極端な状況下での損失を制御できない.

どう対処するか?

  1. 信号をより安定させるためにMA周期パラメータを最適化する.
  2. 他の指標と組み合わせたフィルター信号.
  3. 取引量を増やしてコストを削減する.
  4. ストップポイントを設定し,最大損失を制限します.

最適化の方向

この戦略は以下の点で最適化できます.

  1. 移動平均線の周期パラメータを最適化して,最適な周期組み合わせを見つける。自己適応最適化技術,動的最適周期を導入することができる。

  2. 信号品質を向上させるため,MACD,KDなどの他の技術指標のフィルタリング信号を追加する.または,偽信号を自動的にフィルタリングする機械学習を導入する.

  3. 取引量分析と組み合わせて.平均線を突破して取引量が不足すると,信信信号は受信しない.

  4. 突破が起きたとき,震動区間の突破のような前期の変動を考察し,偽突破である可能性がある.

  5. 追跡型ストップ,Chandelier Exitなどのダイナミックなストップメカニズムを確立し,ストップ距離を減らすが,ストップ効果を確実にする.

  6. ポジション管理の最適化,固定ポジション,動的ポジション,レバレッジポジションなど,利回り比率を合理的にする.

  7. 取引コスト,滑り点の影響を全体的に考慮する. ストップ・ストップ・損失比率を最適化して,戦略が実盤で利益を生むようにする.

要約する

この戦略の全体的な構造は合理的で,原理はシンプルで,双EMAの交差によってトレンドの方向を判断し,ストップ・ストップ・ロジックを設定し,トレンドを捕捉することができる.しかし,単一要素戦略として,パラメータ設定,シグナルフィルターなどをさらに最適化して,戦略をより安定させることができる.ストップ・ロジックやポジション管理などのメカニズムを加えると,リスクをさらに低減することができる.全体的に,この戦略は,最適化調整後に安定した投資リターンを得る信頼できるトレンド追跡戦略の枠組みを提供する.

ストラテジーソースコード
/*backtest
start: 2023-10-16 00:00:00
end: 2023-11-15 00:00:00
period: 1h
basePeriod: 15m
exchanges: [{"eid":"Futures_Binance","currency":"BTC_USDT"}]
*/

// This source code is subject to the terms of the Mozilla Public License 2.0 at https://mozilla.org/MPL/2.0/
// © TradingMentalist

//@version=4
strategy("Initial template",initial_capital=1000, overlay=true, pyramiding=0, commission_type=strategy.commission.percent, commission_value=0.04, default_qty_type = strategy.percent_of_equity, default_qty_value = 100, currency = currency.USD)

////////////////////////////////////////////////////////////////////////////////////////////////////////////////////////////////////////////////inputs
//turn on/off longs/shorts / extraneous conditions
longinc=input(true, title="include longs?")
lConSw2=input(true, title="condition two?")
lConSw3=input(true, title="condition three?")
shotinc=input(true, title="include shorts?")
sConSw2=input(true, title="condition two?")
sConSw3=input(true, title="condition three?")

//turn on/off / adjust trade filters (average range/average equity)
sidein2     = input(200, step=10, title='lookback for average range (bars)')
sidein      = input(1, title='filter trades if range is less than (%)')/100
equityIn    = input(40, title='filter trades if equity is below ema()')
sidewayssw  = input(true, title='sideways filter?')
equitysw    = input(true, title='equity filter?')
longtpin    = input(1,step=0.1, title='long TP %')/100
longslin    = input(0.4,step=0.1, title='long SL %')/100
shorttpin   = input(1,step=0.1, title='short TP %')/100
shortslin   = input(0.4,step=0.1, title='short SL %')/100

////////////////////////////////////////////////////////////////////////////////////////////////////////////////////////////////////////////////filters
//(leave as is)
side1       = (close[1] + close[sidein2]) / 2
side2       = close[1] - close[sidein2] 
side3       = side2 / side1
notsideways = side3 > sidein
equityMa    = equitysw ? ema(strategy.equity, equityIn) : 0
equityCon   = strategy.equity >= equityMa

////////////////////////////////////////////////////////////////////////////////////////////////////////////////////////////////////////////////indicators
ma1 = ema(close, 9)
ma2 = ema(close, 21)
ma3 = ema(close, 50)

plot(ma1, color=color.new(#E8B6B0,50))
plot(ma2, color=color.new(#B0E8BE,50))
plot(ma3, color=color.new(#00EEFF,50))

////////////////////////////////////////////////////////////////////////////////////////////////////////////////////////////////////////////////conditions
//adjust conditions
//-------------------------------------------
longCondition1  = crossover(ma2,ma3)
longCondition2  = close[5] > close[10]
longCondition3  = close[1] > close[2]

shortCondition1 = crossover(ma3,ma2)
shortCondition2 = close[5] < close[10]
shortCondition3 = close[1] < close[2]

closelong       = shortCondition1
closeshort      = longCondition1
//-------------------------------------------

//(leave as is)
longCondition1in  = longCondition1
longCondition2in  = lConSw2 ? longCondition2 : true
longCondition3in  = lConSw3 ? longCondition3 : true
shortCondition1in = shortCondition1
shortCondition2in = sConSw2 ? shortCondition2: true
shortCondition3in = sConSw3 ? shortCondition3: true
longConditions    = longCondition1in and longCondition2in and longCondition3in
shortConditions   = shortCondition1in and shortCondition2in and shortCondition3in

////////////////////////////////////////////////////////////////////////////////////////////////////////////////////////////////////////////////execution
//(leave as is)
long            = sidewayssw ? notsideways and equityCon and longConditions : equityCon and longConditions
short           = sidewayssw ? notsideways and equityCon and shortConditions : equityCon and shortConditions

////////////////////////////////////////////////////////////////////////////////////////////////////////////////////////////////////////////////risk
//(leave as is)
longtplevel     = strategy.position_avg_price * (1 + longtpin)
longsllevel     = strategy.position_avg_price * (1 - longslin)
shorttplevel    = strategy.position_avg_price * (1 - shorttpin)
shortsllevel    = strategy.position_avg_price * (1 + shortslin)

///////////////////////////////////////////////////////////////////////////////////////////////////////////////////////////////////////////////timeframe
//adjust timeframe
//-------------------------------------------
startyear   = 2000
startmonth  = 1
startday    = 1

stopyear    = 9999
stopmonth   = 12
stopday     = 31
//-------------------------------------------

//(leave as is)
startperiod = timestamp(startyear,startmonth,startday,0,0)
periodstop  = timestamp(stopyear,stopmonth,stopday,0,0)
timeframe()    =>
    time >= startperiod and time <= periodstop ? true : false

////////////////////////////////////////////////////////////////////////////////////////////////////////////////////////////////////////////////orders
//comments are empty characters for clear chart
if timeframe()
    if longinc
        if strategy.position_size == 0 or strategy.position_size > 0 
            strategy.entry(id="long", long=true, when=long, comment=" ")
            strategy.exit("stop","long", limit=longtplevel, stop=longsllevel,comment=" ")
            strategy.close(id="long", when=closelong, comment = " ")
    if shotinc
        if strategy.position_size == 0 or strategy.position_size < 0 
            strategy.entry(id="short", long=false, when=short, comment = " ")
            strategy.exit("stop","short", limit=shorttplevel, stop=shortsllevel,comment = " ")
            strategy.close(id="short", when=closeshort, comment = " ")